Kalmar ECO-TECH '07 KALMAR, SWEDEN, November 26-28, 2007
BI OGAS POTENTIAL FROM APPLE WASTE
Yuan Song
Timothy Greer
Yuan Li
Wenjun Wu
Deshai Botheju
Rune Bakke
Telemark University College, Norway
ABSTRACTBiogas production can be used to recover energy from wet organic waste such as food industry residues. In this study, residues from apple juice production at the Epleblomsten juice production plant (Norway) are analyzed to determine the biogas potential.
A series of batch experiments with different initial feed concentrations (0, 1, 2, 5 and I 0%) of the leachate from the apple residues are carried out to find the total biogas potential and to investigate the composition of the leachate. These experiments were also simulated by the ADM I (Anaerobic digestion model No. I) in Aquasim as a method to estimate the chemical composition of the leachate.
According to the batch experimental data together with the simulation results it was estimated that the leachate organic matter consisted mainly of sugar and some organic acids. The estimated concentrations were used in a follow-up study to design and simulate a full scale process. The initial feed concentrations of I and 2% gave high biogas yields, while 5 and I 0% caused an overload and relatively low biogas yields. The biogas production potential was measured as the volume of biogas produced per I L feed consumed. There is no significant relationship between the residue leachate content and the gas compositions. The COD content of the feed was calculated to be about 160 g COD/L.
KEYWORDS
Apple residues; Feed composition; Biogas yield; ADM l Simulations. 4 INTRODUCTION
The utilization and disposal of the wastes from food industry are difficult, due to their inadequate biological stability, potentially pathogenic nature, high water content, potential for rapid autoxidation, and high level of enzymatic activity [I], Methods for treating wet organic solid waste (WOSW) should obtain mass reduction, reuse and recycling. Anaerobic digestion produces biogas for energy recovery and is the only methods available to recycle energy from WOSW to fulfil the requirements for sustainable development.
Anaerobic digestion includes three main steps: hydrolysis, acidogenesis and methanogenesis. Normally those three steps take place in the same reactor, which requires a relatively long time for the particles and macromolecules in the WOSW to be converted into smaller
Kalmar ECO-TECH '07 KALMAR, SWEDEN, November 26-28, 2007
dissolved molecules suitable for methane production. In this study, the hydrolysis step is separated from the methane production. Leachate from hydrolyzed apple residues is used as the organic feed to the biogas production process studied.
The aim of this study is to investigate the biogas production potential of the apple residues from the Epleblomsten juice production plant in Norway. The biogas yield is determined as the amount of biogas produced per liter leachate feed consumed. The experiments were also simulated by the ADM I (Anaerobic digestion model No. I) in Aquasim to estimate the chemical composition of the leachate and biogas yields.
5 MATERIALS AND METHODS 5.1 Apple leachate
The organic feed used in this study is the leachate from solid apple residues left after juice production by an industrial scale fruit press. The leachate is made by mixing the solid waste (80%) with water (20%) with further storage in a tank. The leachate is recovered through a sieve with -I mm openings submerged in the tank. The feed in this case is stored in the feed tank for more than I year, so that most of the degradable organic material is converted into soluble organics.
5.2 Seed sludge
The inoculum seed used in this experiment is mesophilic sludge from a suspended-one- stage anaerobic digestion reactor treating primary sludge at Porsgrunn wastewater treatment plant. 5.3 Experimental design
The batch experiment is perfonned in series of 60 mL medical syringes (Termuro) used as small anaerobic digesters. The content in the reactors is a mixture of apple residues, inoculum and N2-purged water (oxygen free water). Each syringe is connected to a needle blocked by a rubber stopper to stop leakage from gas and liquid. The syringes are kept on a laboratory shaker (Aqua Produktor LY-I), with stirring bars inside the syringes to get a good mixing effect. The batch experiment setup is placed in an incubator (Forma Scientific Steri-Cult Incubator), at a temperature of 35 ± 1.0° C, which is within the optimal temperature range for the mesophilic bacteria [2] (Figure /). Five different load levels: 0, I, 2, 5 and IO weight percentage of apple residues, are tested with 3 parallels for each load level. The remaining volume is filled with equal amounts of inoculum in all syringes and varying amounts of N2 -purged water in order to have the same total liquid volume (30 mL) in all reactors (Table J). 5.4 Measurement method
Produced biogas accumulates inside the syringe by expanding the volume (piston moves). Biagas samples are taken regularly by removing the rubber stopper and pressing it through the needle. The volume of biogas produced is recorded by reading the volume scale of the syringe. The composition of the biogas is analyzed by gas chromatography (Hewlett Packard, P series micro GC).
Kalmar ECO-TECH '07 KALMAR, SWEDEN, November 26-28, 2007
*
Figure I. Batch experimental setup. The left.figure shows the overview of the batch experiment setup with ;yringes on a shaker in an incubator; the right one shows a single ;yringe as an anaerobic digester with a rubber stopper.Table I. Quanlilalive dosing of'apple residue, inoculum and waler in the different reactors. Reactor Residue content Parallels lnoculums Apple residue leachate Ni-purged
No. (weight-%) (ml) (ml) water (ml)
I 0 3 27 0 3.0 2 3 27 0.3 2.7 3 2 3 27 0.6 2.4 4 5 3 27 1.5 1.5 5 IO 3 27 3.0 0.0 5.5 Statistical analysis
The variation of the experimental data is analyzed as standard deviation and the "I-testing" statistics method is used to determine the significance [3]. In this study, the significance is reported at the a of 0.05.
2.6 Simulation method
The experiments are also simulated by the ADM I (Anaerobic digestion model No. I) [4], implemented in Aquasim as a "soft sensor" method to estimate the chemical composition of the leachate and biogas yields. This is done by simulating various possible feed compositions, assuming that the simulation that best matches the biogas production observed is the approximate real feed composition.
6 RES UL TS AND DISCUSSION 3.1 Biogas yield
High biogas production was observed in all 15 reactors, but biogas yield, measured as ml biogas produced per ml feed is much higher in R2 and R3 compared to R4 and R5 (Table 2 and Figure 2). The standard deviation implies that the yield in R2 is not significantly different from the yield in R3 but the yields in R2 and R3 are significantly different from the yields in R4 and R5.
Kalmar ECO-TECH '07
KALMAR, SWEDEN, November 26-28. 2007
Table 2. Accumulated 21- day biogas yield in different batch reactors (variation of the data is analyzed at the significance level of 0.05).
Reactor Residue Volume of Total Biagas Biagas yield
Content apple volume of produced (biogas
(Weight %) leachate biogas from feed produced in ml as feed recorded (total-blank) per feed
(ml) (mL) (ml) consumed in ml) RI 0 (blank) 0 77±13 R2 I 0.3 107±12 30±1 100±3 R3 2 0.6 136±10 59±3 98±5 R4 5 1.5 114±6 37±7 25±5 RS I O 3.0 145±5 68±8 23±3 � 120 Q,) E "' ::, 10 15 20 25 u u time(day)
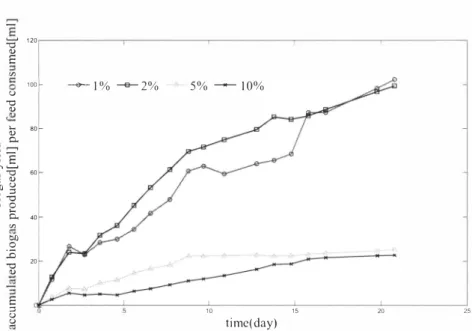
Figure 2. Accu111ulated biogas production (ml) per apple leachate.feed (111L).
The reason why the initial organic feed influence the biogas potential can be due to overload in cases R4 and RS (Figure 2). The initial feed concentrations of I and 2% (weight percentage) gave high biogas yields throughout the experiment, while the 5 and I 0% feed gave relatively low biogas yields. In the middle the experiment, their biogas yield curves are almost flat, implying that the biogas production almost stopped due to overload problems. Propionate (HPr), a major identifiable intem1ediate product in anaerobic process, accumulate when the process is overloaded, leading to pH drops. Methane production stops at pH less than 6.2, as methanogenesis is thennodynamically unfavourable [5]. Such overloads can shut down treatment plants for several weeks [6]. Therefore, it is of importance to consider the overload issue when doing the biogas production potential analysis.
100[-u -0 Q,) � 80 -0 a.
-�
Q,)-;:: ·- C:>-,� c.r.i "O 60 "' Q,) Oil u 0 ::, ·- -0 .0 2 0. 40 "' Oil 0 i3 -0 Q,) E 20 -<>-I % -e-2% 5% - I O%�
""
�
=
"
�Kalmar ECO-TECH '07 KALMAR, SWEDEN, November 26-28, 2007
.AN:amalated Wops yield_tu
''°k
·:----◊-◊---. 0 m..
oo:00 Q 00510
15 20 25 30 timelday]Aa: ... lllateol bilJcas yield -R3
i
:: k
i:;:iOO QC : 0 00 0 :E O O 5 15 20 30 lO timeLday] 20 o o 1��0 0 0 1.'i 10 "i ___25 0 0 --,o�--s----.-0---.-s---2-0 ______,3 timelday]Acc: ... alatftl biops yicld_RS
30 � 0 20 0 0 0 � 0 0 0 00 ·
=
0 O O 5 10 15 20 25 30 timelday)Figure 3. Comparison of'the experimental data with the simulation curve on the accumulated biogas yield. the circles represents the biogas yield datafi·om the experiments while the curves are the si11111latio11 results.
3.2 Simulations on ADM I model
The biogas potential determined as the volume of biogas yield per I mL leachate consumed was also simulated in the ADM I model. The simulations based on the initial feed composition that best fits the experimental data for the best tests (R2 and R3) are shown in Figure 3. The leachate organic matter consisted mainly of sugar and some organic acids, which is consistent with results from the literature, confirming that apple residues are abundant of sugars, organic acids. amino acids, phenolic compounds and fatty acids [7]. The estimated concentrations were shown in Table 3 and they were used in a follow-up study to design and simulate a full scale process. Note that the simulations of the experiment give
�--·,
Kalmar ECO-TECH ·07 KALMAR, SWEDEN. November 26-28, 2007
consistent total biogas yields with those observed for the four cases tested ( 1, 2, 5 and 10% leachate feed).
Table 3. Apple leachate compositions in ADM I.
Substrate I 00% apple leachate Substrate I 00% apple leachate
concentration (g/L) concentration (g/L)
Amino acid 7.4 Elemental 0
(S_aa) hl'drogen (S h2)
Total acetate 2.4 Total propionate 8.9
(S_ac) (S rro)
Total butyrate 7.0 Monosaccharides 131.5
(S_bu) (S_su)
Long chain fatty 1.4 Total valerate 0.6
acids (S_fa) (S_va)
Soluble inert COD O Carbon content of 0
(S I) methane (S_ch4)
Total substrate COD (S_coo) =S_aa+ S_ac+ S_bu+ S_fa+ S_l+ S_h2+ S_pro+ S_su+ S_va+ S_ch4
=159g/L
3.3 Biogas composition analysis Q) CJ) "" 100 ;- ·--1 r ·--, c ;- • - • 1 � 80 ffi ,·-·1 a. 60 C 0
l
��
I
40 "iii §-0 20 0 ,,, 0 R1 R2 R3 RI R5 CJ)Figure 4. Biagas composition analysis
The majority of the biogas produced is methane in all experiments, while there is also some carbon dioxide and other gases (Figure 4). No significant relationship between the feed residue content and the gas compositions is detected.
Kalmar ECO-TECH '07
KALMAR, SWEDEN. November 26-28, 2007
Table 3. COD content of the feed (under the assumption that all the degraded COD are C0/1\'erted into the methane and methane accounts for 65% of the biogas),
Residue Volume of Biogas Biogas yield Methane COD
Content apple leachate produced from (biogas produced yield content of
(Weight %) as feed feed in mL per feed (mL) the feed
(mL) (total-blank) consumed in mL) (g/L) (mL) 0,3 30 ± I 100 ± 3 65 ± 2 162 ± 5 2 0,6 59 ± 3 98 ± 5 64 ± 3 160 ± 8 5 1.5 37 ± 7 25 ± 5 16 ± 3 40 ± 7 10 3,0 68 ± 8 23 ± 3 14 ± 2 35 ± 4
3.4 Biogas potential analysis based on COD mass balance
In anaerobic processes, the amount of methane produced per unit of COD converted is 0.40 L at 35''C, giving 0.40 L CH4/g COD [8]. According to this ratio, the COD content of the feed
converted to biogas was calculated (Table 3). It is assumed that the COD converted to
biomass can be neglected. The results show that the COD content removed in RI is 160 g COD/L Assuming that all degradable COD in the feed is converted to biogas during the 21 d experiment it is concluded that the COD content of this apple waste leachate is (at least) 160 g COD/L There was, however, some biogas production at the end of the 21 days experiment, suggesting that the COD content is even higher than 160 g/L
3.5 Estimations the total biogas potential of the apple waste
For the Epleblomsten juice production plant in Norway, the largest energy demand in a year is 400 kWh/d during the production period. This requires 70 m 3 biogas produced per day
(assuming that the energy content of methane is 35,846 KJ/m3 at 0 ° C, I atm and biogas
behaves as idea gas and the methane content is 65% of the biogas [8], Based on biogas yield measured here the input feed to a biogas reactor must be 0. 7 m 3 per day. It is assumed that this
amount of leachate can be produced from the total mass of WOSW produced at Epleblomsten Juice production plant,
7 CONCLUSIONS
It can be concluded that the leachate from hydrolysis of apple WOSW is suitable for biogas production. It has a high content of degradable organics (> 160 g COD/L), mainly sugar and acids, implying a potential biogas yield of >64 L methane per I L feed. It is of importance to consider the overload issue when producing biogas based on such strong feeds, No significant relationship between the leachate content and the gas compositions is detected.
Biogas production experimental data together with ADM I simulation results is a useful tool to estimate the leachate organic matter content (mainly of sugar and some organic acids), The syringe batch reactors were suitable for quick experimental determination of the biogas potential for WOSW, reflected in low standard deviation between parallel reactors. This small scale batch experimental method used to analyze the biogas potential from the food wastes is an easy method to determine biogas yields. The results show that the fruit juice production can cover its energy needs based on biogas from the fruit residues.
Kalmar ECO-TECH '07
KALMAR, SWEDEN. November 26-28. 2007 ACKNOWLEDGEMENTS
We acknowledge the efforts by our Lab. Chief H.H. Haugen for providing assistances and suggestions during this study. And this work was supported by the Norwegian Science Funds.
REFERENCES
[ I ] Russ, W., Pittroff, R.M., 2004. Utilizing waste products from the food production and processing industries. Critical Reviews in Food Science and Nutrition. 44 (I), 57-62. [2] Henstra, A.M., Sipma, J., Rinzema, A., Starns, A.JM., 2007. Microbiology of synthesis
gas fennentation for biofuel production. Current opinion in Biotechnology. 18,200-206.
[3] Spiegel, M.R., 1972. Schaum's outline of theory and problems of statistics in SI units.
McGraw-Hill, Inc., New York.
(4] Batstone, D.J., Keller, J., Angelidaki, I., Kalyuzhnyi, S.Y., Pavlostathis, S.G., Rozzi, A., Sanders, W.T.M., Siegrist, H., Yavilin, V.A., 2002. Anaerobic Digestion Model No. I (ADM!), !WA Task Group for Mathematical Modeling of Anaerobic Digestion Processes. IWA publishing, London.
[5] Mumleitner, E., Becker, T.M., Delgdo, A., 2002. State detection and control of overloads in the anaerobic wastewater treatment using fuzzy logic. Water Research. 36, 20 1-2 1 1.
[6] Xing, J ., Criddle, C., Hickey, R., 1997. Effects of a long-tem1 periodic substrate perturbation on an anaerobic community. Water Research. 3 1 (9), 195-204.
[7] Jihong, W., Haiyan, G., Lei, Z., Xiaojun, L., Fang, C., Zhenfu, W., Xiasong, H., 2007. Chemical compositional characterization of some apple cul ti vars. Food che111ist1y, I 03 (I), 88-93.
[8] Tchobanoglous, G., Burton, F.L., Stensel, H.D., 2003. Wastewater Engineering: