School of Innovation, Design and Engineering GKN Driveline Köping AB
Risk Management and Logistic Improvement of
Oil Handling in Gear Manufacturing
Master thesis work
Innovative Production
30 credits, D-level
Product and process development, Concurrent Engineering Master Thesis Programme Innovation and Product Design
I Author: Ghada Elassar
Title: Risk Management and Logistic Improvement of Oil Handling in Gear Manufacturing
Report code: KPP231
Presentation day: 14 June 2013
Commissioned by: GKN Driveline AB Köping
Tutor (company): Anders Mellberg
Senior manager at GKN Driveline , Maintenance
Tutor (university):
Martin Kurdve
Senior Lecturer at School of Innovation, Design and Engineering
Examiner: Sabah M Audo
Senior Lecturer at School of Innovation, Design and Engineering
Year of publication: 2013
Language: English
II
Abstract
Nowadays, safety and environmental awareness about the increased industrial accidents have become a critical issue that concerns both, individuals and governmental policies. This leads to higher demands on the manufacturing industry to be safer and more environmentally friendly. Recently, there has been a number of industrial accidents and serious fires in the world that have increased because of using plastic composite IBC containers in industrial manufacturing. And this becomes a common important issue for all manufacturers that strive to improve their environmental performance.
The main purpose of this thesis is to investigate different available options of oil fluid storage and transportation in the industry, and to identify the most crucial factors related to each storage and transportation mode. Those factors are investigated and highlighted regarding to their effect on quality, environment and work environment. The thesis also aims to investigate and analyse the hazards associated with oil storage in the plant and in the warehouse and to use risk management strategies in order to identify and mitigate risks in the early stages. The work is carried out at GKN Driveline Köping AB that required a study of the methods used in industry for oil storage and transportation. Therefore the work focuses on identifying
suppliers’ different transportation processes including different packaging options.
This report includes an explanation of the methodology that is used to perform the task that the company has entrusted, and also contains a review of the comprehensive literature study. The method used to investigate hazards associated with oil transportation and storage is risk management that includes risk assessment tools, FMEA analysis and Ishikawa diagram. FMEA is performed to analyse both, the company’s current process and the process of filling oil by tank trucks regarding quality, environment and work environment. Benchmarking is another analysing tool used to analyse Volvo Power train and GKN Driveline different performances. The empirical findings are analysed by utilizing the JIT philosophy to identify the non value added activities and then determine the inconsistency with JIT philosophy. Kaizen and possible improvements are identified as well, with the help of the visual map VSM. The results that have been achieved are presented and modified according to what suppliers can provide, what the law demands, what the insurance requires and even what fits with the plant structure. The conclusion includes a description of the relation between internal and external logistics and how the synergy between them affects the choice for different
transportation processes. It also includes a suggestion for possible improvement regarding logistical costs and transportation costs.
III
Acknowledgements
Now, at the end of my fourth year and at the last station of my valuable learning
journey at Mälardalens University, I would like to take this opportunity to express my
gratitude to various people, who have been instrumental in my successful completion
of Masters of Science in Engineering.
Firstly, I am highly indebted to Anders Mellberg my supervisor at GKN, for his guidance
and constant supervision as well as for providing necessary information regarding the
project. I am also grateful to be offered the opportunity to conduct this project at GKN
Driveline Köping that enriched my knowledge, regarding manufacturing industry. I
really appreciate all the staff that supported and helped me in collecting the data during
my work. I would like to thank Inger Ericsson, Ann-Helen Ringstad and ÅKe Ivarsson,
who have been very resourceful and have supported me with their expertise.
I am really grateful and I would like to thank my supervisor at Mälardalens University
Martin Kurdve, for his professional guidance, valuable support and constructive
recommendations on this project.
Finally, I wish to express sincere appreciation for my family for all the support and
encouragement throughout my study, especially my beloved children Mohammed,
Khaled, Farah and Eyad.
Köping on 30 June 2013
_________________________IV
GLOSSARY
AWD
An acronym for All- wheel drive. It is the system that powers all four wheels of a vehicle Accident
An abnormal event which has a direct negative impact on human health or the environment DSV
A global supplier of transport and logistics services FMEA
Failure mode and effect analysis is one of the first systematic techniques for failure analysis Hazard
The property of a material that has the potential to cause harm to people, property or the environment IBC
Intermediate bulk container is a container used for transport and storage of oil, food and chemicals Incident
An abnormal event which could lead to direct negative impact on human health or the environment JIT
Just-In-Time JIT is a set of principles and tools for low budget and high profit Kaizen
A Japanese word that stands for improvement or change for the better Lead time
Time between the initiation and execution of a process Muda
A Japanese word that stands for waste and any activity in your process that does not add value Mura
A Japanese word that stands for unevenness and any variation leading to unbalanced situations Muri
A Japanese word that stands for overburden, activity creating unreasonable effort for man or material PDSA
The improvement cycle Plan – Do – Study – Act PTU
Power Take Off Unit is placed in connection to the Gear box and transfers the power to RDU RDU
Rear Drive Unit. Gear axle that transfers the power from the front to the rear wheels Reverse logistics
All operations related to the returned back products to the firm for reuse, recycling or disposal Risk
The probability of Occurrence x Severity if occurred x Probability of detection and hindering impact RPN
Risk Priority Number is a risk measurement used in the evaluation of FMEA SQA
Supplier Quality Assurance is the methods and processes used to ensure quality VSM
V
Abbreviations
AFS Swedish Work Environment Authority
AWD All- wheel drive
EPA Environment Protection Agency FMEA Failure mode and effect analysis
H&S
Health and safety
IBC Intermediate bulk container
JIT Just-In-Time
MSB The Swedish Civil Contingencies Agency
OK-Q8 OK: Economic Association - Q8: Kuwait
PDSA
Plan – Do – Study – Act PTU Power Take Off Unit RDU Rear Drive Unit
RPN Risk Priority Number
SFS Svensk författningssamling
SQA Supplier Quality Assurance
TPS Toyota Production System
UV Ultraviolet
VSM Value Stream Mapping
VI
Table of Contents
1. INTRODUCTION... 1 1.1BACKGROUND ... 1 1.2AIM OF PROJECT ... 1 1.3PROBLEM DESCRIPTION ... 1 1.4PROBLEM STATEMENT ... 2 1.5DELIMITATION ... 31.6COMPANY PRESENTATION-GKNDRIVELINE KÖPING ... 4
1.7HEALTH AND SAFETY AT GKN ... 6
2. RESEARCH METHODOLOGY ... 7
2.1WORKING PROCESS ... 7
2.1.1 PDSA cycle ... 7
2.1.2 Ulrich Model ... 8
2.1.3 Thesis research approach ... 9
2.2APPLIED RESEARCH METHODS ... 10
2.2.1 Data gathering ... 10 2.2.2 Literature review ... 11 2.2.3 Interviews ... 12 2.2.4 Benchmarking ... 12 3. THEORETICAL FRAMEWORK ... 14 3.1LEAN ... 14 3.2JUST-IN-TIME ... 14 3.2.1 Types of waste ... 15
3.3VALUE STREAM MAPPING ... 17
3.4RISK MANAGEMENT ... 18
3.4.1 Risk assessment ... 18
3.4.2 Legal demands ... 20
3.4.3 Ishikawa diagram ... 21
3.4.4 Failure mode and effects analysis ... 22
4. EMPIRICAL RESULTS ... 24
4.1OIL STORAGE AND TRANSPORTATION MODES ... 24
4.1.1 Oil barrels ... 24
4.1.2 Intermediate bulk container ... 25
4.1.3 Tank trucks for oil transportation ... 27
4.1.4 Pipeline transportation ... 27
4.2DETERMINANT FACTORS FOR OIL STORAGE AND TRANSPORTATION ... 28
4.3CURRENT SITUATION ... 28
4.3.1 Supplier ... 29
4.3.2 Warehouse ... 29
4.3.3 GKN Plant ... 30
4.3.4Reconditioning and reusing IBC ... 35
5. ANALYSIS OF EMPIRICAL RESULTS ... 36
5.1BENCHMARKING ... 36
5.2RISK ASSESSMENT ... 37
5.3ISHIKAWA DIAGRAM ... 38
5.4FMEA ... 39
5.4.1 FMEA for IBC ... 39
5.4.2 FMEA for oil delivery by a tank truck ... 40
5.5INCONSISTENCY WITH JIT ... 44
5.6VALUE STREAM MAPPING ... 46
VII
6. RESULT ... 50
6.1IBC CONTAINER HEATER ... 50
6.2DISPENSING CABINET... 51
6.3CUTOFF DESIGN FOR THE STORAGE OF IBCS ... 53
6.4FILLING OIL BY TANK TRUCKS ... 55
7. DISCUSSION & CONCLUSION ... 60
7.1RESEARCH CONTRIBUTION ... 60
7.2THE INTEGRATION BETWEEN INTERNAL AND EXTERNAL LOGISTICS ... 61
7.3CONCLUSION ... 62
7.4DISCUSSION FOR POSSIBLE IMPROVEMENT ... 65
7.5RECOMMENDATION ... 65
8. REFERENCES ... 66
VIII
Table of Figures
FIGURE 1:FIRE AND OIL RELEASE FROM A BURNED IBC(METANOUSA 2009). ... 2
FIGURE 2:GKNDRIVELINE KÖPING HISTORY,(GKNDRIVELINE 2013). ... 4
FIGURE 3:AWD PRODUCTS (GKNDRIVELINE 2013). ... 5
FIGURE 4:PRODUCTS 2011(GKNDRIVELINE 2013). ... 5
FIGURE 5: THINKSAFE!(GKNDRIVELINE 2013). ... 6
FIGURE 6: THINKSAFE! POSTER (GKNDRIVELINE 2013). ... 6
FIGURE 7:PDSA CYCLE (MUNRO 2009). ... 7
FIGURE 8:ULRICH MODEL (ELASSAR 2012). ... 8
FIGURE 9:FLOWCHART FOR THE THESIS WORK PROCESS. ... 9
FIGURE 10:RESEARCH METHODS USED TO ACCOMPLISH THESIS OBJECTIVES. ... 10
FIGURE 11:BENCHMARKING PROCESS DONE BY ELASSAR (2013) AND BASED ON JACKSON &LUND (2000). ... 13
FIGURE 12:VALUE STREAM MAPPING (ELASSAR 2013). ... 17
FIGURE 13:RISK ANALYSIS FLOWCHART ... 19
FIGURE 14:ISHIKAWA DIAGRAM BASED ON KRAJEWSKI ET AL.(2010), (ELASSAR 2013). ... 21
FIGURE 15:FLOWCHART FOR FMEA GOAL. ... 22
FIGURE 16:FMEA TYPES (FMEA-FMECA2006) ... 23
FIGURE 17:METAL BARREL (DOMAIN- B 2013). ... 24
FIGURE 18:PLASTIC BARREL (BIZTRUMPET 2013)... 24
FIGURE 19:PLASTIC COMPOSITE IBC(AMPHORAE 2013). ... 25
FIGURE 20:PLASTIC COMPOSITE IBC COMPONENTS (ACCON 2013). ... 25
FIGURE 21:STEEL IBCCONTAINER, ... 26
FIGURE 22:BAG-IN-BOX (AUER-SHOP 2013)... 26
FIGURE 23:STACKED EMPTY BAG IN BOX (TPS2013). ... 26
FIGURE 24:FILLING OIL BY USING A TANK TRUCK (TYA2013). ... 27
FIGURE 25:THE MOST IMPORTANT FACTORS FOR OIL STORAGE ... 28
FIGURE 26:FLOWCHART FOR THE OIL DELIVERY IN THE SUPPLIER’S ORGANIZATION. ... 29
FIGURE 27:FLOWCHART SHOWS AREAS WHERE IBCS TRANSFERS WHEN THEY DELIVERED. ... 29
FIGURE 28:THE PLANT LAYOUT AND IBCS MOVEMENT ILLUSTRATION (GKN2013), EDITED BY ELASSAR (2013). . 30
FIGURE 29:PRODUCTION LINE R-60 LAYOUT (GKN2013) AND EDITED BY ELASSAR (2013). ... 31
FIGURE 30:PRODUCTION FLOW IN R60. ... 32
FIGURE 31:FULL AND EMPTY IBC IN THE PRODUCTION LINE (GKN2013) AND EDITED BY ELASSAR (2013). ... 32
FIGURE 32:PRODUCTION FLOW IN “76”(GKN2013), EDITED BY ELASSAR (2013). ... 33
FIGURE 33:PRODUCTION FLOW IN “76”. ... 33
FIGURE 34:IBCS STACKED NEAR ROBOT CELL . ... 34
FIGURE 35:FULL NEW IBC READY TO USE. ... 34
FIGURE 36:PRODUCTION LINE 76 LAYOUT (GKN2013) AND EDITED BY ELASSAR (2013). ... 34
FIGURE 37:GENERAL IBCCLEANING PROCESS DIAGRAM (ELASSAR 2013) BASED ON (EPA2013). ... 35
FIGURE 38:WASHING IBCS (ALL-EMBALLAGE 2013). ... 35
FIGURE 39:FLOWCHART FOR OIL DELIVERY BY TANK TRUCKS. ... 36
FIGURE 40:RISK ASSESSMENT FLOWCHART. ... 37
FIGURE 41:ISHIKAWA FOR IBC. ... 38
FIGURE 42:ISHIKAWA FOR TANK TRUCK TRANSPORTATION. ... 38
FIGURE 43:FMEA FOR IBC-PART 1. ... 39
FIGURE 44:FMEA FOR IBC-PART 2. ... 40
FIGURE 45:QUALITY FMEA FOR FILLING OIL BY TANK TRUCKS. ... 41
FIGURE 46:ENVIRONMENTAL FMEA FOR FILLING OIL BY TANK TRUCKS. ... 42
FIGURE 47:WORK ENVIRONMENT FMEA FOR OIL TRANSPORTATION BY TANK TRUCKS. ... 43
FIGURE 48:FLOWCHART FOR THE CURRENT PROCESS ACCORDING TO JIT PERSPECTIVE. ... 44
FIGURE 49:ILLUSTRATION FOR THE CONNECTION BETWEEN MURA,MURI AND MUDA. ... 46
FIGURE 50:VSM FOR SUPPLY, MOVEMENT AND PRODUCTION IN THE PLANT. ... 46
FIGURE 51:CASTROL’S SUPPLY PROCESS . ... 47
FIGURE 52:VSM INCLUDE KAIZEN IN THE CURRENT PROCESS. ... 47
FIGURE 53:FLOWCHART FOR THE ANALYSING PROCESS IN THIS THESIS. ... 49
FIGURE 54:IBC HEATER (BRISKHEAT 2013; ... 50
FIGURE 55:THE RECENT PROCESS INSIDE THE PLANT. ... 50
FIGURE 56:THE SUGGESTED PROCESS WITH NO EXTRA ACTIVITIES. ... 50
IX
FIGURE 58:FRONT SIDE OF DISPENSING CABINET WITH ... 52
FIGURE 59:TWO DOORS ON THE BACKSIDE... 52
FIGURE 60:FIRE SHUTOFF VALVE. ... 52
FIGURE 61:PERFORATED RACKS... 52
FIGURE 62:3D IMAGE FOR IBCS INVOLVEMENT IN A FIRE, DONE IN SOLIDWORKS PROGRAM. ... 53
FIGURE 63:CURRENT RACKS IN THE INTERNAL WAREHOUSE. ... 53
FIGURE 64:A CUTOFF DESIGN PROPOSAL, DONE IN SOLIDWORKS. ... 53
FIGURE 65:CHANGE OF THE CURRENT RACKS TO CUTOFF RACKS. ... 54
FIGURE 66:ATTACHED STORAGE BUILDING WITH A CUTOFF DESIGN. ... 54
FIGURE 67:FLOWCHART FOR FILLING OIL PROCESS BY TANK TRUCKS. ... 56
FIGURE 68:ILLUSTRATION FOR OIL FILLING PROCESS BY TANK TRUCKS. ... 56
FIGURE 69:VALUE STREAM MAPPING FOR OIL TRANSPORTATION BY USING TANK TRUCKS. ... 57
FIGURE 70:THE ELIMINATED ACTIVITIES WHEN A TANK TRUCK SUPPLIES OIL. ... 57
FIGURE 71:LAYOUT FOR LOADING AND UNLOADING AREA AT GKN PLANT. ... 59
TABLE 1:PHASES IN THE THESIS WORK PROCESS AND THE ACTIVITIES IN EACH PHASE ... 9
TABLE 2:THE FLASH POINT FOR THE MOST CONSUMED OILS ... .51
TABLE 3: DATA FROM SUPPLIERS ABOUT THEIR LOADING CAPACITY FOR OIL DELIVERY BY A TANK TRUCK ... 56
1
1. Introduction
This Chapter includes a description of the thesis background and the aim of the project.
The problem is described thoroughly then it is followed by the problem statement that
includes the research questions. Then the Chapter ends with delimitations and a
presentation of GKN Driveline Köping.
1.1 Background
The work has been carried out at GKN Driveline Köping AB. The company required an
investigation about different methods that are used for oil storage and transportation in the industry. The research should take into consideration some important aspects such as maintaining oil quality, prevention of contamination, environmental safety and work environment safety.
This report includes an explanation of the methodology that is used to perform the task that GKN has entrusted, and also contains the tools and methods that have been applied to accomplish the desired results. The results that have been achieved are presented in this report as well.
This work focuses on identifying suppliers’ different transportation processes including different packaging options, in order to investigate the best possible delivery to GKN plant.
1.2 Aim of project
The thesis contributes in assessment and reduction of risks associated with the storage of oil packed in IBC containers at the GKN Driveline plant and assist to improve the industrial results according to the academic applications.
The objective of the thesis is to investigate different available options to store and transport transmission oil, and to inspect the related factors to those different transportation modes. A risk analysis of those factors is expected to facilitate decision making for the manufacturer. The thesis work also investigates the relation between internal and external logistics and how the synergy between them affects the choice of different transportation processes.
1.3 Problem Description
Oil is a very useful raw material and an important component of a variety of products. Oil is usually stored in different types of containers, such as bulks, barrels or IBCs. IBCs have become very widely used nowadays, not just in transport for which they were originally designed, but also for longer term storage, and even in production usage. GKN Driveline as a manufacturer of automotive gears utilizes several types of oil fluids as a filling material in gear components or as a cutting fluid for metal processing. Those oils usually transports to GKN in IBC containers from three different suppliers.
GKN utilizes different transmission oils in nine production lines for manufacturing of automotive gears where oil fills in gear components as an integrated part. Each production line utilizes one or two types of transmission oils depending on the type of the gear that produces and the variation in
2
production on each production line. Production lines, that use two different types of oil, usually stack two IBCs on each other.
Two main problems may occur during the storage of IBCs. The first one is connected to the warehouse low temperature, especially in winter because the warehouse is not supported with heating units, which can damage the oil quality and properties as well. Exposing oil fluid to low temperature causes additive separation so they build up layers. The additives need to be dissolved again by mixing or reheating the oil. Some sensitive oils, such as Haldex oil, can be totally damaged because of the additive separation. Reheating and mixing are useless in this case because additives will not dissolve again. On the other hand the cold oil may cause delay in the raw material flow, stop in production or even affect product quality. And even more, this causes inventory accumulation because the oil has to be stored until its temperature stabilizes to room temperature and the additives dissolve together again.
The other problem is that the plastic composite IBCs are vulnerable to ignition and classified as non fire safe material, with a high risk probability. IBCs fail rapidly when they are exposed to a fire and the plastic material melts directly. See figure 1. After failure, IBCs release their contents in a few seconds which lead to fire spread and rapid involvement of more IBCs. IBCs are not allowed to be stacked near walls inside the plant and even inside the warehouse because the oil may leak and seep through walls. See Appendix 2.
Another essential aspect of this work is the importance of oil quality and purity. It is widely accepted that oil contamination is one of the major causes of component failure. IBC is the best choice in this case because its material does not make any chemical reactions with oil and protects the oil from contamination during transportation and storage as well. Some contamination risk may occur during oil filling because dust and other contaminants from surrounding environment may accumulate inside IBCs because they may be left open before filling with oil.
GKN plant uses also cutting fluid for metal processing with similar conditions as transmission oils i.e. cutting fluids are transported in the same packaging, stored in the same cold warehouse. IBCs also stack over each other in the warehouse and when they utilized in production.
1.4 Problem statement
The problem statement sets out the problems and issues to be investigated and resolved in the thesis. The challenge of this project is how to improve the logistic supply process for transmission oils and how to evaluate different alternatives to IBC containers for a safer environment and better storage conditions.
The main focus of this project is to answer the following research questions:
RQ 1: What are the available supply options for oil transportation and storage? RQ 2: What are the consequences of changing external logistics on internal logistics?
RQ 3: How effective are the different options compared with different requirements, such as safety and quality?
RQ 4: How could risk management and Just In Time be utilized to improve the logistic process for transmission oils used in gear manufacturing at GKN Driveline?
Figure 1: Fire and oil release from a burned IBC (Metanousa 2009).
3
1.5 Delimitation
This work is held out to investigate available solutions for oil handling and includes a study for both the external- and the internal oil transportation and storage. In order to study the external oil handling, it requires to investigate the company’s suppliers and to evaluate their supply chain procedures. All the suppliers will be studied thoroughly and the outlines of their supply chain will be investigated, as well. Due to the lack of time and the complications in interviewing different
suppliers in different large organizations, the choice of which supplier that will be studied more, is based on the quantity and diversity of oil types that they provide to GKN plant and their extent of cooperation in providing information for this project. To study one supplier closely requires a lot of investigations, detailed information gathering and continuously interviewing, which is time
consuming.
Lean philosophy includes many principles and tools that cover many different aspects. Thus only associated tools and principles to the thesis main problem will be studied and presented. Just-In-Time will be conducted to take advantage of this improvement philosophy that focuses on waste elimination, inconsistencies in the process, and unreasonable requirements. Value Stream Mapping is a Lean technique that also will be applied in this work in order to document, analyse and improve the flow of oil.
4
1.6 Company Presentation- GKN Driveline Köping
GKN Driveline is a part of the GKN global engineering group that contributes with technologies and products for vehicles and aircraft. GKN operates four divisions:
GKN Land Systems - “is a global leading supplier of technology differentiated power management solutions and services. We design, manufacture and supply products and services for the
Agritechnical, Construction, Mining and Utility vehicle markets and key Industrial segments, offering integrated PowerTrain solutions.” (GKN Driveline, 2013).
GKN Aerospace - “is a first tier supplier to the global aviation industry. A leader in the manufacture of highly complex composite and metallic aerostructures and engine products, our business is equally focused on military and civil markets.” (GKN Driveline, 2013).
GKN Powder Metallurgy – “comprises GKN Sinter Metals, the world’s largest manufacturer of sintered components and GKN Hoeganaes which produces metal powder used in the manufacture of these components.” (GKN Driveline, 2013).
GKN Driveline – “The world’s leading manufacturer of automotive driveline components”. That has around 20,000 employees in more than 40 facilities in 23 countries working in corporate with vehicle manufacturers. (GKN Driveline, 2013).
GKN Driveline Köping AB
The company was founded in 1856 as Köpings mechanical workshop as the figure below shows. GKN was until September 30, 2011, owned by Getrag, Volvo Cars and Dana. The company started at the beginning of the last century developing advanced gear cogs. In 1996, the first systems for four-wheel drive was developed at GKN. The four wheel-drive system was developed by using high technology and advanced automated production system.
Nowadays, GKN Driveline Köping, with a head office in Köping, is a leading manufacturer of automotive Driveline components with a wide range of manufacturing components. GKN plant has around 800 employees in a production area of 70 000 square meters. GKN Driveline Köping products distribute worldwide to global customers such as example Volvo, Land Rover, Ford, BMW, Porsche and Dacia.
GKN Driveline accomplished record result for 2012, despite the fact that car sales are described as the worst in Europe for the last eighteenth years, where GKN’s global sales increased by thirteen percent and were estimated for about 2 billion.
5
GKN Driveline Köping production
GKN Driveline Köping produces Rear Drive Units (RDU) and Power Take-off units (PTU) as figure 3 shows after the demand for global car manufacturers all over the world. See figure 4.
Figure 3: AWD products (GKN Driveline 2013).
6
1.7 Health and Safety at GKN
Safety is a core value to GKN company that strives to improve their protective safety system by forming guidelines and developing an information system within these guidelines. GKN provides a high standard of safety and always aims to secure the highest level of safety for employees by implementing safe behaviours, safe systems and safe practices for everyone. GKN carries its own safety program “thinkSAFE!” that supports the continuous improvement of H&S performance.
is a learning tool that has been developed by GKN over the last 2 years, and it will be the foundation for many of the things that GKN do in the future.
The GKN risk and safety initiative, thinkSAFE! has a visual identity with certain guidelines and specific outlines to ensure that thinkSAFE! is applied in a consistent manner throughout the company. The aim of thinkSAFE! is to eliminate work related illnesses and injuries that comply with the requirements of the legislation in each jurisdiction.
“thinkSAFE! is the visual element that demonstrates our commitment to improving safety within GKN”(GKN Driveline 2013).
thinkSAFE! Is a system that creates a H&S culture, especially in GKN plants and is based on all employees accepting of full responsibility. The program provides all employees safety with the opportunity to improve their workplace by eliminating unsafe conditions and behaviours. thinkSAFE! has certain objectives:
Proactively identifying potential H&S risks to themselves and their colleagues
Applying lessons learned from related incidents & established best practice
Removing risks or increasing a sufficient management for action
This safety system is a visual element that demonstrates the company’s commitment to improve safety within GKN. Those elements must be implemented correctly and used imaginatively. All reproductions of the elements are shown within the thinkSAFE! visual identity. This visual identity illustrates the safety guidelines in a form of artwork and examples supplied on the thinkSAFE! The figure below shows a poster for the” doMORE!” program within thinkSAFE!. This poster aims to stimulate employees to remember important rules and enhance them for continuous improvement in the workplace.
Figure 6: thinkSAFE! poster (GKN Driveline 2013). Figure 5: thinkSAFE! (GKN Driveline 2013).
7
2. RESEARCH METHODOLOGY
This Chapter includes a presentation of the thesis working process which is a
combination between two different scientific approaches. The Chapter also includes the
research tools that are contributed to a methodological performance of this work.
2.1 Working process
This Section includes a presentation of the thesis plan to conduct this work, which is done to achieve the thesis objectives. The work process is a combination between the two different methodical problem solving processes; PDSA cycle and Ulrich model. The outlines for those models are presented and described shortly, since both were an inspiration source to develop and customize the thesis working model.
2.1.1 PDSA cycle
PDSA is the improvement cycle (Plan – Do – Study – Act ) as figure 7 shows. PDSA is an iterative four-step management strategy used for the control and continuous improvement of processes and products. According to Munro (2009), PDSA is an improvement cycle used as a road map to work through a process in order to identify potential aspects that can be improved. The cycle should be repeated until the process accomplishes the desired result, where the four steps in PDSA are guidelines for the work progress.
PDSA four steps are (Langley et.al 2009):
Plan
- the change that is intended to be changed.Establish a plan for what is to be worked on by defining the objectives, prediction and the problem questions. Then plan data collection to answer those questions.
Do
- carry out the test or change.Implement the plan, execute the process and carry out the test or change and begin data analysing
Study
-collected data before and after you make a change and reflect on what was learned.Complete the analysis of previously collected data and compare data with predictions, then summarize what was learned
Act
- plan the next change cycle or complete implementation of the accomplished results. Decide whether to finish the cycle or begin it again. Plan the next cycle if the results are not good enough to apply or implement or implement the changes that have been accomplished.8
2.1.2 Ulrich Model
Ullman 2010 describes in his book that the innovation process for product and process development comes through consistently. He recommended an approach to an improvement process with a practical overview of a modern development process, Ulrich model as the figure below shows.
Ulrich model five stages are (Elassar 2012): 1. Identifying customer needs
The target must be identified and the customer needs must be defined as well, in order to get a steady start to the development process and to determine the work guidelines.
2. Establish target specifications
Specifying project objectives and establishing these specifications by understanding the problem to find the best way to solve it. It is also important to perform a competitor analysis in order to keep pace with market developments.
3. Generate product concept
Concept generation is to generate ideas through creating new ideas or developing existing ideas. Prototypes can be also further developed if it is needed to test possible solutions. 4. Concept selection
One or more concepts are selected for further development and analysing. 5. Further development
Concept refinement and development is the last stage in this process. Then the component / process investigates further more. It is also important to conduct an economic analysis because it determines how the process will be implemented and how the plans will be performed.
9
Plan
Study
Analyse
Improve
2.1.3 Thesis research approach
The thesis research approach is an inspiration of the two previous models that resulted in a new combined model. See figure 9. This combined model is generated to fit the thesis outlines and requirements.
The work process is planned in a harmonic sequence, where each step creates a milestone to the next and it is divided into four main phases to accomplish the desired result. Those four phases are planning, studying, analysing and improving, where each phase has certain activities. The activities are organized in each phase, so they are depending on each other in a logical sequence. According to Johannesson et.al (2004) between any processes phases there are fixed decision points, "tollgates". The four phases include both synthesis and analysis that facilitate the work to achieve the required result. It is also important to document the work approach and to codify the thesis progress, in order to provide traceability (Johansson et.al 2004).
The table below shows the author’s own structured model with a simplified and general description of the thesis work process.
Plan
Time planning
Establish target specifications
Background research
Thesis requirements and specifications
Set up theoretical framework
Study
Data Collection
Problem definition
Question formulation
Literature study
Interview and Benchmarking
Data interpretation
Analyse
Appointments arrangement Continuous interviewing Problem narrowing Data compression Competitive products Detection and conclusion
Improve
Evaluation Modification Further development
Reporting
Table 1: Phases in the thesis work process and the activities in each phase. Figure 9: Flowchart for the thesis work process.
10
2.2 Applied research methods
The information research process passed through several stages and frequent activities, as the figure above shows. All activities focused on research axis, which is gathering data in order to create the research questions. The following Sections of this Chapter describe the main activities that are used for data collection.
2.2.1 Data gathering
Data gathering is a process of preparing and collecting information. The purpose of gathering data is to acquire information that requires to push the work forward and to get a clear view about the subject in order to put the first steps in the investigation process. Sometimes the choice of data may be a problem that needs to be organized and performed accurately (Ghauri & Gronhaug, 2005). Anyway, usually data primarily is collected to provide information about a specific subject or a research topic, which often takes place early in any project. Data gathering should be performed by following a cognitive plan that contains the following activities (Golding & Knudson 2010):
1. Pre collection
The first activity is pre collection activity that includes certain actions, such as searching data for target deciding and for word choice in order to formulate research questions then selecting research methods.
2. Collection
A specified data collection should be done by using different data searching methods, such as interviews, benchmarking, electronic databases etc.
3. Present findings
The last activity usually involves some form of data categorization, analysis then presentation.
Figure 10: Research methods used to accomplish thesis objectives.
Assessing information
11
To obtain the main goal of data gathering in this thesis, a quantitative and a qualitative data research is conducted, where the quantitative helped to collect a huge amount of data within the scope of the project, while the qualitative facilitated the acceptation or rejection of the thesis hypothesis. Then a combination between both quantitative and qualitative is used as a base for further work
improvement (Gharry & Gronhaug 2005).
The data gathering process is based on two sorts of knowledge, academic knowledge and empirical knowledge (Gharry & Gronhaug 2005). The academic knowledge can be obtained from different sources, for instance monographs, edited collections, doctoral dissertations, scholarly journals, including peer reviews, while the empirical knowledge can be obtained by searching in the company’s web page, trade magazines and professional journals.
In this thesis, the academic knowledge was obtained by using free internet resources, such as DIVA, that includes research papers and other student theses. LIBRIS, ebrary, Google Scholar and Google books are other databases that have provided online books and articles. In addition, library text books, encyclopaedias, dictionaries and previous course literatures were supportive data sources for obtaining the desired knowledge. The resources were used to obtain the empirical knowledge are GKN’s web pages, interviews, benchmarking visit, technical reports and empirical publications on the web.
2.2.2 Literature review
In order to accomplish better understanding and to create a rich scientific report, many publications are reviewed from the previously mentioned sources. A literature review and an examination of the research are carried out in particular fields of the study to achieve the research proposal.
The literature review is defined by Hart (1998, p. 13) as the selection of available published and unpublished documents on the topic, which includes ideas, data, facts and evidence written from different particular points of view to fulfil specific aims, and to express certain sights or observations on the nature of the topic.
The literature review should follow a sequential guiding process to achieve an end result, which consists of various steps to accomplish the aim of the review. The procedures of a literary review should be conducted in a specific order and should follow the process guidelines, which are reading, understanding, analysing, interpreting, evaluating then summarizing and writing (Hart 1998). The aim of conducting a review is to summarize relevant information about the topic of the research and then to present it in an efficient way for the reader. The thesis report is based on a variety of knowledge sources that have been applied to understand the subject and to formulate the right entry to a realistic proposal. All of the relevant sources have been significantly studied and analysed, to ensure that the final proposal has been achieved a unique and an efficient result.
According to Hart (1998), a typical literature search should be carried out in four stages:
Background information and the topic area should primarily be mapped and then the search vocabulary should be used to collect the related work that associate the main topic.
Focus topics and literatures should be chosen carefully, classified into categories and then analysed. In addition, the information sources should be identified and chosen accurately.
Another detailed research should be performed to construct an initial literature.
A secondary evaluation of review journals, citation indexes and others trusted sources should be carried out to achieve the search endeavour.
12
2.2.3 Interviews
Interviews are used in the thesis as one of the qualitative data collection techniques to carry out a systematic social inquiry with a specific form of conversation that may differ depending on the time, location, subject (Fontana & Frey, 1994). An interview is a rapid data collection that may associate with a rapid analysis and follow up actions (Marshall & Rossman 1999).
In order to obtain well understanding and to create a follow up plan, many interviews are performed with many different departments in the company. In addition, several interviews are carried out by different departments at the supplier’s organizations in Sweden, while some of the interviews are carried out with another supplier that is located out of Sweden by using electronic mail. The interviews that are performed in this thesis are divided into two types, structured individual interviews and unstructured individual interviews.
A structured interview is to ask pre-defined questions with a limited set of reply categories, where questions are prepared in advance (Fontana & Frey 1994). The interview method of research, typically, involves a face-to-face meeting in which the interviewee asks a series of questions depending on each other to facilitate facts and information gathering from simple questions to move slowly to more complicated questions, and as a result, the interviewee gives the information step by step without requesting this directly and even avoid interrupting the interviewer because the
sequence of the answers will depend on a well prepared questions. Some unstructured interviews are carried out as well, where the interview is not planned to be conducted, thus it is carried out spontaneously due to sudden action or new event.
As previously mentioned, the qualitative data research differs from the quantitative data research and most of the interviews in this research are based on qualitative data gathering because the quantitative data gathering in this case will make the interviewee go out of the subject, which will in its turn waste the interview limited time. However, the qualitative data research is based on the way that the interview is structured, so the comeback from the interviewee explains and identifies events, patterns and forms of behaviour (Bryman & Bell 2007). It is important to mention that the
qualitative and quantitative interviews are essential sources for gathering the empirical data, which is a complement to the academic data, so the interviews during this thesis have been a source of
information that added a great educational value through the whole work.
2.2.4 Benchmarking
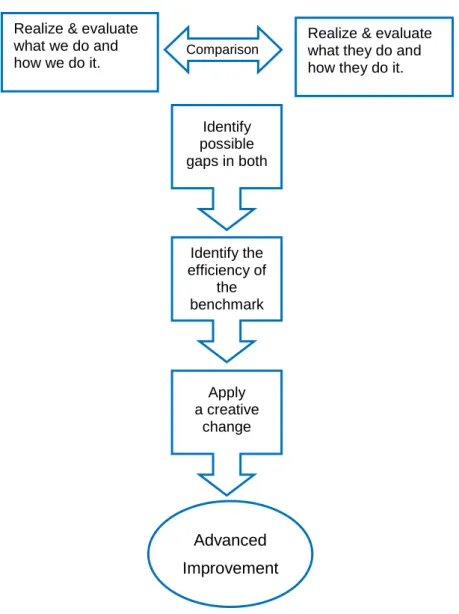
Benchmarking is a comparative process between two different performances in two different organizations that enables an organization to compare its performance with competitors’ processes in the same industrial branch. The purpose of benchmarking is to determine what kind of
improvement should be performed and where. It is also a tool to analyse how other similar
organizations have accomplished their high performance level. Moreover, the competitor’s different processes should be analysed and then evaluated in order to adapt a creative action to improve the organization performance (Jackson & Lund 2000).
Jackson & Lund (2000) claim that benchmarking is a continuous process to evaluate the company’s method against another company and by using this tool, a product, service, approach, process or function can be compared between similar companies in the same field.
Unfortunately, it is difficult to find companies interested in a benchmarking cooperation, but at least benchmarking is carried out with Volvo Powertrain in Köping. Nevertheless, the choice of Volvo Powertrain is perfect because Volvo Powertrain is a company within the Volvo Group that develops and supplies driveline components to all companies within AB. This means that the two companies are working in the same industrial branch.
13
Figure 11: Benchmarking process done by Elassar (2013) and based on Jackson & Lund (2000).
Moreover, Volvo Powertrain plant is close to GKN plant and the two plants have the same geographical character and even the similar building construction, which enabled a successful benchmarking. The benchmarking technique has provided the benchmark target that created a basis for the continuation of the work. The benchmark has been analysed later and studied furthermore in order to evaluate the efficiency of this benchmark and to identify the gaps in it.
The flowchart below shows benchmarking consequences that depend on understanding both GKN and Volvo’s processes in order to perform a successful comparison and to apply a creative adaptation.
Advanced Improvement Realize & evaluate
what we do and how we do it.
Realize & evaluate what they do and how they do it.
Apply a creative change Comparison Identify possible gaps in both Identify the efficiency of the benchmark
14
3. Theoretical framework
This Chapter reviews the literature related to the thesis work and the theoretical
background that has been applied to get the desired output. The philosophies, theories
and tools are presented respectively in which order they have been applied.
3.1 Lean
Lean is a philosophy about how to manage resources to achieve business growth and success. The aim of Lean philosophy is to identify and eliminate all factors in a production system that do not create value for the last customer.
“All we are doing is looking at the time line, from the moment the customer gives us an order to the point when we collect the cash. And we are reducing the time line by reducing the non-value adding wastes.” – Taiichi Ohno.
Lean manufacturing is all about eliminating waste and all that does not add value is waste. Lean strives for more value with less work. Moreover, Lean is a culture of continuous improvement that seriously considers customer input to do further development, which always is based on waste elimination. Lean techniques are the systematic identification and elimination of wastes, the implementation of continuous improvements. Lean thinking is a controlling solution to Muda, because of the way of Lean thinking provides a technique to do more and more with less and less (Womack & Jones 2003). Less human effect, less equipment, less time, and less space, contributes directly to obtain customers' expectations. In addition, Lean strives for improving employees work environment in the organization and reacts on effects in order convert Muda to value instead of doing activities that consume resources and add no value (Womack & Jones 2003).
It is noteworthy to mention that Lean principles focus on continuous improvement of resource productivity and production efficiency by continuous reduction of resource waste, such as materials, energy, water, space, and even the utilized equipment in the organization, while EPA (2013) argues that “Lean method fails to consider two types of environmental waste: the environmental risk of production processes and products and the life-cycle impacts of products or services.”
3.2 Just-in-Time
According to Liker JIT is a set of principles and tools that facilitate the production and the delivery of products in smaller quantities and a shorter lead time, to accomplish customer satisfaction. Simply, JIT is about to deliver the right product at the right time in the right quantity. JIT can be basically described as a low budget for a high profit policy (Grady 1990).
JIT is a productive strategy for a smooth, continuous and optimized production flow that controls the movement of materials to specific locations at the required time and exactly just when it is needed and in the amount that is needed for the manufacturing process (Drew et al., 2004). JIT philosophy presents ideas on how to control inventory and how to transfer materials to the production area just at the right time before exactly the intended time to use those materials, which reduces the need of storage and excessive levels of material in the inventory. For more simplicity, the philosophy of JIT is based on the idea that inventory is waste. JIT as one of the essential principles in Lean
Manufacturing, consider everything does not add value to the process is waste according to Goddard (1986). JIT is an approach that helps to reach excellence in industrial manufacturing, which is based on continuous elimination of waste and regular improvement in productivity. The relationship between the three well known philosophies in production JIT, TPS and Lean is dating back to JIT development into Toyota Motor Company, which is, over the time, developed into the Toyota Production System (TPS), and then the TPS developed further more into LEAN. Therefore, they do
15
not differ from each other significantly. Indeed, JIT works directly with processing problems, while Lean is to eliminate the problems. In short, Lean can be used to achieve JIT, and both philosophies are used to eliminate waste.
3.2.1 Types of waste
The three M’s, Mura Muri and Muda are Japanese term for, unevenness overburden and waste (Stewart 2011). Mostly, all organizations use Muda to eliminate wastes, while ignoring the other two M’s. The ignorance of Muri and Mura may lead to the Muda and generate more problems that accumulate in the long term. In brief, the three types of waste are described as follows:
Mura
Very uneven production is a result of the variation in customers’ demand, process time per product, or difference of cycle times for different operators and when it is difficult to have a smooth variation production, increases the possibility for Muri. In order to reduce Mura, it needs to create standards in the work process (Stewart 2011).
Muri
Any activity causing any unreasonable stress or effort for employees, material or equipment may generate a negative impact. If employees are overloaded, this affects their values and their work performance; then this may lead to negative consequences. Overloading of employees occurs when they get too many tasks that must be performed in a short time, which increases stress and affects their decisions. Even a machine could be affected because of overloading that leads to breakdown. To avoid Muri the work process should be standardized and the non-adding-value activities should be eliminated (Stewart 2011).
Muda
According to Liker (2009), what does not add value is waste. Waste is defined in eight categories i.e. (7+1) types. The seven wastes were defined by TPS and later an eighth waste was defined by
Womack et al. (2003). Those eight wastes have tools to eliminate the effect of each one and to improve the overall performance. Those types of waste do not exist only in manufacturing processes, but they can appear in all processes within a company for instance in management or in product development. The eight wastes are defined as follows (Wisc-online 2004):
1. Overproduction
Too much or too early production that exceeds customers demand. This is the worst waste because it causes the other wastes. Overproduction may be caused by many reasons such as, producing large patches, unreliable processes, uneven schedules or incorrect information about demand. Overproduction can be avoided by balancing between supply and demand. Simply, overproduction can be described as making more, earlier or faster than is required by the next process which is caused of unclear goals.
2. Inventory
Inventories are just waiting for further processing or consumption. Unnecessary inventory and the accumulation of goods before or after a process is an indication of lack of balance in work flow, which forces inventory to build up between processes. The inventory
accumulation could be caused of large batch size, incapable processes, and long change over time or extra safety stocks. To get rid of this waste, it is necessary to produce and supply according to JIT philosophy.
16
3. Waiting
Idle time occurs when some interdependent activities or processes are not completely synchronized. Operators may be kept waiting or working slowly while the machines are working. This waste is a result of a poor coordination between manpower and machines, long changeovers or rework. Waiting increases lead time, which is a waste that does not add any value to the process. The time of waiting should be utilized efficiently during
production, so all queues can be avoided or minimized in order to protect customers and dealers from long waiting periods.
4. Motion
Any motion of man, equipment or goods in the warehouse which do not add value to the final product is a waste of motion. Inefficient motion is caused by poor plant layout that increases walking distance, goods long transferring distance inside and outside the plant or reorientation of goods. Unnecessary process, inconsistency in work methods or poor workplace organization can also create unnecessary motion inside the plant.
5. Transportation
Material and goods transferring from place to another adds no value, neither to the product, nor to the process. Processes should be near to each other and materials flow smoothly between processes without any significant delays in between. The transportation waste can be caused because of the following reasons:
Poor plant layout
Large distances between different operations
Far out warehouse
Large patch sizes
Overproduction
Multiple storage locations
6. Defects
The wastes of correction and rework that may occur due to the unclear operating procedure require adjustments and repairs. Defects require repairs in different terms such as,
renovation, demolition or replacement and those extra activities add no value to the product. Defects may be caused due to the skills shortage, incapable process/supplier, transportation or excessive stock. To avoid this type of waste, it needs to avoid scrap and rework.
7. Over-processing
This waste occurs when an unnecessary activity is added to the production process. For instance, when a process is wrong designed or when an extra process is done such as painting hidden parts and cleaning more than it needed. Work standardization and having clear quality standards are the best techniques to eliminate the over- processing waste.
7+1. Creativity
Unused employees' creativity and failure to involve the workforce in the development of their working environment is a waste. Many practical solutions can be gained by involving the workforce that contributes to build good sub-optimal performance. As well as, the continuous development of skill levels supports effective problem solving. Untapped creativity is caused by inappropriate policies, incomplete measures or busy operators
schedule. Many problems may be easily solved by involving workforce from the heart of the process, instead of seeking an experienced person from outside the company.
17
3.3 Value Stream Mapping
VSM is one of Lean tools to design and analyse the flow of materials and information in a production process. VSM was created by Toyota's chief car manufacturing engineer Taiichi Ohno and it is used nowadays in many industries to identify the non-value-added activities in a process. Value Stream Mapping is actually an illustration of a whole process in a special type of flowchart that uses symbols known as the language of Lean. See figure 12. Those symbols illustrate the process flow of a specific product (Braglia et al. 2006; Keyte 2008; Krajewski et al. 2010). The purpose of VSM is to provide an optimal value for a process and to form a completed valued process with the lowest possible waste level. The visual map of VSM describes how the work process functions and views the relation between material flow and information flow. VSM map is also used as a communication tool that gives an overview of the process and facilitates the creation of an action plan for eliminating waste, which in turn, will increase the organization profit and maintain value to the customer (Krajewski et al. 2010).
This unique one page map explains the current state for a product path, starting from the supplier and ending at the customer. VSM provides the following information (Krajewski et al. 2010):
Material and information flow
Work-in-process inventory
Cycle diagram including zones, time and temperature
Identify customer, demand and customer production schedule
Identify suppliers of raw materials
Raw materials ordering frequency, delivery periods and transport methods
Inventory condition: storage, size, location and consumption
Number of teams, shifts and operators
Shows cycle time and availability
Production planning system, including meetings and documents
It is important to build a map of a process to establish a view of the current information and material flow, especially when work processes vary continually and the information flow changes once
18
orders change. The overall view shows the process from supplier to the warehouse and from warehouse to the work units as well. When the material, information and component requirements have been understood, successful future opportunities will be accomplished (Krajewski et al. 2010).
3.4 Risk management
Risk management is a process of identification, analysis and prioritization of potential risks then acceptance or mitigation of those risks in the organization. Essentially, risks occur anytime for different reasons, according to Covello et.al (1993, p. 2) “Risk is a characteristic of a situation or action wherein two or more outcomes are possible, the particular outcome that will occur is unknown, and at least one of the possibilities is undesired.”
Rapid changes in the work environment can cause different risks, Cucchiella & Gastali (2006) classify risks into internal- and external risks. Internal risks relate to internal vulnerability of the organization, and joined directly to internal factors in the organization. Internal risks may occur due to some activities, use of some equipments and other sudden hazards, while external risks are those risks that cannot be controlled by the company, e.g. supplier, competitor, environment, price fluctuations, quality and politics (Cucchiella & Gastali 2006, p.703).
3.4.1 Risk assessment
Risk assessment is “a systematic process for describing and quantifying the risks associated with hazardous substances, processes, action or events” (Covello et.al 1993, p.3). Risk assessment evaluates the possibility of hazard's occurrence and its possible adverse consequences on health or on the environment. Even the possibility and the uncertainty over the occurrence, magnitude or timing of those consequences are considerable in risk assessment (Covello et.al 1993). According to Cucchiella & Gastali (2006), internal- and external risks depends on various internal and external factors in the organization or in the outside supply chain. Internal and external hazards that could affect the safety of a facility should be identified and treated as events that can give rise to possible mitigating of risks according to legislation 1999:381. See Section 3.4.2 on a legal demand for controlling of hazards in organizations. The risk assessment should also be performed to avoid eventual damages in the facility and to avoid extra costs as well. There is a need for a systematic understanding of the risks in a facility, which follows with an assessment of how to control those risks. Risk assessment requires a process of identifying, assessing and mitigating those risks. More specifically, threats and hazards have to be defined by giving a detailed look at hazard evaluation in order to control risk vulnerabilities and then to implement risk reduction measures (Braithwaite 2003). Jüttner et al. (2003) define four critical aspects in risk assessment, which are assessing the risk sources, identifying the risk drivers, tracking the risk drivers in the strategy, and then mitigating risks. Risk analysis requires time, money and effort. It requires hard effort in the initial
brainstorming and then constant updating, but a well done risk analysis can save time and money since the effect of internal hazards has been minimized or avoided. In order to analyse a risk, it is important to consider the combination of the hazard source and the incident that contribute in raising the consequence and even to consider the combination of probability and consequence (Braithwaite 2003; Jüttner et al 2003).
Risk analysis might be qualitative or quantitative. A qualitative risk analysis estimates the risks in an organization in order to assess different risks. This estimation has to be based on intuition,
knowledge and experience. In addition, a qualitative analysis categorizes risks according to the seriousness of the hazard's occurrence and the grade of its sensitivity, while a quantitative risk analysis is a process that assigns numbers to costs of protection and damage. This means that a quantitative risk analysis is an exploration of losses cost and a probability of an event occurring that could be sometimes unreliable. It is important to do a quantitative risk analysis in order to use the output of the risk analysis to enable rational judgments of severity. The evaluation of most risks needs a systematic identification of major hazards that may arise as a following to in normal or
19 Identify
hazards
Identify the exposures. Who and what could be harmed and how?
Evaluate the risks arising. Decide whether existing precautions are adequate or if more should be done
Record the findings
Review the assessment regularly and revise if necessary
abnormal events. In normal events that affect human health, can be wrong ergonomics aspects, hazardous material, smoke or exposure to liquids, while the in normal events that affect environment can be CO2 emissions, waste, pollution, etc. (Jüttner et al 2003). Abnormal events are accidents or incidents that may affect human health, such as traffic, cutting, squeezing, falling etc. and the abnormal events that affect the environment are spilling hazardous, uncontrolled fires and emissions. Those normally and abnormally hazardous have a negative impact on human health and safety in a form of infection, allergy , cancer, poisoning, physical injuries, diseases, death, local environmental damage, large costs of remediation, etc. Protective actions and measurements must be taken to avoid and mitigate those hazards, or even to eliminate its impact on human and environment in a form of personal protection equipment, substitution of hazardous material, correct work instructions and risk analysis (Smurfit Kappa Group 2013). A well done risk analysis should be conducted with an excellent knowledge about the facility in order to accomplish a successful action plan, safety reports, prevention plans and protective thinking.
3.4.1.2 Fire safety
There are many rules and principles to protect facilities and their work environments from fires and its effects in work places. Those rules focus on fire detection, suppression and mitigation which focus on human behaviour and maintaining a safe environment. Industrial facilities contain various sources of ignition such as, hot surfaces of pipelines or vessels, electrical equipment, welding activities and static electricity. Those sources may be a reason for ignition or explosion. Almost the majority of facilities are full of physical properties that contribute to generate a fire or increase an existing fire. Some fires increase depends on different cofactors that cause different type of ignition such as pool fires, jet fires, flash fires, etc. (HSE 2013).
Pool fires will be described furthermore because it is the most serious hazard regarding using IBCs in production. As described in Section 1.3, IBCs can release their contents rapidly and cause an oil pool which turns fast to flames if a fire occurs. Pool fires arise if a liquid accumulates as a pool on the plant floor where the liquid might be flammable or explosive which will result in a fire spread that covers the whole oil pool. Additionally, the flowing- and flammable property of oil, contributes to a rapid fire spread and flow at the same time as the liquid flows in the factory floor. According to information that were gathered from some interviews in GKN, sprinkle system is a not helpful solution in this case because oil and water will not mix together instead oil will flow over the water which will contribute negatively to more spread of the oil and fire increase, as well.
3.4.1.2 Methods for risk analysis
Risk assessment is a systematic evaluation and analysing of work activities. The choice of the risk analysis method might differ depending on the purpose of analysis and even the analysis tools should be chosen regarding the task whether it is quality, environment or work environment (Covello et.al 1993). The flowchart in figure 13 shows a typical risk analysis consist of five steps to assess risks. Risk analysis methods can be divided into two different categories, qualitative and quantitative analysis. The qualitative risk analysis is a scenario-based analysis that categorizes and determines risk areas that have the most uncertainty and vulnerability, while the quantitative risk analysis attempts to assign independently objective measured values to the components of the risk assessment and to the assessment of the possible failure (Tan 2002). There are large numbers of different methods for risk analysis and many of these are industry specific. Sections 3.4.3 and 3.4.4 present the most common risk analysis tools.
Figure 13: Risk analysis flowchart (Scottis 2012).
20
3.4.2 Legal demands
Several authorities in Sweden require risk assessment in different context and put a number of laws and regulations that should be applied only within industries that deal with dangerous chemicals.
Law 1999:381 on prevention and control of major chemical accidents
Law 1999:382 on prevention and mitigation of serious chemical accidents
Law 2010:1011 on dealing with flammable and explosive products
MSB regulations (SRVFS 1999:5) on measures to prevent of major chemical accidents
AFS regulations (AFS 1999:5) on the prevention of serious chemical accidents The purpose of the risk assessment:
Permitting of industrial activities
Assessment of safety needs and planning of initiatives
Investigation of incidents, accidents and hazards
In 1999 a number of legislations and regulations of laws was incorporated, that require measures to prevent and limit the consequences of major chemical accidents (SFS 1999:381) and requires measures for prevention and mitigation of major chemical accidents (SFS 1999:382). The law (1999:381) and (1999:382) cover chemical accidents that involve one or more dangerous substances, as emission, fire or explosion, caused by an uncontrolled development of an activity and leads to serious, immediate or delayed hazard to human health, inside or outside the plant, or to the
environment (SFS 1999:381, 2§) . According to the Swedish parliament, the aim of (1999:381) law is to prevent major chemical accidents; prevent and limit injury to people and damage to the
environment, while the law (1999:382) requires provisions for enforcement of the law (1999:381) on measures for the prevention and mitigation of major chemical accidents.
A qualitative and quantitative analysis about the hazards in the plant and a description of the work environment should be presented (SFS 1999:381, 7§). Furthermore, the government has
incorporated regulations that for dangerous activities to provide a safety report (SFS1999:381, 10§). The safety report must be renewed every five years or earlier if there are special reasons (SFS 1999:381, 11 §) and it should contain:
1. Information on the management system and the organization is designed to prevent major chemical accidents
2. Description of the business environment
3. Description of the plant and the hazardous substances present or may occur there 4. Identification and analysis of risks of accidents
5. Information on preventive measures to prevent and measures to limit the consequences of a major chemical accident
The law on protection against accidents requires that the property owner and the operator work systematically with its fire protection. The systematic fire protection can be seen as an important part of achieving safe and protected work environment. The operator should prevent the risks of serious chemical accidents and in the case of a serious accident has occurred; the operator’s responsibility is to limit the impact on human health and the environment (SFS 1999:381, 6§). The law requires also drawing up an action plan for prevention of serious chemical accidents (SFS 1999:381, 8 §). In addition, the law requires taking into account other environmental factors that may affect safety and the proximity to other dangerous activities or circumstances must be addressed (SFS 1999:381, 13 §).
The law (2010:1011) on handling with flammable and explosive products requires measurements for fire and explosion risk and consequences of a fire or an explosion. This law aims to prevent and limit accidents and damage to life, health, environment or even properties which may arise from fire or explosion caused by flammable goods. According to the law (2010:1011, 7 §), it is required to do investigations to ensure and provide information about the risks of accidents and incidents which may be caused by fire or explosion and the consequences of such accidents.
21 Other Equipment Man Procedure s Material s Delayed in the process Weather Pollution Waste Machine failure Maintenance Leakage Wrong mission Late cleaning Supplier error Delayed delivery Wrong instructions Over process Contamination Late delivery Shortage
3.4.3 Ishikawa diagram
Ishikawa diagram also called Fishbone diagram or cause-and-effect diagram and is created by Kaoru Ishikawa. It is a causal diagram that shows the causes of a specific event in order to indicate quality defect prevention and to identify potential factors causing an overall effect (Bauer 2008). Ishikawa diagram shows the causes of a specific event. The name Fishbone diagram comes from the
appearance of the graph, hence the main problem is symbolized by a fish head, the bone structure represents potential problems and the ribs represent the problem causes as the figure below shows.
Ishikawa diagram is used to identify possible causes of a problem, especially when a team tends to investigate the roots of a specific problem (Krajewski et al. 2010, p.165). The Fishbone diagram identifies various possible causes for an effect or problem. This type of diagram is very useful because the ideas sort into different categories which can be used later to structure brainstorming gathering or to use it as input to perform FMEA.
Simply, the basic idea of Ishikawa diagram is that thinking about possible causes and reasons leads to find the reason of the problem and then find preventive solutions for those problems.
Causes in the diagram are considered as sources for different problems. The causes are usually categorized into six major categories. The categories usually include (ASQ 2013).
1. Manpower or any people involved in the process
2. Equipment, machines and any physical tools in a facility 3. Procedures, policies, regulations and laws
4. Materials, such as raw material and components used in production 5. Methods and measurement for quality evaluation
6. Other aspects, such as environment, time, temperature and location
Figure 14: Ishikawa diagram based on Krajewski et al.( 2010), (Elassar 2013).
Methods
New process Missed step Poor handling