ENVIRONMENTAL AND HEALTH IMPACT FROM MODERN CARS
A comparsion between two petrol and two diesel cars with varying emission
control technology
Titel: Environmental and Health Impact from Modern Cars
Keywords: petrol, diesel, cars, emissions, particles, VOC, air pollution, fossil fuels, NOx, particle filter
Author: Peter Ahlvik Ecotraffic R&D
3AB
Contact persons: Pär Gustafsson and Olle Hådell, Swedish National Road Administration, Vehicle Standards Division
Publikation number: 2002: 62 ISSN: 1401-9612
Printed: May 2002
Edition: 150 copies. Also available for downloading at http://www.vv.se/publ_blank/bokhylla/miljo/lista.htm
Distributor: SNRA, Head Office, SE-781 87 Borlänge, phone +46 243-755 00,
fax +46 243 755 50, e-mail: vagverket.butiken@vv.se
Ecotraffic ERD
3AB
Peter Ahlvik May 2002
ENVIRONMENTAL AND HEALTH IMPACT FROM MODERN CARS A comparison between two petrol and
two diesel cars with varying emission control technology
A report for the
Swedish National Road Administration
PREFACE
The transport sector contributes significantly to the air pollution and particularly influences the local air quality. Beside the question of air quality, the consumption of fossil fuels in the transport sector and the CO
2-emissions from this use is an issue of increasing impor- tance.
For a long period of time, the emissions from light-duty vehicles have been in focus and a lot of measures have been taken to reduce the emissions from these vehicles.
The market penetration for light duty diesel cars has been increasing in the most markets in Europe and is now over 30 % (2001). In Sweden, however, the market share for diesel cars has decreased the last three years and is now slightly above 5 %.
The issue of whether petrol or diesel fuel should be used as fuel in passenger cars has been lively debated during the last years, particularly in Sweden. Especially the particle emis- sions from diesel cars have been in focus. This study is an attempt to contribute with some more facts to the subject.
The study presented in this report is built on new investigations of two petrol and two die- sel cars with varying emission control strategies. Tests have been carried out both in the European driving cycle and in other driving cycles. Beside the regulated substances, analy- sis has been made on unregulated substances as well. The data has also been compared with data from earlier studies.
The report has been written by Peter Ahlvik, Ecotraffic ERD
3AB. The author is liable to the results and the assessments in the report.
Borlänge, May 2002
Swedish National Road Administration, Vehicle Standards Division
TABLE OF CONTENTS Page
SAMMANFATTNING (SWEDISH SUMMARY) EXECUTIVE SUMMARY
1 INTRODUCTION ... 1
2 BACKGROUND... 3
3 METHODOLOGY... 5
3.1 Literature survey ... 5
3.2 Selection of vehicle technology ... 5
3.2.1 Conventional three-way catalyst (TWC) ... 5
3.2.2 Direct injection of petrol (SIDI)... 6
3.2.3 Direct injection of diesel (CIDI)... 7
3.2.4 Direct injection of diesel (CIDI) with a particulate trap ... 8
3.3 Experimental ... 9
3.3.1 Test facilities... 9
3.3.2 Vehicles ... 10
3.3.3 Fuels ... 14
3.3.4 Test matrix... 14
3.3.5 Emission measurement... 15
3.3.6 Driving cycles ... 18
3.4 Calculation of effects ... 20
3.4.1 Lifecycle perspective... 21
3.4.2 Respiratory diseases − acute ... 21
3.4.3 Respiratory diseases − cancer risk ... 23
3.4.4 Regional effects ... 24
3.4.5 Global effects ... 24
4 RESULTS... 26
4.1 Regulated emissions... 26
4.1.1 Emission comparison... 26
4.1.2 Structure of figures... 29
4.1.3 CO emissions ... 29
4.1.4 HC emissions ... 31
4.1.5 NOX emissions ... 33
4.1.6 Particulate emissions ... 35
4.1.7 CO2 emissions and fuel consumption ... 40
4.1.8 Complementary results from overtaking... 42
4.2 Unregulated emissions... 43
4.2.1 Nitrogen containing compounds... 43
4.2.2 Light aromatics ... 44
4.2.3 Aldehydes... 46
4.2.4 Alkenes... 47
4.2.5 Polycyclic aromatic compounds (PAC)... 49
4.2.6 Acrylamide ... 52
4.2.7 Particle number and particle size distribution... 53
4.3 Impact on environment and health... 69
4.3.1 Local effects, acute respiratory diseases ... 70
4.3.3 Regional effects ... 75
4.3.4 Global effects ... 77
5 DISCUSSION AND CONCLUSIONS... 80
6 ACKNOWLEDGEMENTS... 83
7 REFERENCES ... 84
LIST OF TABLES Page Table 1: Vehicle specifications---13
Table 2: Measurement methods for emissions ---16
Table 3. PAC analysed---17
Table 4. Reactivity adjustment factor (RAF) ---22
Table 5. Unit risk factors for cancer (*10
-6) ---23
Table 6. Global warming potential (relative to CO
2) ---25
Table 7. Comparison of emissions with certification data (VCA) ---26
Table 8. Corrections for some of the alkenes ---48
Table 9. Emissions of acrylamide ---53
LIST OF FIGURES Page Figure 1. Testing of the Peugeot HDi in the emission test cell at MTC (courtesy of MTC)---10
Figure 2. Schematic illustration of overtaking ---20
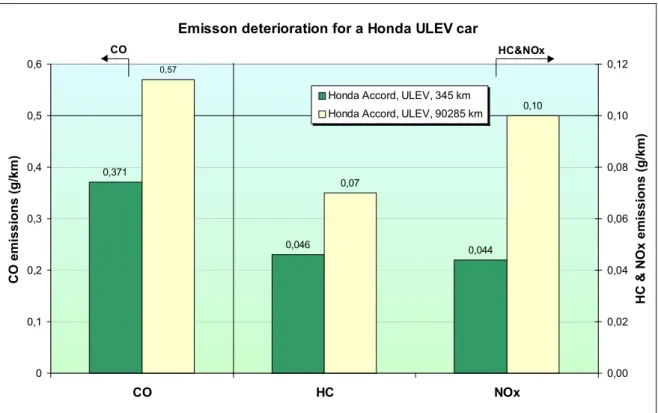
Figure 3. Comparison of emissions with a Honda ULEV ---27
Figure 4. Emission deterioration for the Honda ULEV---28
Figure 5. CO emissions in NEDC at +22°C and –7°C ---29
Figure 6. CO emissions in US06 and during overtaking ---30
Figure 7. HC emissions in NEDC at +22°C and –7°C ---31
Figure 8. HC emissions in US06 and during overtaking ---32
Figure 9. NO
Xemissions in NEDC at +22°C and –7°C ---33
Figure 10. Comparison of emissions at +22°C and at –7°C (source: Audi, MTZ [37]) ---34
Figure 11. NO
Xemissions in US06 and during overtaking ---35
Figure 12. Particulate emissions in NEDC at +22°C and –7°C ---36
Figure 13. Particulate emissions in US06 ---37
Figure 14. Particulate emissions from petrol cars with TWC ---39
Figure 15. Particulate emissions from a direct injection petrol car in two studies---39
Figure 16. CO
2emissions ---40
Figure 17. Fuel consumption ---41
Figure 18. Vehicle speed traces during overtaking ---42
Figure 19. Vehicle distance driven during overtaking ---43
Figure 20. N
2O emissions ---44
Figure 21. Emissions of ammonia (NH
3)---45
Figure 22. Benzene emissions ---45
Figure 23. Aldehyde emissions ---46
Figure 24. 1,3-butadiene emissions (corrected and uncorrected) at +22°C ---47
Figure 25. Emissions of alkenes at +22°C---48
Figure 26. Emissions of alkenes at -7°C ---49
Figure 27. Emissions of polycyclic aromatic compounds (PAC) at +22°C and –7°C ----50
Figure 28. Emissions of polycyclic aromatic compounds (PAC) at +7°C ---51
Figure 29. PAC emissions at various temperatures for two petrol cars and one diesel car ---52
Figure 30. Total particle number emissions in the NEDC cycle ---54
Figure 31. Total particle number emissions in the US06 and overtaking tests ---55
Figure 32. Real time particle number (#/s) traces in NEDC at +22°C, Peugeot ---56
Figure 33. Real time particle number (#/s) traces in NEDC at +22°C, VW Golf---57
Figure 34. Real time particle number (#/s) traces in US06, all cars ---58
Figure 35. Real time particle number (#/s) traces during overtaking ---58
Figure 36. Particle size distribution in NEDC, Peugeot cars at +22°C ---60
Figure 37. Particle size distribution in NEDC, Peugeot cars at -7°C---61
Figure 38. Particle size distribution in NEDC, VW cars at +22°C---62
Figure 39. Particle size distribution in NEDC, VW cars at -7°C ---62
Figure 40. Particle size distribution in US06 for the Peugeot cars---63
Figure 41. Particle size distribution in US06 for the VW Golf cars ---64
Figure 42. Particle size distribution during overtaking for the Peugeot cars ---65
Figure 43. Particle size distribution during overtaking for the VW Golf cars (VW Golf diesel tested in 6
thgear) ---65
Figure 44. Total particle number emissions for IDI and DI engines (VW Golf) ---66
Figure 45. Total number of particles (#/s), VW Golf TD (IDI) vs. VW Golf TDI (DI) ----67
Figure 46. Real time SMPS results in NEDC on 5 nm particles (#/s) ---68
Figure 47. Real time SMPS results for the first 5 minutes of NEDC on 5 nm particles (#/s) ---68
Figure 48. SMPS results on 5 nm particles in NEDC (#/km)---69
Figure 49. Ozone forming potential ---70
Figure 50. Local NO
Xemissions ---71
Figure 51. Local particulate emissions---72
Figure 52. Cancer risk index ---73
Figure 53. Cancer risk index ---74
Figure 54. Acidification potential ---76
Figure 55. Eutrophication potential ---77
Figure 56. Emissions of greenhouse gases---78
Figure 57. Energy use ---79
SAMMANFATTNING (SWEDISH SUMMARY) Inledning och bakgrund
Transportsektorn bidrar påtagligt till luftföroreningarna och speciellt gäller detta för den lokala luftkvaliteten, eftersom fordon ofta används i tätt befolkade områden. I ett speciellt avseende har de lätta fordonen varit föremål för ett stort intresse under den senaste tiden och detta gäller partikelemissionerna från dieselbilar. Eftersom marknadsandelen för die- selbilar har ökat på de flesta marknaderna i Europa (till över 30% 2001) har denna fråga aktualiserats allt mer. Sverige har varit ett undantag i detta avseende. Här har marknadspe- netrationen minskat långsamt under de 3 senaste åren och nu verkar den ha stabiliserats på något över 5%. För att fordonstillverkarna skall kunna klara sitt frivilliga åtagande att minska CO2 emissionerna i framtiden är en ökad marknadsandel för dieselbilar en möjlig väg.
Eftersom det finns relativt få data på icke reglerade emissioner från moderna dieselbilar, var det av speciellt intresse att generera sådana data. Det ansågs också av vikt att jämföra dessa data med de från moderna bensindrivna bilar. Efter diskussioner med Vägverket er- hölls stöd för att genomföra projektet. MTC anlitades för att utföra den experimentella de- len i projektet.
Metodik
Nedanstående 4 bilar valdes för undersökningen efter diskussioner med Vägverket, återför- säljare och biltillverkare:
• En dieseldriven Peugeot 307 2.0 HDi FAP, utrustad med partikelfilter
• En dieseldriven VW Golf 1,9 TDI (utan partikelfilter)
• En bensindriven Peugeot 307 med 1,6-liters motor
• En bensindriven VW Golf med 1,6-liters motor
Bilarna utlånades vänligen av de svenska återförsäljarna eller av tillverkaren i ett fall (Peu- geot 307 HDi FAP).
Bilarna testades enligt den europeiska NEDC körcykeln vid temperaturerna +22°C och
−7°C. Som komplement valdes den amerikanska US06 körcykeln, som har ett mer aggres- sivt körmönster än NEDC körcykel, för att representera denna typ av körning. Slutligen simulerades en omkörning av en långtradare för att generera data med en motorbelastning motsvarande full last.
Mätningar av reglerade och flera icke reglerade emissionskomponenter utfördes, inklusive
toxiska föreningar och mätning av partiklarnas storleksfördelning.
Resultat
Eftersom en stor mängd figurer och resultat presenteras i rapporten visas endast några av de viktigaste resultaten och slutsatserna i denna sammanfattning. De emissionskomponen- terna respektive effekter på hälsa och miljö från emissioner som speciellt lyfts fram i sam- manfattningen är:
• HC emissioner
• NO
Xemissioner
• Partikelemissioner (massa och totalt antal partiklar)
• Ozonbildningspotential
• Cancer risk index
• Försurning
Eftersom bilarna testades både vid ”normal” (+22°C) och lägre (-7°C) temperatur, visar några av diagrammen resultat för båda dessa temperaturer. I figurerna har följande beteck- ningar för bilarna använts:
• SI-P: Den bensindrivna Peugeot 307
• SI-G: Den bensindrivna VW Golfen
• CI-CR/DPF: Den dieseldrivna Peugeot 307 med common rail (CR) insprutning och dieselpartikelfilter (DPF)
• CI-UI/HP: Den dieseldrivna VW Golfen med högtrycks insprutning (HP) med en- hetsinjektorer (UI)
Valda emissionskomponenter
Från resultaten för HC emissionerna i Figur S.1 framgår att nivån generellt är väsentligt högre för bensinbilarna än för deras dieseldrivna motsvarigheter. Dessutom påverkas HC emissionerna för bensinbilarna mer av temperaturen än vad som är fallet för dieselbilarna.
En användning av avancerad teknik för att generellt minska kallstartemissionerna skulle kunna minska HC emissionerna väsentligt i framtiden.
De lägre nivåerna av HC emissioner för dieselbilarna indikerar också att emissionerna av toxiska flyktiga föreningar bör vara låga. Så var också fallet för de flesta av dessa emis- sionskomponenter.
Resultaten i Figur S.2 för NO
Xemissionerna − allmänt ansett som ett stort problem för
dieselbilar − bekräftar förväntningarna om en högre nivå för dieselbilarna. Bensinbilarna
kan utnyttja möjligheten att använda en så kallad trevägskatalysator (TWC) för att reducera
NO
Xemissionerna, medan de oxidationskatalysatorer som används till dieselbilar har en
mycket ringa inverkan på NO
Xemissionerna. Något förvånande var den avsevärt högre
NO
Xnivån vid den lägre temperaturen för dieselbilarna. Den endra rimliga förklaringen till
denna trend är att avgasåterföringen (EGR) stängs av under kallstartdelen av testcykeln. I
framtiden kommer NO
Xreducerande katalysatorer att vara nödvändiga för att dieselbilar
för närvarande.
HC emissioner i NEDC vid +22°C and -7°C
0,013 0,20
0,52
0,010 0,05
0,08
0,012 0,027
0,0 0,1 0,2 0,3 0,4 0,5 0,6
SI-P SI-G CI-CR/DPF CI-UI/HP
HC emissioner (g/km)
Temperatur: +22°C Temperatur: -7°C Diesel
Bensin
Figur S.1. HC emissioner i NEDC
NOX emissioner i NEDC vid +22°C and -7°C
0,61
0,55
0,040 0,052
0,37 0,37
0,033 0,073
0,0 0,1 0,2 0,3 0,4 0,5 0,6 0,7
SI-P SI-G CI-CR/DPF CI-UI/HP
NOX emissioner (g/km)
Temperatur: +22°C Temperatur: -7°C Diesel
Bensin
Figur S.2. NO
Xemissioner i NEDC
Partikelemissionerna anses vara ett stort problem för dieselbilar. Som förväntat var också nivån för partikelemissionerna högst för den dieselbil som inte hade något partikelfilter (Figur S.3), även om nivån för denna bilindivid faktiskt låg under Euro IV kraven. En ny motor med lägre partikelemissioner än den testade har introducerats under hösten 2001 och början av 2002. Partikelemissionerna var generellt lägre för dieselbilen med partikelfilter jämfört med bensinbilarna. Partikelnivån låg högre för bensinbilarna vid den lägre tempe- raturen än vid den ”normala” testtemperaturen. Emellertid var nivån vid den låga tempe- raturen väsentligt lägre än för tidigare resultat i litteraturen, vilket indikerar att en avsevärd förbättring har skett inom detta område.
Partilkelemissioner i NEDC vid +22°C and -7°C
0,7 1,3
0,3
22,1
2,1
5,3
0,3
32,4
0 5 10 15 20 25 30 35
SI-P SI-G CI-CR/DPF CI-UI/HP
Partikelemissioner (mg/km)
Temperatur: +22°C Temperatur: -7°C
Diesel Bensin
Figur S.3. Parikelemissioner i NEDC
Antalet partiklar och partikelstorleksfördelningen mättes med en elektrisk lågtrycksim- paktor (ELPI). Detta instrument kan mäta antalet partiklar av 12 olika storlekar för en ae- rodynamisk diameter mellan 7 nm och 6 µm. En av fördelarna med ELPI-instrumentet är att det kan mäta partikelemissionerna i realtid.
Resultaten för det totala antalet partiklar i NEDC cykeln visas i Figur S.4. Motsvarande resultat i US06 och vid omkörning visas i Figur S.5. Notera att båda figurerna har logarit- miska skalor på y-axlarna.
Antalet partiklar i NEDC cykeln (Figur S.4) var högst för dieselbilen utan partikelfilter.
De två bensinbilarna låg ungefär 2 storleksordningar (dvs. 2 tiopotenser) lägre. Den lägsta nivån erhölls med dieselbilen med partikelfilter, dvs. ungefär en storleksordning lägre än för bensinbilarna.
I US06 körcykeln (Figur S.5) ökade antalet partiklar väsentligt jämfört med resultaten från
NEDC körcykeln till en nivå ungefär lika hög som för dieselbilen utan partikelfilter. Nivån
för omkörningstestet var lägre för bensinbilen än i US06. I båda testerna hade dieselbilen
ningar lägre än för de övriga bilarna.
Totalt antal (mätta) partiklar (antal/km) i NEDC vid +22°C and -7°C
9,5E+12 8,2E+12
1,9E+11 3,5E+13
6,1E+11
7,2E+14
4,1E+12
8,2E+14
1,0E+11 1,0E+12 1,0E+13 1,0E+14 1,0E+15
SI-P SI-G CI-CR/DPF CI-UI/HP
Totalt antal partiklar (antal/km)
NEDC +22°C NEDC -7°C
Bensin Diesel
Figur S.4. Totalt antal partiklar i NEDC
Totalt antal (mätta) partiklar (antal/km) i US06 och vid omkörning
4,4E+14
6,3E+13
2,1E+10 2,6E+12
2,2E+14 2,3E+14
1,4E+10
3,3E+14
2,1E+12
1,0E+10 1,0E+11 1,0E+12 1,0E+13 1,0E+14 1,0E+15
SI-P SI-G CI-CR/DPF CI-UI/HP (5) CI-UI/HP (6)
Totalt antal partiklar (antal/km)
US06 Omkörning
Bensin Diesel
Not tested
Figur S.5. Totalt antal partiklar i US06 och vid omkörning
Inverkan av emissioner på hälsa och miljö
I utvärderingarna av effekterna på hälsa och miljö har den årliga medeltemperaturen på +7°C använts i de flesta fallen. Enda undantaget var för ozonbildningspotentialen där en temperatur på +14°C användes i ställer. För att ge ett visst perspektiv på jämförelserna vi- sas också resultaten för bilar av årsmodell 1993/1994 från en tidigare studie. För att för- enkla presentationen av resultaten har ett index använts (referensnivå: bensinbilar av års- modell 1993/1994).
Ozonbildningspotentialen, som visas i Figur S.6 var generellt lägre för dieselbilarna än för deras bensindrivna motsvarigheter. Orsaken är främst de väsentligt lägre HC emissionerna jämfört med bensinbilarna. Emellertid skall man också notera att nivåerna är väsentligt lägre för de nya bilarna är för de gamla oberoende av drivmedel.
Ozonbildningspotential utvärderad för en medeltemperatur av +14°C Referens (index=100): bensindrivna bilar av årsmodell 93/94
16,4
38,3
14,2
2,1 2,4
100
0 20 40 60 80 100 120
Petrol 93/94 SI-P SI-G
Diesel 93/94 CI-CR/DPF CI-UI/HP
Ozonbildningspotential (bensin 93/94=100)
Diesel Bensin
Figur S.6. Ozonbildningspotential (index: bensin 93/94=100)
Resultaten för cancerriskindexet visas i Figur S.7. Riskfaktorer för de uppmätta förening- arna har använts som viktsfaktorer i beräkningen av cancerriskindexet.
Först bör man notera att nivån för bilarna som testades i denna studie var signifikant lägre
än för de äldre bilarna (Figur S.7). På grund av de stora osäkerheterna för riskfaktorerna
för varje enskild förening och spridningen mellan bilarna är det svårt att avgöra om diesel-
eller bensinbilar har en lägre nivå. Bidraget till cancerriskindexet domineras av de poly-
cykliska aromatiska föreningarna (PAC) för bensinbilarna. Dessa emissionskomponenter
emitteras primärt vid låga temperaturer. För dieselbilar utan partikelfilter bidrar partikele-
missionerna mest till cancerrisken. Den praktiskt taget totala elimineringen av partikele-
missionerna när partikelfilter används har en avgörande inverkan på cancerriskindexet.
Cancerriskindex (bensin 93/94=100)
0 20 40 60 80 100 120
Petrol 93/94 SI-P SI-G Diesel 93/94 CI-CR/DPF CI-UI/HP
Cancerriskindex (bensin 93/94=100)
PAC Aldehyder Alkener Benzene Partiklar 100
11
71
2,2
15 4,0
Bensin Diesel
Figur S.7. Cancerriskindex (bensin 93/94=100)
Kväveoxider (NO
X) och svaveloxider (SO
X), liksom även ammoniak (NH
3), bidrar till för- surningen. Emellertid måste även drivmedelsproduktionen tas i beaktande, eftersom för- surningen kan anses vara en regional effekt. I Figur S.8 visas resultaten för försurningsin- dexet.
Försurningspotential (i NOX ekvivalenter)
Referens (index=100): bensindrivna bilar av årsmodell 93/94
27 59
10 9
112
80 75
31 27 36
41 37
0 20 40 60 80 100 120 140 160
Petrol 93/94 SI-P SI-G
Diesel 93/94 CI-CR/DPF CI-UI/HP
Försurning, index (bensin 93/94=100)
Fordon Drivmedelsprod.
100
Diesel Bensin
47,5 45,0
143
106 102
Figur S.8. Försurningspotential (index: bensin 93/94=100)
En uppdelning i bidrag till försurning från drivmedelsproduktion och från fordonet har gjorts i Figur S.8. Eftersom NO
Xnivån var mycket låg för bensinbilarna, samtidigt som svavelhalten i den bensin som användes var låg, domineras försurningen av drivme- delsproduktionen för de nya bensinbilarna. Dieselbilar har höga NO
Xemissioner och detta är orsaken till den höga nivån för dessa bilar. I detta fall är bidraget från drivmedelspro- duktionen lägre än för bensinbilarna.
Diskussion
Införandet av ny emissionsbegränsande teknologi har väsentligt minskat emissionerna från bensindrivna personbilar under det senaste decenniet. Efter introduktionen av trevägskata- lysatortekniken (TWC) som avgasreningskoncept har fortsatta förbättringar av denna tek- nik minskat emissionerna ännu mer. Mot bakgrund av detta framsteg har emissionerna från dieselbilar blivit föremål för större uppmärksamhet från myndigheter och miljöorganisa- tioner. Emellertid har inte emissionsproblemet för bensinbilar vid låga temperaturer heller lösts fullständigt. Man glömmer också ofta att emissionstester normalt genomförs i ett temperaturintervall av +20°C till +30°C. I det kalla nordiska klimatet måste också låga temperaturer beaktas. Trots allt uppvisar de testade bensinbilarna en avsevärt förbättring vid dessa temperaturer jämfört med äldre bilar.
Även om emissionerna från dieseldrivna bilar har minskat väsentligt under det senaste de- cenniet har den generella uppfattningen varit att dessa bilar emitterar väsentligt mer hälso- farliga emissioner än deras bensindrivna motsvarigheter. Resultaten i denna studie visar att flera icke reglerade emissionskomponenter från dieselbilar låg på samma nivå som för ben- sinbilar och i flera fall lägre. Två stora problem kvarstår − NO
Xoch partikelemissioner. I dag finns ingen motsvarighet till TWC reningstekniken för dieselbilar för att reducera NO
Xemissionerna men sådan teknik håller nu på att utvecklas. Ny partikelfilterteknik har kom- mersialiserats av PSA och andra tillverkare kommer att följa detta exempel.
Beräkningen av inverkan på hälsa och miljö från avgasemissionerna ger en bättre insikt än att enbart redovisa resultaten för emissionskomponenterna. Emellertid bör det också note- ras att i en del fall är indata för dessa beräkningar (t.ex. cancerrisk) ännu fullt utvecklade.
Slutsatser
Antalet bilar i denna studie var för få för att tillåta en generalisering av resultaten till att gälla för alla bilar. Urvalet av bilar gjordes med den förutsättningen att inverkan av ny tek- nik skulle kunna jämföras med tidigare genererade resultat från äldre bilar. Följande över- gripande slutsatser kan dras:
• De reglerade emissionerna för alla bilar låg mycket nära certifieringsdata. Därför kan bilarna anses ha varit representativa stickprov för varje bilmodell. De två bensindrivna bilarna i denna studie visade sig ligga på samma nivå som några av de bästa bilar som tidigare testats vid MTC.
• Som förväntat var CO och HC emissionerna generellt sett lägre för dieselbilarna än för bensinbilarna medan resultaten för NO
Xvar de rakt motsatta. Partikelemissionerna var högre för dieselbilen utan partikelfilter jämfört med dess bensindrivna motsvarighet.
Emellertid hade dieselbilen med partikelfilter lägre partikelemissioner än motsvarande
bensinbil.
låga för alla bilar.
• Emissionerna av aldehyder, ett välkänt problem för dieselmotorer, låg på eller under detektionsgränsen för dieselbilarna vid den högre temperaturen (+22°C). Vid den lägre temperaturen ( −7°C) var nivån ungefär två gånger högre än detektionsgränsen. Detta indikerar att väsentliga förbättringar har gjorts inom detta område jämfört med äldre dieselbilar.
• Bensinbilarna hade högre emissioner av bensen, eten, propen och 1,3-butadien än deras dieseldrivna motsvarigheter, även om nivåerna för dessa emissionskomponenter var lå- ga för alla bilar.
• PAC/PAH emissionerna är normalt låga för bensinbilar vid höga temperaturer. Efter- som nivån av dessa emissioner tidigare har varit högre för dieselbilar vid dessa tempe- raturer, har detta ansetts som ett stort emissionsproblem för dieselbilar. Det har sällan noterats att nivån ökar väsentligt för bensinbilar när temperaturen sjunker. PAC emis- sionerna för de bensinbilar som testades i denna studie låg väsentligt lägre jämfört med tidigare tester på äldre bilar vid låg temperatur. PAC emissionerna för dieselbilarna var generellt lägre än deras bensindrivna motsvarigheter vid den årliga medeltemperaturen +7°C. För dieselbilen med partikelfilter var PAC emissionerna en storleksordning lägre än för den bensindrivna bilen från samma tillverkare. En jämförelse med data för bilar av 1993/1994 års modell uppvisar en skillnad på mer än 2 tiopotenser. Även om die- selbilen utan partikelfilter hade lägre PAC emissioner än dess bensindrivna motsvarig- het medför den stora variationen mellan bilarna att nya dieselbilar (utan partikelfilter) inte nödvändigtvid är bättre än nya bensinbilar i detta avseende.
• Dieselbilen utan partikelfilter emitterade i NEDC cykeln vid de båda testtemperaturer- na ungefär 2 tiopotenser fler partiklar än dess bensindrivna motsvarighet. Dock låg an- talet partiklar i US06 cykeln på ungefär samma nivå som för bensinbilarna. Ökningen av antalet partiklar för bensinbilarna i denna körcykel jämfört med NEDC körcykeln kan främst hänföras till en ökning av de minsta partiklarna (7 − 30 nm). Dieselbilen med partikelfilter var enastående i detta avseende då antalet partiklar för den var minst en storleksordning lägre än för bensinbilarna. Partikelfiltret var speciellt effektivt på att minska de så kallade nanopartiklarna. Jämförelser med tidigare data visade en minsk- ning av partikelantalet för dieselbilen utan partikelfilter.
• Ozonbildningspotentialen var väsentligt lägre för dieselbilarna, dvs. en storleksordning lägre än för bensinbilarna. Detta beror främst på de låga HC emissionerna för dieselbi- larna jämfört med bensinbilarna. Om förångningsemissionerna hade tagits hänsyn till hade den relativa skillnaden blivit ännu större.
• Cancerriskindexet var generellt lägre för de bilar som testades i denna studie jämfört
med äldre bilar. Dieselbilen med partikelfilter hade ett lägre cancerriskindex än den
bensindrivna motsvarighet. För dieselbilen utan partikelfilter var nivån något högre än
för bensinbilen från samma tillverkare. Generellt sett erhölls den lägsta nivån för die-
selbilen med partikelfilter, dvs. en nästan 98% lägre nivå än för bensinbilar av årsmo-
dell 1993/1994. Det bör noteras att osäkerheten är hög när det gäller cancerriskindexet
som följd av den stora variationen för riskfaktorerna beroende på vilken källa som an-
vänds. Därför bör små skillnader inte beaktas.
• De miljöeffekter som är främst förknippade med NO
Xemissioner, såsom NO
2bild- ningspotential, försurning och övergödning, var större för dieselbilarna än deras ben- sindrivna motsvarigheter beroende på de högre NO
Xemissionerna. Bidraget från bränsleproduktion var högre för bensinbilarna.
• Som förväntat var utsläppen av klimatgaser och energianvändningen lägre för diesel- bilarna än för bensinbilarna. Detta beror delvis på en lägre energianvändning, delvis på en högre verkningsgrad i drivmedelsproduktionen.
Även om syftet med denna studie var att jämföra emissionerna från dieselbilar med emis-
sionerna från bensinbilar, kan det inte undvikas att påpekas att fokuseringen var något stör-
re på resultaten från dieselbilarna. Detta beror främst på att de flesta data på icke reglerade
emissioner har genererats på bensinbilar. Relativt lite är känt om inverkan av ny teknik i
detta avseende. Som förväntat är NO
Xoch partikelemissionerna de största emissions-
problemen för dieselbilarna. Resultaten för partikelemissionerna visar att ett partikelfilter
är mycket effektivt på att minska dessa emissioner. För båda de nämnda emissionskompo-
nenterna har lösningar som kan minska dessa problem introducerats, eller kommer att in-
troduceras på marknaden inom en nära framtid. Icke desto mindre, om dieselbilar förbätt-
ras i detta avseende så kommer också bensinbilarna att göra det. Testresultaten för de icke
reglerade emissionerna, och de effekter på hälsa och miljö som utvärderats, visade lägre
nivåer i några fall för dieselbilarna och högre i andra fall jämfört med bensinbilarna. Så
småningom, när emissionerna från fordon som körs på båda typerna av drivmedel kommer
att kunna minskas till försumbara nivåer, kommer framgent energieffektivitet och emissio-
ner av klimatgaser att öka i betydelse.
EXECUTIVE SUMMARY Introduction and background
The transport sector contributes significantly to the air pollution and in particular, this statement is valid for the local air quality, since vehicles often operate in populated areas.
In one particular aspect, the light-duty vehicles have been subject much interest lately, and this is regarding the particulate emissions from diesel-fuelled cars. Since the market pene- tration of diesel cars has been ever increasing on most markets in Europe (to over 30% in 2001), this issue has become even more pronounced. Sweden has been an exemption in this respect. Here, the market penetration has been slowly decreasing during the last 3 years and now it seems to have stabilised at level of slightly above 5%. In order for the vehicle manufacturers to meet the agreement to reduce CO
2emissions in the future, an in- creased market share of diesel cars is a possible route.
As there are relatively few data on unregulated emissions from modern diesel cars, it was of particular interest to generate such data. It was also considered important to compare these data with data on modern petrol-fuelled cars. After discussions with the Swedish Na- tional Road Administration (SNRA), funding for the project was granted. MTC in Sweden was commissioned to carry out the experimental part of the project.
Experimental
The following four cars were selected for the investigation after discussions with SNRA, the Swedish wholesalers and the car manufacturers:
• A diesel-fuelled Peugeot 307 2.0 HDi FAP, equipped with a particulate filter
• A diesel-fuelled VW Golf 1,9 TDI (without particulate filter)
• A petrol-fuelled Peugeot 307 with 1.6 litre engine
• A petrol-fuelled VW Golf with 1.6 litre engine
The cars were kindly lent by the Swedish wholesalers or by the car manufacturer in one case (Peugeot 307 HDi FAP).
The cars were tested according to the NEDC cycle at ambient temperatures of +22°C and
−7°C. In addition, the US06, having a more aggressive driving pattern than the NEDC driving cycle was chosen to reflect this type of driving as well. Finally, overtaking of a lorry was simulated to generate data on full load operation.
Measurements of regulated and several unregulated emission components were carried out, including air toxics and particle size distribution.
Results
As a great number of figures and results are presented in the report, only a few of the most
important findings are shown in this summary. The emission components or the specific
impacts on health and environment from emissions that are particularly highlighted in the executive summary are:
• HC emissions
• NO
Xemissions
• Particulate emissions (mass and total number)
• Ozone forming potential
• Cancer risk index
• Acidification
As the cars were tested at both “normal” (+22°C) and lower ( −7°C) ambient temperatures, several of the diagrams show the results for both these temperatures. In the figures, the following denotations for the cars are used:
• SI-P: Petrol-fuelled Peugeot 307
• SI-G: Petrol-fuelled VW Golf
• CI-CR/DPF: Diesel-fuelled Peugeot 307 with common rail (CR) injection and diesel particulate filter (DPF)
• CI-UI/HP: Diesel-fuelled VW Golf with high-pressure (HP) unit injectors (UI)
Selected emission components
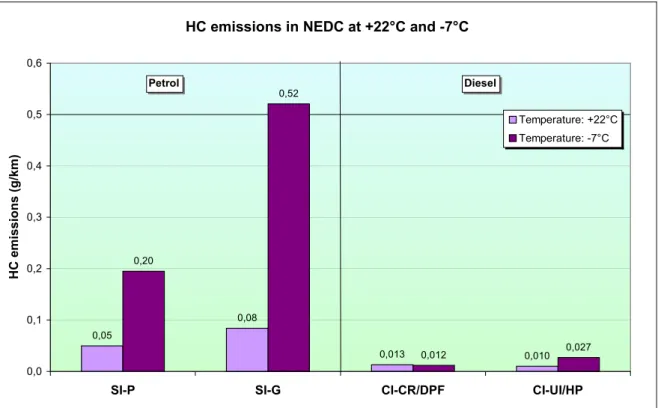
In Figure ES.1, the results on HC emissions show that the level was generally significantly higher for the petrol cars than for their diesel counterparts. Moreover, HC emissions from petrol cars were more influenced by the ambient temperature than are diesel cars. The use of advanced technology for reducing cold start emissions in general could reduce the HC level considerably in the future.
The lower HC emission level for the diesel cars generally also indicates lower levels of toxic volatile organic compounds. This was also the case for most of these emission com- ponents.
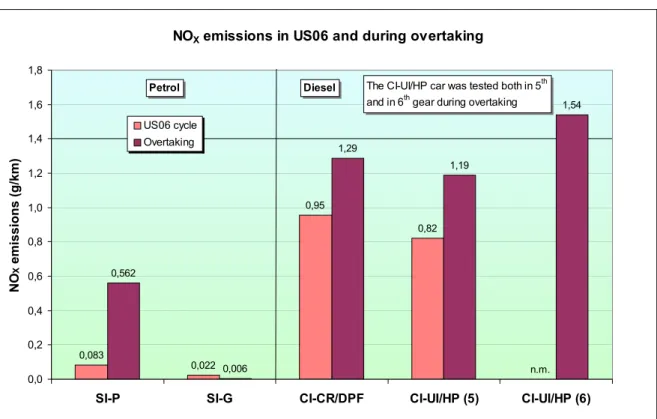
The results in Figure ES.2 on NO
Xemissions − generally considered as a main problem
for diesel cars − confirm the expectations of a higher level for diesel cars. Petrol cars ex-
ploit reduction of the NO
Xemissions in a so-called three-way catalyst (TWC), while the
oxidation catalysts on diesel cars have very little influence on the NO
Xemissions. Some-
what surprising was the considerably higher NO
Xlevel at the lower ambient temperature
for the diesel cars. The only plausible explanation for this trend is that the exhaust gas re-
circulation (EGR) is cut off during the cold start phase of the test cycle. In the future, a
NO
Xreducing catalyst will be necessary for the diesel cars to achieve a NO
Xlevel on pair
with the petrol cars. Such catalysts are currently being developed.
HC emissions in NEDC at +22°C and -7°C
0,013 0,010
0,20
0,52
0,05
0,08
0,012 0,027
0,0 0,1 0,2 0,3 0,4 0,5 0,6
SI-P SI-G CI-CR/DPF CI-UI/HP
HC emissions (g/km)
Temperature: +22°C Temperature: -7°C Diesel
Petrol
Figure ES.1. HC emissions in NEDC
NOX emissions in NEDC at +22°C and -7°C
0,040 0,052
0,37 0,37
0,073
0,033
0,55 0,61
0,0 0,1 0,2 0,3 0,4 0,5 0,6 0,7
SI-P SI-G CI-CR/DPF CI-UI/HP
NOX emissions (g/km)
Temperature: +22°C Temperature: -7°C Diesel
Petrol
Figure ES.2. NO
Xemissions in NEDC
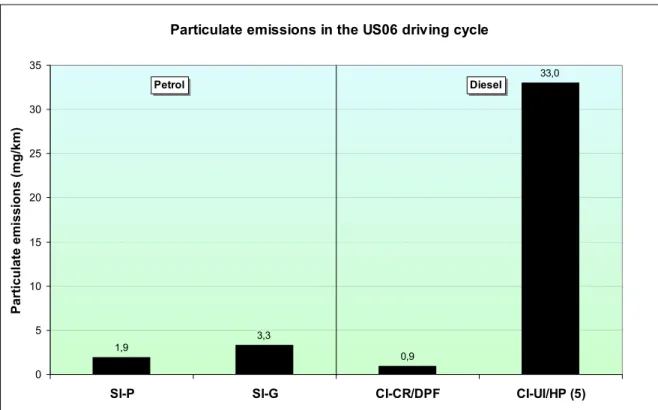
Particulate emissions are considered a major emission problem for diesel cars. As ex-
pected, the particulate level was also highest for the diesel car without a particulate filter
(Figure ES.3), although the level for this car was actually lower than the Euro IV limit. A
new engine with lower particulate emissions than the tested car has been introduced in
autumn 2001 or early 2002. The particulate emissions were generally lower for the diesel car with a particulate filter than for the petrol cars. The petrol cars had a higher particulate level at the low ambient temperature than at the “normal” test temperature. However, the level at the low temperature was significantly lower than in previous results in the litera- ture, indicating a considerable improvement in this area.
Particulate emissions in NEDC at +22°C and -7°C
22,1
2,1
5,3
0,3
32,4
1,3 0,3 0,7
0 5 10 15 20 25 30 35
SI-P SI-G CI-CR/DPF CI-UI/HP
Particulate emissions (mg/km)
Temperature: +22°C Temperature: -7°C
Diesel Petrol
Figure ES.3. Particulate emissions in NEDC
The particle number and particle size distribution was measured with an electrical low- pressure impactor (ELPI). This instrument measures particle number at 12 stages for an aerodynamic particle size between 7 nm and 6 µm. One of the features of the ELPI instru- ment is that it can measure the particle emissions in real-time.
The results for the total particle number in the NEDC cycle are shown in Figure ES.4. The corresponding results in the US06 cycle and during overtaking are shown in Figure ES.5.
Note that both figures have logarithmic scales on the y-axes.
The particle number in NEDC (Figure ES.4) was highest for the diesel car without a par- ticulate filter. The two petrol cars had a level that was roughly two orders of magnitude lower. The lowest level was achieved by the diesel car with a particulate filter, i.e. about one order of magnitude lower than for the petrol cars.
In the US06 cycle (Figure ES.5), the particle number compared with the results in NEDC
increased considerably for the petrol cars to roughly the same level as for the diesel car
without a particle filter. The level during overtaking was lower for the petrol cars than in
the US06. In both tests, the diesel car with a particulate filter had very low total number of
particles, i.e. several orders of magnitude lower than the other cars.
Total (measured) particle number (#/km) in NEDC at +22°C and -7°C
9,5E+12 8,2E+12
1,9E+11 3,5E+13
6,1E+11
7,2E+14 8,2E+14
4,1E+12
1,0E+11 1,0E+12 1,0E+13 1,0E+14 1,0E+15
SI-P SI-G CI-CR/DPF CI-UI/HP
Total particle number (#/km)
NEDC +22°C NEDC -7°C
Petrol Diesel
Figure ES.4. Total particulate number in NEDC
Total (measured) particle number (#/km) in US06 and overtaking
4,4E+14
6,3E+13
2,1E+10 2,6E+12
2,2E+14 2,3E+14
1,4E+10
3,3E+14
2,1E+12
1,0E+10 1,0E+11 1,0E+12 1,0E+13 1,0E+14 1,0E+15
SI-P SI-G CI-CR/DPF CI-UI/HP (5) CI-UI/HP (6)
Total particle number (#/km)
US06 Overtaking
Petrol Diesel
Not tested
Figure ES.5. Total particulate number in US06 and during overtaking Impact of emissions on environment and health
In the evaluation of the effects on environment and health, the yearly average temperature
in Sweden of +7°C was used in most cases. The only exception was the ozone forming
potential, where a temperature of +14°C was used instead. To provide some perspective for the comparisons, results from cars of model year 1993/1994 from a previous study are shown as well. To simplify the presentation of the results, an index has been used (base level: petrol cars of model year 1993/1994).
The ozone formation potential, as shown in Figure ES.6 was generally lower for diesel cars than their petrol counterparts. The reason is primarily due to the significantly lower HC emissions in comparison to the petrol cars. However, it should also be noted that the level was generally considerably lower for the newer cars than for the older cars, regard- less of fuel used.
Ozone forming potential evaluated at an average temperature of +14°C Baseline (index=100): petrol-fuelled cars of model year 93/94
16,4
38,3
14,2
2,1 2,4
100
0 20 40 60 80 100 120
Petrol 93/94 SI-P SI-G
Diesel 93/94 CI-CR/DPF CI-UI/HP
Ozone forming potential (petrol 93/94=100)
Diesel Petrol
Figure ES.6. Ozone forming potential (index: petrol 93/94=100)
The results for the cancer risk index are shown in Figure ES.7. Unit risk factors for the measured emission compounds have been used as weighting factors in the calculation of the cancer risk index.
First, it should be noted that the level for the cars tested in this study was significantly
lower than for the old cars (Figure ES.7). Due to the uncertainty regarding the unit risk
factor for each one of the emission compounds, and the scatter between the cars, it is
somewhat difficult to conclude whether diesel or petrol cars have a lower level. The con-
tribution to the cancer risk index was dominated by the polycyclic aromatic compounds
(PAC) for the petrol cars. These emissions are primarily emitted at low ambient tempera-
ture. For diesel cars without particulate filters, particulate emissions contributed most to
the cancer risk. The virtual elimination of the particulate emissions by using a particulate
filter does had a considerable impact on the cancer risk index.
Cancer risk index (petrol 93/94=100)
0 20 40 60 80 100 120
Petrol 93/94 SI-P SI-G Diesel 93/94 CI-CR/DPF CI-UI/HP
Cancer risk index (petrol 93/94=100)
PAC Aldehydes Alkenes Benzene Particulates 100
11
71
2,2
15 4,0
Petrol Diesel
Figure ES.7. Cancer risk index (petrol 93/94=100)
Oxides of nitrogen (NO
X) and sulphur (SO
X), as well as ammonia (NH
3), contribute to the acidification. However, fuel production has also to be taken into account, as acidification could be considered as a regional impact. In Figure ES.8, the results for the acidification index are shown.
Acidification potential (in NOX equivalents)
Baseline (index=100): petrol-fuelled cars of model year 93/94
27
59,0 79,7 75,2
41 37 36 31 27
112
10,5 9,2
0 20 40 60 80 100 120 140 160
Petrol 93/94 SI-P SI-G
Diesel 93/94 CI-CR/DPF CI-UI/HP
Acidification index (petrol 93/94=100) VehicleFuel prod.
100
Diesel Petrol
47,5 45,0
143
106 102
Figure ES.8. Acidification potential (index: petrol 93/94=100)
A split in fuel production and vehicle emissions has been made in Figure ES.8. As the NO
Xlevel was very low for the petrol cars, as well as the sulphur level was for the petrol used, the acidification is dominated by fuel production for the new petrol cars. Diesel cars had a high NO
Xlevel and this was the reason for the high level for these cars. In this case, the contribution from fuel production was lower than for the petrol cars.
Discussion
The introduction of new emission control technology has significantly decreased the emis- sions from petrol-fuelled passenger cars during the past decade. Since the introduction of the three-way catalyst (TWC) emission control system, subsequent improvements of this technology has decreased the emissions even further. In view of this progress, the emis- sions from diesel cars have received more attention from government authorities and envi- ronmental groups. However, the increase in emissions at low ambient temperatures from petrol cars still have not completely been solved, although this is often forgotten as emis- sion tests are usually carried out in the +20°C to +30°C temperature interval. In the cold Nordic climate, low ambient temperatures must be considered. Eventually, the two petrol cars tested in this study showed a considerable improvement at such temperatures com- pared to older cars.
Although the emissions from diesel-fuelled cars have decreased considerably during the last decade, the general perception has been that these cars emit significantly higher quan- tities of harmful emissions compared to their petrol counterparts. The results in this study showed that several unregulated emission components from diesel cars are on the same level as from petrol cars, and in some cases, lower. Two major problems remain − NO
Xand particulate emissions. Today, there is no equivalent technology to the TWC for diesel cars for reducing NO
Xemissions but such aftertreatment is currently in development.
Emerging particulate filter technology has been commercially introduced by PSA and other car manufacturers will follow this path.
The calculation of the impact on health and environment from exhaust emissions provide a better insight than only showing the results on the emission components. However, it should be noted that in some cases, the input data for these calculations (e.g. cancer risk) is not fully developed yet.
Conclusions
The number of cars in this study was too few to allow generalisation of the results for all cars. The selection of cars was made on the condition that the impact of new technology could be compared with previously generated results on older cars. The following main conclusions can be drawn:
• The regulated emission results on all tested cars were very close to the certification data. Therefore, they could be considered representative samples of each car model.
The two petrol cars in this study proved to be on pair with some of the best cars that have been tested previously at MTC.
• As expected, CO and HC emissions were generally lower from diesel cars than from
petrol cars, while the results for NO
Xemissions was the opposite. Particulate emissions
were higher from the diesel car without particulate filter compared to its petrol coun-
than the corresponding petrol car.
• Emissions of some nitrogen containing compounds, as ammonia (NH
3) and nitrous oxide (N
2O), were low from all cars.
• The aldehyde emissions, a well-known problem for diesel engines, were at or below the detection limit for the diesel cars at high ambient temperature (+22°C). At the lower ambient temperature ( −7°C), the level was approximately twice the detection limit. This implies that considerable improvements have been made in this area com- pared to diesel cars of the past.
• The petrol cars had higher emissions of benzene, ethene, propene and 1,3-butadiene than their diesel counterparts, although the levels of these emission components were low for all cars.
• PAC/PAH emissions are usually low from petrol cars at high ambient temperatures. As the level of these emissions has previously been higher for diesel cars at these ambient conditions, this has been considered as one of the main emission problems for diesel cars. It has seldom been recognised that the level increases considerably for petrol cars when the ambient temperature decreases. The PAC level for the petrol cars tested in this study were considerably reduced compared to previous tests on older cars at the low ambient temperature. The PAC levels for the diesel cars were generally lower than for their petrol counterparts at the average yearly temperature of +7°C. The PAC level for the diesel car with a particulate filter was one order of magnitude lower than the petrol car from the same car manufacturer. A comparison with data on 1993/1994 model years of petrol cars gives a difference of more than 2 orders of magnitude. Al- though the diesel car without a particulate filter had lower PAC emissions than its pet- rol counterpart, the great variation between cars implies that new diesel cars (w/o par- ticulate filters) are not necessarily better than new petrol cars in this respect.
• The diesel car without a particulate filter emitted about 2 orders of magnitude more particles than its petrol counterpart in the NEDC cycle at both temperatures. However, in the US06 test cycle the number of particles was on roughly the same level as for the petrol cars. The increase in particulate number for the petrol cars in this cycle com- pared to the NEDC cycle was mainly attributable to an increase of the smallest parti- cles (7 − 30 nm). The diesel car with a particulate filter was outstanding in this respect having particulate number emissions at least one order of magnitude lower than the petrol cars. The particulate filter was particularly effective in reducing the number of nanoparticles. Comparison with older data showed a reduction of the particulate num- ber for the diesel car without particulate filter.
• The ozone forming potential was considerably lower for the diesel cars, i.e. roughly one order of magnitude lower than for the petrol cars. This is mainly due to the low level of HC emissions for diesel cars compared to the petrol cars. Should the evapora- tive emissions have been taken into account, the relative difference would have been even greater.
• The cancer risk index was generally significantly lower for the cars tested in this study
compared to older vehicles. The diesel car with a particulate filter had a lower cancer
risk index than its petrol counterpart. For the diesel car without a particulate filter, the
level was slightly higher than for the petrol car from the same manufacturer. In general,
the lowest value was obtained for the diesel car with a particulate filter, i.e. almost 98%
lower level than petrol cars of model year 1993/1994. It should be noted that the un- certainty is high for the cancer risk index due to the varying level for the unit risk fac- tors, depending on which source is used. Therefore, small differences should not be considered.
• The environmental effects mostly related to the emissions of NO
X, such as NO
2form- ing potential, acidification and eutrophication, were greater for the diesel cars than their petrol counterparts, due to the higher NO
Xemissions. The contribution from fuel pro- duction was higher for the petrol cars.
• As expected, climate change and energy use was lower for the diesel cars than for the petrol cars. This is partly due to the lower fuel consumption, partly to the higher effi- ciency in fuel production.
Although the scope of this study was to compare the emissions from diesel cars with the
emissions from petrol cars, it cannot be avoided to point out that the focus was shifted to-
wards the results on the diesel cars. This is mainly because most data on unregulated emis-
sions on new cars have been generated on petrol cars. Relatively little is known on the im-
pact of new technology in this respect. As expected, the NO
Xand particulate emissions are
the main emission problem on diesel cars. The results on particulate emissions show that a
particulate filter is very effective in reducing these emissions. For both emission compo-
nents, solutions that can alleviate these problems have been introduced, or will be intro-
duced on the market in the near future. Nevertheless, as diesel cars are improved in this
respect, so will petrol cars. The test results on the unregulated emissions, and the effects on
health and environment that were evaluated, showed lower levels in some cases for diesel
cars and higher levels in other cases compared to petrol cars. Eventually, as the emissions
from vehicles running on both types of fuels will be reduced to a negligible level, energy
efficiency and the emissions of greenhouse gases will become more pronounced in the fu-
ture.
1 INTRODUCTION
The transport sector contributes significantly to the air pollution and in particular, this is evident for the local air quality, since light and heavy-duty vehicles often operate in popu- lated areas. Therefore, it has been of interest to reduce the exhaust emissions from these vehicles. First, in the late 1980´s, the focus was on light-duty vehicles but lately, the focus has shifted somewhat towards heavy-duty vehicles. The latest move is logical, as the share of this vehicle category (of the transportation emissions) seems to be increasing in com- parison to the light-duty vehicles. However, in one particular aspect, the light-duty vehicles have been subject much interest lately, and this is regarding the particulate emissions from diesel-fuelled cars. Since the market penetration of diesel cars has been ever increasing on most markets in Europe (to over 30% in 2001), this issue has become even more pro- nounced. Sweden has been an exemption in this respect. Here, the market penetration has been slowly decreasing during the last 3 years and now it seems to have stabilised at level of slightly above 5%.
During the last years, climate gases (mainly CO
2) have also been much debated. It has be- come clear that the share of CO
2emissions from the transportation sector is large and in- creasing. Therefore, a voluntary agreement has been made between the European car manufactures (represented by their organisation ACEA) and the EU commission about re- ducing the CO
2emissions from the fleet of new cars by 25% from 1995 to 2008. Similar agreements has also been made between the car manufactures from Japan (JAMA) and Korea (KAMA) for 2009. Meeting this requirement is not easy. It has been speculated that increasing the share of diesel cars and cars with direct injection of petrol will be two of the main measures to meet this limit. Therefore, it is of interest to investigate the emissions from these two categories of engine/fuel technology in comparison to conventional petrol- fuelled cars.
In the EU, stricter emission limits for light-duty vehicles have been introduced subse- quently during the last decade and in 2005/2006, the so-called “Euro IV” emission regula- tion will be enforced. However, there are already numerous petrol-fuelled cars that fulfil this regulation
1and a few diesel cars can meet this emission level, although the late speci- fication of the regulation in the latter case may have delayed actual certification of the cars.
In the USA an in California, even stricter emission levels have been introduced (e.g.
SULEV according to the LEV II programme). There are some petrol-fuelled cars available on the U.S. market that can fulfil these emission limits, implying that there is still consid- erable scope for future development in this area, if this technology could be applied exten- sively.
New diesel cars that can fulfil the Euro IV regulation are about to be introduced on a larger scale within the 2003/2004 timeframe. A 74 kW engine, thought to be a mainstream engine for many of the cars produced by for the VW group of auto manufacturers, was introduced in the autumn of 2001. Presently, this car fulfils the German D4 emission norm that has emission limits corresponding to Euro IV. However, it has not yet been certified to the Euro IV emission regulation. Although the recent development in this area has been en- couraging, it has to be noted that the particulate level for diesel cars complying with Euro
1 In some cases, cars have an emission level significantly below Euro IV but the cars are certified to Euro III anyway.