Magnetic Resonance Imaging of the
Heart
Image quality, measurement accuracy and patient
experience
Britt-Marie Ahlander
Department of Medical and Health Sciences Linköping University, Sweden
Britt-Marie Ahlander, 2016
Cover, Per Lagman, with permission Siemens Healthineers.
Published article has been reprinted with the permission of the copyright holder.
Printed in Sweden by LiU-Tryck, Linköping, Sweden, 2016
ISBN 978-91-7685-742-7 ISSN 0345-0082
”Att våga är att förlora fotfästet en liten stund”. Sören Kirkegaard (1813-1855)
CONTENTS
ABSTRACT ... 1 LIST OF PAPERS ... 3 ABBREVIATIONS ... 5 INTRODUCTION ... 7 BACKGROUND ... 9Ischemic Heart Disease ... 9
Atherosclerosis ... 9
Ischemia... 9
Myocardial Infarction ... 10
Magnetic Resonance Imaging ... 11
Spin and magnetization ... 11
Excitation... 11
Relaxation ... 11
Safety ... 12
Cardiovascular Magnetic Resonance ... 12
Motion compensation ... 12
Data sampling and acceleration ... 13
Diagnostic methods ... 13
The CMR-examination ... 14
Image quality ... 15
Single photon emission computed tomography ... 16
Myocardial Perfusion SPECT ... 16
Tracers... 16
Gamma camera ... 17
Examination... 17
Well-being in the context of MRI ... 17
Anxiety ... 18
How to psychologically prepare the patient for the MRI study ... 19
Rationale... 20
AIMS ... 21
METHODS ... 23
Design ... 23
Data Collection ... 26
MRI (I&II) ... 26
MRI analysis (I&II) ... 27
Analysis of MPS (II) ... 30
Measures (III & IV) ... 31
Development of Magnetic Resonance Imaging-Anxiety Questionnaire (MRI-AQ) (III) ... 32
Procedure for the intervention study (IV) ... 33
Image quality ... 35
Statistics ... 35
Ethical considerations ... 37
RESULTS ... 39
In patients with ongoing atrial fibrillation, a SS-SSFP sequence showed better image quality than IR-FGRE (I) ... 39
Image quality ... 39
Artefacts... 39
Volumes ... 40
SI, SNR and CNR ... 40
For visual and quantitative evaluation of CMR stress first-pass perfusion, a GRE-EPI sequence demonstrated higher agreement with MPS than a SSFP sequence (II) ... 41
Scar and volumes... 41
SI, SNR and CNR ... 41
Visual assessment ... 41
Quantitative segmental CMR and MPS... 43
Development of the Magnetic Resonance Imaging Anxiety Questionnaire MRI-AQ (Paper III) ... 44
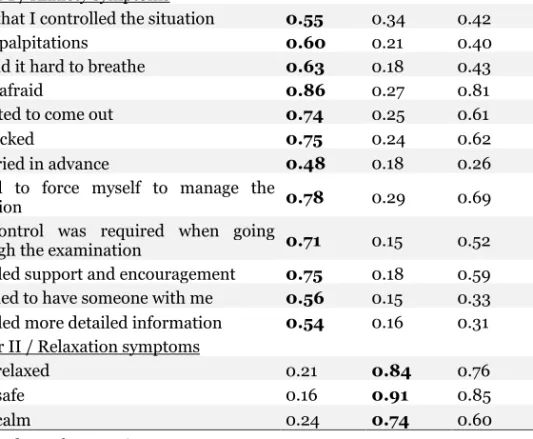
Item statistics ... 44
Factor structure ... 44
Internal consistency ... 44
Criterion related and known-group validity ... 44
Stability ... 45
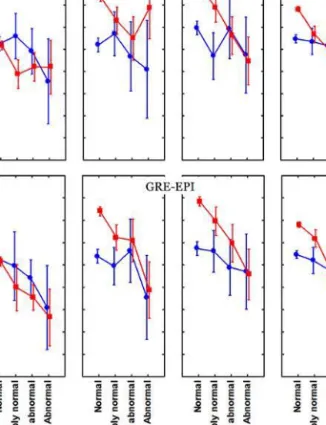
Video information prior to CMR examination resulted in more relaxed patients, but motion artefacts were not reduced. Patients who underwent CMR had higher levels of anxiety than those who underwent MPS (Paper IV) ... 46
Comparisons immediately after the examinations ... 46
Comparison of image quality ... 48
DISCUSSION ... 49
General discussion ... 51
Image quality ... 51
Measurement accuracy... 52
Development of MRI-AQ ... 53
Extended video information... 53
Clinical implications and future studies ... 55
CONCLUSION ... 57 SAMMANFATTNING ... 59 ACKNOWLEDGEMENTS ... 63 REFERENCES ... 65 APPENDIX I ... 73 APPENDIX II ... 74
ABSTRACT
Background: Non-invasive diagnostic imaging of atherosclerotic coronary artery disease (CAD) is frequently carried out with cardiovascular magnetic resonance imaging (CMR) or myocardial perfusion single photon emission computed tomography (MPS). CMR is the gold standard for the evaluation of scar after myocardial infarction and MPS the clinical gold standard for ischemia. Magnetic Resonance Imaging (MRI) is at times difficult for patients and may induce anxiety while patient experience of MPS is largely unknown. Aims: To evaluate image quality in CMR with respect to the sequences employed, the influence of atrial fibrillation, myocardial perfusion and the impact of patient information. Further, to study patient experience in relation to MRI with the goal of improving the care of these patients.
Method: Four study designs have been used. In paper I, experimental cross-over, paper (II) experimental controlled clinical trial, paper (III) psychometric cross-sectional study and paper (IV) prospective intervention study. A total of 475 patients ≥ 18 years with primarily cardiac problems (I-IV) except for those referred for MRI of the spine (III) were included in the four studies.
Result: In patients (n=20) with atrial fibrillation, a single shot steady state free precession (SS-SSFP) sequence showed significantly better image quality than the standard segmented inversion recovery fast gradient echo (IR-FGRE) sequence (I). In first-pass perfusion imaging the gradient echo-echo planar imaging sequence (GRE-EPI) (n=30) had lower signal-to-noise and contrast– to-noise ratios than the steady state free precession sequence (SSFP) (n=30) but displayed a higher correlation with the MPS results, evaluated both qualitatively and quantitatively (II). The MRI-Anxiety Questionnaire (MRI-AQ) was validated on patients, referred for MRI of either the spine (n=193) or the heart (n=54). The final instrument had 15 items divided in two factors regarding Anxiety and Relaxation. The instrument was found to have satisfactory psychometric properties (III). Patients who prior CMR viewed an information video scored significantly (lower) better in the factor Relaxation, than those who received standard information. Patients who underwent MPS scored lower on both factors, Anxiety and Relaxation. The extra video information had no effect on CMR image quality (IV).
Conclusion: Single shot imaging in atrial fibrillation produced images with less artefact than a segmented sequence. In first-pass perfusion imaging, the sequence GRE-EPI was superior to SSFP. A questionnaire depicting anxiety during MRI showed that video information prior to imaging helped patients relax but did not result in an improvement in image quality.
LIST OF PAPERS
Rosendahl L, Ahlander BM, Bjorklund PG, Blomstrand P, Brudin L, Engvall JE: Image quality and myocardial scar size determined with magnetic resonance imaging in patients with permanent atrial fibrillation: a comparison of two imaging protocols. Clin Physiol Funct Imaging. 2010 Mar;30(2):122-9. doi: 10.1111/j.1475-097X.2009.00914.x. Epub 2009 Dec 23.
Ahlander BM, Maret E, Brudin L, Starck SA, Engvall J: An echo-planar imaging sequence is superior to a steady-state free precession sequence for visual as well as quantitative assessment of cardiac magnetic resonance stress perfusion. Clin Physiol Funct Imaging. Jul 4. doi: 10.1111/cpf.12267. [Epub ahead of print]
Ahlander BM, Arestedt K, Engvall J, Maret E, Ericsson E: Development and validation of a questionnaire evaluating patient anxiety during Magnetic Resonance Imaging: the Magnetic Resonance Imaging-Anxiety Questionnaire (MRI-AQ). J Adv Nurs. 2016 Jun;72(6):1368-80. doi: 10.1111/jan.12917. Epub 2016 Feb 18.
Ahlander BM, Engvall J, Maret E, Ericsson E: Video information prior to cardiovascular magnetic resonance improves patient experience which still remains more challenging than in myocardial perfusion scintigraphy. Submitted.
ABBREVIATIONS
ANOVA Analysis Of VarianceBSA Body Surface Area
CABG Coronary Artery Bypass Graft CAD Coronary Artery Disease CAQ Cardiac Anxiety Questionnaire CMR Cardiovascular Magnetic Resonance CNR Contrast-to-Noise Ratio
CVI Content Validity Index ECG ElectroCardioGram Echo Echocardiography FLASH Fast Low Angle Shot
Gd Gadolinium
GFR Glomerular Filtration Rate
GRAPPA Generalized Autocalibrating Partially Parallel Acquisitions GRE-EPI Gradient Echo-Echo Planar Imaging
HAD Hospital Anxiety and Depression scale ICA Invasive Coronary Angiography IR Inversion Recovery
IR-FGRE Inversion Recovery -Fast Gradient echo sequence IQR Interquartile range
LDL Low-Density-Lipoprotein LGE Late Gadolinium Enhancement LV Left Ventricle
LVEDV Left Ventricular end Diastolic Volume LVEF Left Ventricle Ejection Fraction
m mean
med median
MI Myocardial Infarction MHz MegaHertz
MPS Myocardial Perfusion SPECT MRI Magnetic Resonance Imaging
MRI-AQ Magnetic Resonance Imaging- Anxiety Questionnaire MRI-FSS Magnetic Resonance Imaging -Fear Survey Schedule
PCI Percutaneous Coronary Intervention PET Positron Emission Tomography PMT Photomultiplier Tubes
ROI Region of Interest SD Standard Deviation SENSE Sensitivity Encoding SI Signal Intensity SNR Signal-to-Noise Ratio
SPECT Single Photon Emission Computed Tomography SSFP Steady State Free Precession
SS-SSFP Single Shot Steady State Free Precession STAI-S Spielberg State Anxiety Index – State
T Tesla
INTRODUCTION
Magnetic Resonance Imaging (MRI) is a complicated medical imaging technique [1]. It is useful in a wide range of conditions, such as in cardiovascular investigations, where the ability to investigate tissue characterization can be fully exploited. Technical developments have produced advanced scanners and a large number of sequences to use. The manufacturers propose ways they perceive to be the most successful in building sequences. However, we need to evaluate the performance of each sequence in the clinical setting. New sequences have to be critically evaluated with the patient’s best interest in mind.
Being a patient is always associated with distress and anxiety. High technology environments, such as an MRI suite, could be experienced as threatening and alienate the patient from the staff [2]. The patients are left alone in the scanner with the operating staff in an adjacent room. Patients may feel abandoned when the staff is fully focused on running the imaging equipment. This may result in sub-standard care [3].
Cardiovascular disease is the most common cause of death in Europe [4]. Having a cardiac condition is frequently perceived to be life-threatening and may create a state of anxiety in patients [5]. The combination of undergoing a cardiovascular magnetic resonance (CMR) imaging procedure and having a potential life-threatening cardiac disease, may add to the state of anxiety.
Information frequently reduces anxiety [6], but the scope of information required differs among patients. Some need details while others prefer a superficial orientation. Patient information should be given in plain language that is easy to understand for everyone [7].
BACKGROUND
Ischemic Heart Disease
Atherosclerosis
Atherosclerotic coronary artery disease (CAD) includes a broad spectrum of conditions from asymptomatic atherosclerosis to myocardial infarction (MI) and sudden death. It is characterized by fibrotic thickening of the intima associated with lipid infiltrated plaque seen in large and medium sized arteries [8]. Inflammatory and immune cells are an important part of the plaque. The atheromatous plaque is preceded by fatty streaks mostly consisting of macrophages and some T-cells [9].
Atherosclerosis begins in childhood and slowly progresses over time [10]. Acceleration of disease, causing premature manifestations, can be induced by hereditary as well as environmental factors [11]. The general heritability of CAD is difficult to prove because of the complex interaction between heredity and environment. However, an early onset of CAD in first degree relatives is significantly associated with and predicts early onset of CAD [12]. The penetrance of hereditary factors in CAD is in the range 40-60 % [13, 14]. The risk increases with higher numbers of first degree relatives with CAD and with manifestations at an early age [15, 16]. The genetic basis for CAD is thought to be derived from small cumulative effects of multiple common risks factors rather than a single dominant factor [17].
Some risk factors are defined to be independent from heredity: Cigarette smoking, hypertension, unfavourable levels of blood cholesterol, diabetes mellitus and advancing age [8, 18]. An additional related risk factor is obesity, particularly if abdominal. Only 15%-20% of all patients with CAD lack any of those risk factors [19]. Post-menopausal women run a higher risk of CAD than pre-menopausal ones. Women presenting with CAD are generally older than men [8]. Physiological factors are also shown to increase the risk for CAD [20]. Ischemia
Ischemia is defined as an imbalance between oxygen demand and supply. Plaques of the arterial vessel wall accumulate gradually and their presence induces remodelling of the arterial wall with gradual reduction of the vessel lumen. A decrease in resting blood flow is not seen until an 85% reduction in vessel area is reached [21]. Most patients that seek attention because of chest pain of possible cardiac origin experience symptoms during physical or mental stress. Tests for the detection of coronary stenoses have to be built on either physical exercise inducing ischemia, pharmacological vasodilatation inducing uneven myocardial perfusion or direct visualization of the coronary lumen.
During exercise, oxygen demand increases three to four times compared with at rest [22] but in areas supplied by vessels with ≥ 50% stenosis the arteriolar bed is already maximally dilated and blood flow cannot increase. Potentially hypoperfused myocardium distal to a stenosis can be identified after flow redistribution induced by vasodilators [23], or by an increase in oxygen demand by an infusion of dobutamine [24].
Non-invasive examinations of patients with suspected CAD are performed at rest and during stress and are selected to imitate the situations when patients have angina. Stress is induced with exercise if the patient is able to reach an acceptable workload, ≥ 85 % of their age-predicted maximum heart rate [25]. Otherwise, pharmacological agents are used. Echocardiography (Echo) has the possibility to visualize global and local dysfunction as a result of ischemia but more or less requires the use of dobutamine as a stressor to avoid respiratory motion caused by exercise [26]. Myocardial perfusion single photon emission computed tomography (MPS) and CMR use vasodilators such as Adenosine and Regadenoson as pharmacological agents, if exercise is impossible [25, 27, 28]. If the pretest probability of ischemia is low, investigations start with exercise electrocardiography (ECG). If a secondary test is necessary, local availability determines whether dobutamine stress Echo or myocardial perfusion SPECT is selected. If the pretest probability is low and the patient is unable to exercise, coronary CT may be considered. Invasive coronary angiography (ICA) is appropriate when the probability for ischemia is high, which is likely when patients have symptoms and an abnormal ECG [29].
Myocardial Infarction
Myocardial infarction is defined as cardiomyocyte death caused by an ischemic insult [29, 30]. A diagnosis of MI is dependent on the sensitivity and specificity of clinical criteria, biomarkers such as troponin and imaging studies. Infarct criteria according to guidelines have changed over time due to increasing sensitivity of biomarker analyses, e.g., troponins, which has increased the number of patients diagnosed with myocardial infarction [29].
In the atheromatous plaque, oxidized low-density-lipoprotein (LDL) is taken up by macrophages, forming foam cells. As atheromas age, T cells and macrophages infiltrate and as the plaque matures, a fibrotic cap develops. The plaque is prone to rupture in areas where the cap is thin and the underlying part of the plaque is infiltrated by foam cells. It is usually the rupture that triggers an occluding thrombus on the surface of the plaque, blocking blood flow [8, 30, 31].
Magnetic Resonance Imaging
Spin and magnetizationClinical MRI uses physical characteristics of the hydrogen atom (1H) for imaging.
Positively charged hydrogen protons spin around their axis. The protons act like small magnets and are randomly oriented in space, ordinarily neutralizing local magnetic fields. When positioned in a strong magnetic field (B0), the magnetic
property of the protons are slightly more oriented in the direction of the field, giving a net magnetization vector parallel to the field. In addition to this, the magnetization vector will precess around its axis [32].
Excitation
A radio frequency pulse (RF) forces the magnetization to rotate away in a plane perpendicular to the magnetic field (excitation) [32]. The Larmor equation defines the frequency with which the protons precess, which is the frequency the RF pulse needs for excitation. This frequency can be calculated as a constant times the magnetic field strength. The constant is called the gyromagnetic ratio and is, for hydrogen protons, 42.6 megahertz per tesla (MHz/T). For a 1.5 tesla (T) scanner the frequency will be 42.6 x 1.5 = 63.9 MHz. The amount of deviation from the basic field (flip angle) depends on the strength and duration of the RF-pulse. If the magnetization is rotated to the transversal plane the RF-pulse is called a 90◦ pulse [33, 34].
Slice selection is achieved by using a gradient coil that slightly changes the field in the slice direction. The protons affected by the gradient field will then have different Larmor frequencies. Since only protons with a frequency according to the Larmor frequency can be excited, an RF-pulse with a specific frequency will be able to excite only the selected slice [35].
When the RF-pulse is turned off, the magnetization continues to precess [32], producing an electromagnetic signal which can be detected by a receiver coil. The signal from the slice is, with orthogonal gradients, encoded in two directions, frequency and phase. The signal is collected in k-space and translated to a physical image by the Fourier transform [33, 34, 36].
Relaxation
When the magnetization vector has the direction of the magnetic field B0, the
magnetization is said to be longitudinal. Transversal magnetization occurs when the net magnetization is rotated from the longitudinal plane by an RF-pulse. Immediately after the RF-pulse is turned off, the magnetization starts to recover into the longitudinal plane [32]. This is the longitudinal or T1 relaxation. T1 is defined as the time it takes for the magnetization, after a 90◦ RF-pulse, to recover to 63% of its equilibrium value in the longitudinal direction. After the 90◦ RF- pulse the magnetization not only recovers in the longitudinal plane, but due to fluctuating magnetic field variation in tissue, protons will experience slightly
different magnetic field and fall out of phase in the transversal plane. This is called transversal or T2 relaxation. T2 is defined as the time it takes after the 90◦ RF -pulse for the transversal relaxation to drop to 37% of its initial value [33, 34, 37].
In T1-weighted images, tissue with long T1 will display a low signal and tissue with short T1 a high signal. When images are T2 weighted, tissue with long T2 will have a high signal and tissue with short T2 a low signal. The proton density weighted images will display a signal that depends on the amount of hydrogen protons present. Tissue with a high signal appears bright on the images and tissue with a low signal is dark [37].
Safety
MRI does not use radiation and is considered safe for the patients as long as there is no contraindication, such as metallic objects in the eyes, shunts and pacemakers that are not MRI compatible [37, 38]. Gadolinium (Gd) is the preferred external contrast agent used for intravenous injection. Gd is paramagnetic and causes small local magnetic fields that shorten the relaxation time of surrounding protons. In T1-weighted images, contrast enhancement is seen as a higher signal, bright on the image [39]. The use of Gd contrast media has been associated with nephrogenic systemic fibrosis (NSF) in patients with renal failure [40]. To avoid this potential complication, use of contrast media should in general be avoided if the Glomerular Filtration Rate (GFR) is lower than 30 ml min-1 per 1.73 m2 [41].
The GFR may be estimated from different equations related to S-creatinine and body surface area (BSA), or use calculations based on cystatin-C. The one most commonly used is the one proposed by McIntosch et al. 1928, who found a correlation between GFR and BSA, and that BSA could be normalized to 1.73m2
[42]. For calculation of GFR, the program OmniVis® (GE Healthcare) can be used [43]. OmniVis equations use plasma (serum)-creatinine (P-crea) (expressed in μmol/L), age (in years), weight (kg), height (cm) and gender. Two equations can be calculated with OmniVis, the Lund-Malmö and the Cockcroft-Gault equations [44].
Cardiovascular Magnetic Resonance
Motion compensationCardiovascular magnetic resonance sequences have to be compensated for respiratory and cardiac motion. In order to avoid respiratory motion most sequences are recorded during breath hold, with a duration of 10 to 20s. Alternatively, a navigator is used, which enables recording during free breathing [45]. Breath holding is often preferred to save time, compared with free breathing acquisitions.
To compensate for cardiac motion, measurements are ECG gated [46]. The signal from the ECG enables triggering on the R-wave and the selection of the time delay for image collection. Most cardiac images are recorded in diastole, when the motion from the heart is minimal. Functional series (cine-loops) are recorded at several time points during the entire R-R interval [45, 47].
Data sampling and acceleration
In order to obtain an image with high signal to noise ratio (SNR), defined as the Signal Intensity (SI)/noise, k-space is sampled during several R-R intervals. Each R-wave is followed by several excitation pulses, where each pulse encodes one line in k-space. The length of the sequence depends on how many lines in k-space are filled from each heart heartbeat and the heart rhythm of the patient. This kind of sequence is often denoted as “segmented acquisition” [48].
In patients with regular heart rhythm and successful breath holding, an image with excellent quality can be produced. Arrhythmia or difficulties holding breath result in images with, at times, extensive artefacts [49]. Such problems may be circumvented by the use of single-shot sequences. In those sequences, k-space is sampled in one R-R interval.
In functional examinations and dynamic events where contrast changes over time, high spatial and temporal resolution is necessary. Fast sequences can be used, such as Turbo fast low angle shot (Flash), Steady-state free precession (SSFP) and Echo Planar Imaging (EPI). High SNR and contrast to noise (CNR) (calculated as the SIdifference between two regions/noise) favours cine SSFP for the acquisition of volumes and wall motion in CMR [50, 51]. One additional technique to decrease scan time may be to sample a reduced data set in phase. Undersampling data in phase may produce aliasing in the final images [52]. These artefacts have to be minimized and images recovered. In parallel imaging, reconstructions are made from separate coil elements in a phased array coil, where every coil element is more sensitive to the nearest volume of tissue. Knowledge about the element sensitivity makes it possible to combine undersampled data from each receiver coil into a reconstructed image minimizing artefacts [37]. The two most common techniques are reconstruction in either k-space with Generalized Autocalibrating Partially Parallel Aquisition (GRAPPA), or in the image domain with the Sensitivity Encoding (SENSE) technique [36, 37]. Data can also be shared in time where temporal interpolation estimates missing data, based on its value in both the past and in the future. It is also possible to use both spatial and temporal acceleration. A missing data point can be recovered from surrounding data points in both k-space and/or time points [36, 53].
Diagnostic methods
In one single scheduled appointment, CMR may assess morphology, function, myocardial tissue characterization and myocardial perfusion [54].
Reproducibility is high [55], which make CMR suitable for follow-up studies. In patients with ischemic heart disease, several aspects related to the ischemic cascade may be observed with CMR [50].
First-pass perfusion may be studied during pharmacological stress to uncover a delay of contrast wash-in with the blood that enters the coronary arteries. Images are recorded during peak stress, most often after three min of Adenosine infusion, and at rest. Areas with high perfusion display contrast enhancement and have a high signal, while areas with delayed or low perfusion have a low signal and appear dark [56, 57]. Sensitivity and specificity has been shown to be in the range 91-94%/ 81-88% [28].
Cine images can detect myocardial dysfunction in terms of regional and global wall motion abnormalities [50]. Cine (dynamic) images visualize motion of the heart. The beating heart is visualized when data from the same slice position are acquired at different time points during the R-R interval. For sufficient filling of k-space, several heartbeats are required. Multiple lines in separate images (different space) are sampled during each heartbeat. This continues until the k-space is sufficiently filled. For the detection of wall motion abnormalities a frame-rate of at least 25 times per heartbeat has to be sampled.
Late gadolinium enhancement (LGE) technique visualizes myocardial injury, following MI or as a consequence of previous inflammation [50, 58, 59]. The Gd contrast medium accumulates in the extracellular space. In fibrotic non-viable myocardium, the extracellular volume increases and the contrast accumulates and washes out slowly [58, 60]. About ten min after contrast injection, an inversion recovery (IR) sequence is used to detect remaining contrast in the myocardium. In an infarcted area (scar), contrast media enhances the signal. Healthy myocardium has a low signal, if the correct IR-time is chosen [61, 62]. In patients with myocardial infarction, the LGE sequence predicts the success of revascularization, since recovery of function is most often seen in those who display a small area of LGE positivity, while an extensive scar is seen in patients who do not improve in myocardial function after revascularization [63, 64].
The CMR-examination
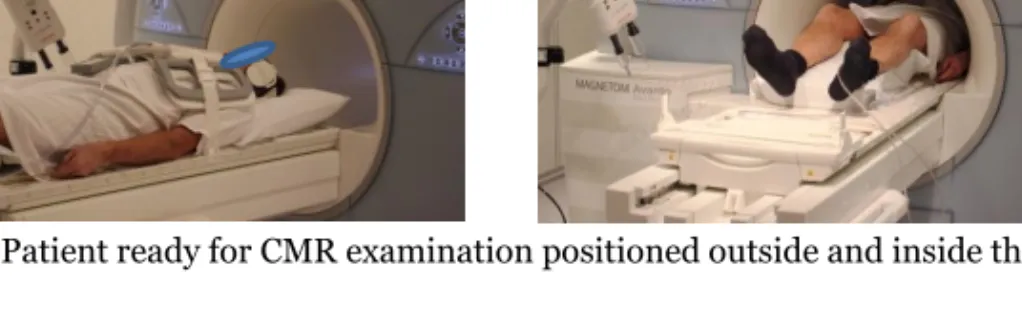
During CMR examination, the patient is placed in supine position and prepared with ECG (for heart triggering), a percutaneous vein catheter (if contrast media is needed), and a coil covering the chest (for the detection of the electromagnetic signal from precessing hydrogen protons). Patients wear earmuffs to protect hearing and are equipped with intercom to enable instructions from the radiographer/nurse. By using a hand-held alarm, the patients can signal discomfort. During the examination, the patient is positioned in the scanner with the heart in iso-centre (Figure 1). The diameter of the bore is often between 60-70 cm.
Figure 1. Patient ready for CMR examination positioned outside and inside the camera.
Image quality
High image quality improves the diagnostic accuracy of all radiological procedures [65]. Images with a high quality have been recorded without artefacts, include the area of interest in the field of view (FOV) and have a high SNR. Since some noise is always present, it is important to increase the signal in order to minimize the effect of the noise [37].
Artefacts directly related to motion are frequently seen during CMR examinations, since breath holding is difficult and ECG-triggering challenging when the heartbeat is irregular [52, 66]. In MRI, physical constraints require compromises. As an example, signal intensity depends on the size of the image voxel. Consequently, when resolution increases, signal and SNR will decrease. Single-shot sequences sample the entire image during one heartbeat [67]. Those sequences are less sensitive to motion artefacts, but fast acquisition will always pay a price in terms of a lower SNR due to physical constraints [37]. It is debated whether single-shot sequences provide sufficient image quality to allow diagnostic evaluation.
One source of motion artefacts is restlessness due to anxiety. Törnqvist et al. found that written information had a positive impact on image quality [68]. We hypothesized this could be interesting to study in patients undergoing a demanding examination such as CMR.
In perfusion imaging, the dark rim artefact creates difficulties in the interpretation of perfusion reduction. It is recognized as a dark subendocardial band which sometimes can be mistaken for ischemia. Different theories have been invoked to explain the mechanism behind this important artefact, among them Gibb´s ringing [69], signal variation during measurement [70], cardiac motion [71] and susceptibility from contrast enhancement [72]. Myocardial perfusion can be investigated with different kinds of sequences, but consensus is lacking on which to prefer [73, 74]. All have drawbacks, such as artefacts, low SNR or not being fast enough.
The quality of CMR images can be assessed qualitatively and quantitatively [65]. Cine SSFP images, LGE images and perfusion images are evaluated separately
based on the knowledge about the different sequences’ most common artefacts. Several rating scales can be used for quality criteria, such as the presence of wrap around, respiratory ghosting, the precision of the delineation of non-infarcted and infarcted myocardium, the occurrence of artefacts and an overall evaluation of the image quality of the left ventricle, In addition, the quantitative parameters SI, SNR and CNR can be used [65, 75].
Single photon emission computed tomography
Myocardial Perfusion SPECTSingle photon emission computed tomography (SPECT) of the heart is frequently called myocardial perfusion SPECT (MPS). MPS is non-invasive and has a sensitivity of 70%-80% and specificity of 60%-90 % for the detection of coronary artery disease [22, 76]. A homogeneous myocardial uptake indicates normal myocardium [22, 77]. When MPS is performed with ECG-gating, evaluation of heart function in terms of volume and ejection fraction is possible [78]. Assessing wall motion also helps in the discrimination between artefacts and true perfusion deficits [76].
Tracers
Gamma-emitting radionuclide tracers are injected in the patient. For MPS imaging, thallium-201 (201TI) or technetium-99m (99mTc) can be used [22, 25].
About 4% of the injected activity of 201TI is taken up in the myocardium.
Thallium-201 is taken up by the myocytes, depending on a functioning sodium/potassium ATPase sarcolemmal membrane transport pump [79, 80]. It redistributes, thus allowing redistribution images to be acquired. In those images, regions of ischemic but viable myocardium will have the same uptake as normal myocardium. Areas with non-viable myocardium, that initially showed reduced uptake, will remain unchanged. The presence of redistribution allows the examination to be performed as a stress-rest study with one single injection. A major limitation for 201TI is the long half-life (73 hours), which gives the patient a
relatively high absorbed radiation dose [22].
In Europe, 99mTc is the most commonly used tracer. In order for 99mTc to be
detected in the heart, it has to be bound to a tracer molecule, either sestamibi or tetrofosmin. 99mTc has a rather short halflife of six hours, which reduces radiation
exposure compared to thallium, but still allows imaging to be performed. About 1.2 % of the dose is taken up by the myocardium [81]. Redistribution is low and for detection of viable/non-viable myocardium, stress-rest studies with separate injections have to be performed [22]. In order to reduce the radiation dose given to the patient, the rest part of the study is frequently omitted when the stress study is completely normal. In such a situation, a study at rest will not contribute to the final diagnosis.
Gamma camera
For imaging, a gamma camera is used. In a gamma camera the gamma or x-ray photons from the radio nuclide interact with a sodium-iodine crystal. When the photon interacts with the crystal a light photon is emitted, proportional to the incoming photon energy. This energy is for 201TI 68-80 keV and for 99mTc 140keV.
The light is registered and converted to electrical signals, also proportional to the photon energy, by an array of photomultiplier tubes (PMT). The PMT localizes where the photons hit the crystal and an image that projects the distribution of the tracer in an object can be acquired [82, 83].
To obtain an image of high quality and high resolution, a collimator consisting of a thick sheet of lead with thousands of tiny holes is used. These allow only photons parallel to the collimator holes to reach the crystal. The sensitivity and the resolution of the images depend on the diameter of the holes and the thickness of the septa and the collimator. For each photon the energy is measured and only photons within the selected energy interval (energy window) is accepted. In this way, scattered photons are removed and only photons within the energy window contribute to the images [82, 83].
Examination
If patients are able to exercise to a high workload, which is usually defined as ≥ 85% of the age predicted maximum heart rate, European guidelines support dynamic exercise as the choice of stressor and the radiopharmaceutical is injected close to the peak exercise [81]. In patients who cannot exercise to the 85% peak heart rate limit or who are unable to exercise for other reasons, a pharmacological stressor is used. Adenosine (140 µg min/kg body weight) is infused over 6 min and the radiopharmaceutical is injected after three min [81]. Regadenoson (400µg) is injected over 10 sec and the radiopharmaceutical 10 sec later [84].
After the injection of 201TI patients wait for 5-10 minutes before scanning, which
should be completed within 30 min. When 99mTc is used, imaging should begin
within 30-60 min after the injection. If the study is found to be normal, there is no need to acquire perfusion images at rest. During scanning the patient is mostly in supine position with arms elevated. An ECG is applied for gating [25].
MPS is not known to induce anxiety, but very little is known about what patients experience while undergoing this examination [1, 85].
Well-being in the context of MRI
As many other radiologic examinations, MRI requires the full cooperation of the patient. MRI examinations are non-invasive and painless, but can nevertheless be demanding for the patient. In a radiographer survey, 72% stated that it was common that patients expressed anxiety at their MRI center [86]. During the exam, the patient is positioned in the scanner which is shaped as a tunnel in
order to produce the best homogeneity of the magnetic field. The examined body part has to be positioned in the iso-centre of the scanner where the magnetic field has the best homogeneity [37]. The narrow tunnel is known to create problems such as nervousness, anxiety, claustrophobic feelings and uncontrolled panic in some patients [1, 87-92]. The experience of claustrophobic feelings during the MRI examination may later be generalized to other enclosed situations [90]. Due to the stressful situation, 25%-30% of patients complain about anxiety [88, 90], and up to 15% of all patients experience such a high level of anxiety that pharmacological sedation is necessary to conclude a successful examination [87]. During the examination a loud noise is heard, caused by vibrations of the gradient coils. To protect patient hearing, ear muffs that enable instruction and communication between the staff and the patient via intercom are used [37]. The loud noise, an experience of losing control, and the duration of the examination contribute to the feeling of anxiety [93, 94], as well as fear of pain, the “unknown” and worry about the result [88, 95]. In addition to the circumstances mentioned above, CMR examinations are time-consuming and may last for 45-60 min. The patient needs to remain in position on the scanner table for the entire examination and participate in breath holding up to 50-60 times [45].
Severe anxiety during MRI examinations may cause patient motion, resulting in motion artefacts [68] that decrease the diagnostic value. Studies have tried to predict patient reactions during examination [87, 96], but very few have asked the patients about their experience [94]. Even if manufactures have tried to improve the scanning environment, e.g., by increasing the diameter and shortening the length of the tunnel [87, 97], problems still remain and need attention [86, 94, 98].
Anxiety
Anxiety is an emotion characterized by feelings of tension, worried thoughts and physical changes [99]. Barlow has described the central experience of anxiety as a sense of uncontrollability, largely focusing on future threats, danger, or upcoming potentially negative events. It can be characterized as a state of helplessness, because of a perceived inability to control desired results or outcomes in certain personally salient situations or contexts [100]. This feeling of uncontrollability can act as a mediator between negative events in life and anxiety [100]. This is very much like the situation patients are in. They do not know what will happen to them, questions can arise, such as: am I ill, what will happen, what kind of examinations are required, will the staff treat me well, what will the result be, is it serious? Their future is in a way out of control.
Some medical conditions are known to be associated with anxiety, like CAD. Anxiety itself increases the risk for CAD [101] and manifest CAD increases the risk of anxiety [102]. Anxiety can also be experienced in situations representing earlier trauma in life, for example being locked in. The patients try to cope with
previous trauma but have a chronic inability to do so [100]. “Locked in” is a common feeling during MRI examinations.
Spielberger separated anxiety into two parts: trait anxiety as a chronic personal characteristic and state anxiety as an emotional condition varying from day to day. People with high trait anxiety more often experience higher state anxiety [103]. Even if the correlation between state and trait anxiety is high [104], there is a difference. People without anxiety in ordinary life can feel anxiety in situations when they experience a threat [103].
Anxiety disorders are among the most prevalent psychiatric disorders. The 12- month prevalence for men is 7.8% and for women 16.3 % [105]. The burden is heavy, both for the individual and for society. Symptoms of anxiety can at times be mild, with an onset associated with stressful situations in life and improving without specific treatment [106], to a full-blown chronic disabling disease. Several instruments are used to measure anxiety, for example: Competitive State Anxiety Inventory (CSAI) [107], Spielberger State and Trait Anxiety Inventory (STAI-S and STAI-T) [103], and the Hospital Anxiety and Depression scale (HAD) [108]. These instruments measure general anxiety, but sometimes we want to measure what Spielberg refers to as “state anxiety”, e. g., when being in an MRI scanner. This situation is known to be anxiety ridden [1, 87-92] for some patients, but instruments that measure the experience and feelings during examinations are lacking.
How to psychologically prepare the patient for the MRI study
Information about the scanning procedure tries to avoid or reduce stress and anxiety during the examination [6, 109]. Prior to a scan, many, but not all, patients feel a need for extended information [1]. In a previous study, 71% wanted additional information about their examination [109]. Information requested by patients before MRI concerned the narrow environment, the loud noise and the duration of the examination, which is substantially longer than other radiological examinations [95]. There is a relation between the patient’s understanding and compliance, where well-informed patients follow instructions better [7]. There is also a positive correlation between information given and patient satisfaction [7, 110]. In this situation, the way information is given and received is crucial. All patients do not understand the purpose of information since they may have difficulties understanding and remembering [7, 111]. Guidelines cannot foresee all situations in which communication is necessary. To improve patient understanding, information has to be easy to understand by using simple language without medical terminology [7, 112]. Information is important and the experience of undergoing a high-technology imaging procedure produces a unique experience for each patient. Myths and stories can have a negative effect [113, 114], and bad experiences can have a negative effect on future examinations [115].
Some studies have evaluated the use of extended information and support during MRI examinations. Detailed information by a radiologist (10 min) or psychologist (45 min) before examination resulted in less anxiety compared to patients who received standard information [116, 117]. Extended written information has shown various results in patients undergoing MRI, with both significantly lower anxiety in the group who received designed instructions before MRI compared with the one who received standard information [110], but also no difference [68]. Even if no difference was detected between groups in the feeling of anxiety, there was less motion artefact in the images of the patients in the experimental group [68]. One study suggest that the effect of oral information can be detected in the plasma levels of cortisol and prolactin as well as the level of anxiety measured with questionnaires [98].
Video information has been used pre-surgery to reduce preoperative anxiety and postoperative morbidity with positive results. Lower anxiety levels have been measured in patients who received video information compared with control groups [118-120]. Some patients benefited from a lower level of anxiety up to one year after bypass surgery [120]. Even cortisol excretion was found to be lower in the experimental group after video information, compared with the control group in patients undergoing hip replacement surgery [118].
It is known that MRI can cause intense anxiety in some patients [1, 87-92]. Extended written information has not shown univocal results. Video information before surgery has resulted in decreased anxiety. An important question to answer is if the use of video information could contribute to a better experience for this group of patients.
Rationale
Cardiovascular disease is the most common cause of death in Europe [4]. With a growing and ageing population, and an increasing prevalence of obesity and diabetes, the number of patients with cardiovascular disease is expected to increase further [121]. For an optimal result of medical treatment, early diagnosis is of great importance. In addition to patient history, various imaging methods such as CMR can be used for diagnosing symptoms, as well as for screening those with a high cardiovascular risk. With an increasing number of patients, there is a risk that the time given to each patient decreases. Still, the patients have to be treated and examined in an optimal way. They have to be well informed which gives them the possibility to know what is expected of them and how to cooperate. During examination, the correct sequences have to be chosen based on the patient’s possibilities, in order to optimize the diagnostic properties. These sequences have to be evaluated and one way to overcome the need for experienced readers is to use quantitative evaluations when possible.
AIMS
The overarching aim of this thesis was to evaluate image quality in cardiac MRI with respect to the sequences employed and the influence of atrial fibrillation, myocardial perfusion and the impact of patient information on measured anxiety.
to study patients in relation to magnetic resonance imaging with the goal of improving their care
The specific aims of the studies were as follows Paper I
to assess differences in image quality and estimated infarct size between two MRI scar sequences IR-FGRE (segmented) and SS-SSFP (single-shot), in patients with chronic myocardial infarction and difficult-to-image permanent atrial fibrillation.
Paper II
to study two CMR first-pass perfusion sequences, GRE-EPI (gradient echo-echo planar imaging) and SSFP (steady state free precession) in terms of image quality and final diagnosis, with the result from the MPS stress study as reference.
Paper III
to develop and validate a new instrument measuring patient anxiety during Magnetic Resonance Imaging examinations, MRI-AQ (Magnetic Resonance Imaging-Anxiety Questionnaire).
Paper IV
to evaluate the effect of video information given before CMR on patient anxiety.
to study patient experience of CMR and MPS.
METHODS
Design
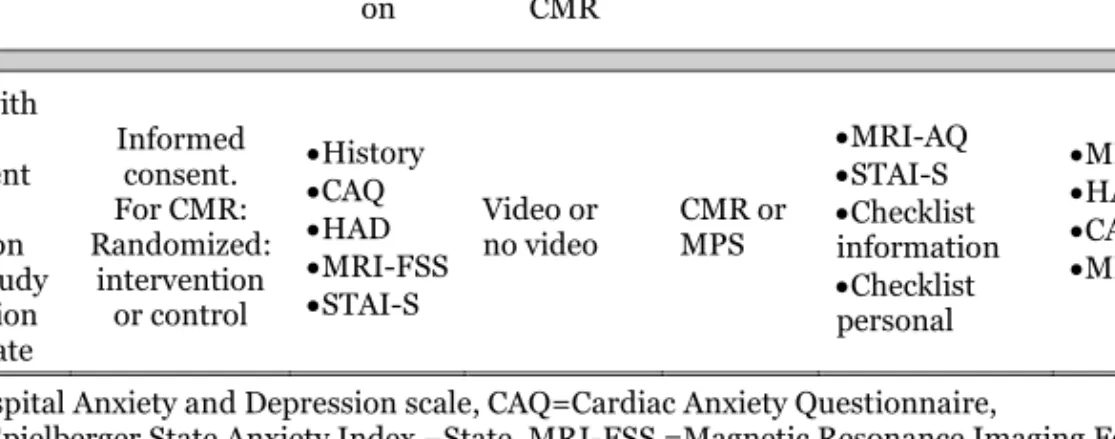
This thesis is based on four publications (I-IV), designed as experimental cross-over (I), experimental controlled clinical trial (II), psychometric cross-sectional (III) and prospective intervention (IV) see table 1.
Participants
This thesis consists of four independent data collections with four different samples of participants and collection times (Table 1). The participants were ≥ 18 years and had primarily cardiac problems except for those referred for MRI of the spine in study III.For inclusion and exclusion criteria in the different studies see table 1. There was no recruitment from the general population.
Study I
Twenty patients, mean age 75 years, with permanent atrial fibrillation and pathological Q-waves on the resting ECG were identified at two medical clinics (Table 1). Additional inclusion criteria were myocardial infarction verified with chest pain, typical serial ECG changes and/or elevated levels of either Troponin T or creatinine kinase MB in at least two blood samples during hospitalization no later than 6 weeks prior to the CMR examination. During the CMR examinations all were in atrial fibrillation. No patients were excluded due to technical failure or poor image quality.
Study II
Sixty patients, mean age 64 years, referred for MPS for myocardial ischemia were included in the study which was collected in two cohorts, separated by time. The ages were similar, but therelative number of men and women differed with 43% and 33% females in the two groups respectively. Thirty patients were investigated with a steady-state free precession (SSFP) sequence and 30 patients were investigated with a gradient echo-echo planar imaging (GRE-EPI) sequence (Table 1). Of the 67 patients originally included one was excluded due to lack of two venous access lines. Four were excluded because of claustrophobic feelings, one for technical reasons and one patient because of arrhythmia.
Study III
Two-hundred and forty-seven patients, mean age 55, referred for MRI of either the spine (n=193) or the heart (n=54) were included in the study. Their ages were similar, but the gender distribution differed, with 63% women in the spine group and 46% women in the heart group.
Eight-hundred and eighty-one patients were asked to participate. Of those, 781 were referred for MRI of the spine and 100 for MRI of the heart. Two hundred and forty-seven patients (28%) accepted to participate and answered the questionnaires. In the spine-group the participation rate was 24% and in the heart-group 54% (Table 1).
Study IV
One-hundred and forty-eight patients, mean age 55 years, from the waiting list referred for either CMR (n=97) or MPS (n=51) were included in the study. Of the 214 patients who were invited to participate, 150 patients accepted, two were prematurely interrupting the examination (one in each CMR group), giving a response rate of 69%. Patients who underwent CMR were randomized to either the intervention (CMR-video n=49) or the control group (CMR-standard n=48). The MPS (n=51) patients were older, mean 64.5 years, than those referred for CMR-standard, mean 49.4 years (p=<0.001). The distribution of gender differed: CMR-standard had 54% female, CMR-video 29% and MPS 27%. The differences were statistically significant, with CMR-standard/CMR-video (p=0.009) and CMR-standard/MPS (p=0.008) (Table 1).
Meth Tabl e 1 . O verv iew of th e se lec ti on of pa ti en ts and m ethod s Stu dy I (n =2 0) Stu dy II (n =60 ) Stu dy III (n =2 47) Stu dy IV (n =1 48) Stu dy de si gn Ex pe rime ntal , cr oss -o ver. Ex pe rime ntal , c on tr ol le d clin ic al tr ia l. Psych ome tr ic c ro ss -sect io na l st ud y w it h test -re test . Pro sp ec ti ve in ter ven ti on . Incl us io n cr it er ia M yoc ar dia l in farct io n a nd a tr ia l fib rill ati on . Pa ti en ts re fe rr ed fo r M PS . Pa ti en ts re fe rr ed fo r M R I o f th e s pin e or th e h ea rt. Pa ti en ts re fe rr ed fo r CM R o r M PS pe rf or me d at re st . In al l CM R ex amin ati on s G d was use d. Ex clusi on cr it er ia Co ntr ain dic ati on a den os in e. Ph ysi cal di sa - bilitie s a ffec ti ng a nx ie ty Ex cluded we re a lso p ati en ts wit h co ntr ain dic ati on s fo r M R I a nd if G d u sed, G FR ≤ 30 . Pa ti en ts w ho we re wh iteou t a bility to c ommun icate or c ould n ot s pe ak a nd r ea d Swedi sh were e xcluded. Ag e in y ea rs a) 75 ±6 60 ±9.3 64 ±1 0.3 55 ± 13. 9 53 ± 15 .7 49.3 ± 15 .3 44.9 ±1 4.4 64 ±8.9 G en der wo me n/me n b) 0/2 0 13/ 17 10 /2 0 12 1/7 2 25 /2 9 14/3 5 26/2 2 14/37 N um be r 20 30 30 193 54 49 48 51 Ex amin ati on CM R wi th IR -FG R E a nd SS - S SFP M PS /S SFP M PS/G R E -EPI sp in e-M R I card ia c-M R I CM R CM R M PS Inte rven ti on CM R -vi deo CM R -st an dard Ye ar co lle ct ed 2004 -2 00 9 2008 -2009 2009 -2 01 1 20 12 -2 01 4 20 15 -2 01 6 a)Mean ± S D . b ) num ber . C M R -st and ard = c ard io vas cu lar magn et ic reso na nc e i mag ing w it h st and ard text -i nfor mat io n. C M R -v id eo= ca rd io vas cu lar magn et ic reso nanc e i ma gi ng wi th v id eo in fo rmat io n in ad di ti on t o st and ard infor mat io n. MP S= myo card ial p erfu sion S PE C T wi th st and ard informa ti on. Gd=G ad ol ini um co nt ras t m ed ia, GFR = Glo me rul us F ilt rat io n R at e.
Data Collection
MRI (I&II)Two scanner types were used: Siemens Magnetom Symphony and Siemens Magnetom Avanto, both operating at 1.5 T field strength and manufactured by Siemens Healthcare, Erlangen, Germany.
The patients were examined in supine position. ECG was used to monitor heart rate and rhythm and for triggering. All patients had a percutaneous vein catheter for contrast injection and in study II they had an additional catheter in the opposite arm for the injection of adenosine. For signal detection a body matrix coil, consisting of several independent coils, was positioned over the patient’s chest. This was used in connection with the spine matrix coils.
Before examination all patients were asked about their age, gender, previous percutaneous coronary intervention (PCI), coronary artery bypass graft (CABG) surgery, and medications.
Study I
Cine images were acquired, using a SSFP sequence, in the apical longaxis, (the two-, three- and four-chamber views) and in short axis view covering the left ventricle (LV). For LGE two sequences were used: the single shot SSFP (SS-SSFP) and the segmented inversion recovery-fast gradient echo (IR-FGRE) sequences. For technical data see table 2. Both LGE sequences were positioned in the same planes as the cine images. LGE images were recorded ten minutes after the injection with 0.2 mmol Gd/kg bodyweight [59], Gadopentate dimeglumine 0.5 mmol/ml (Magnevist, Schering Nordiska AB, Järfälla, Sweden). Images were acquired in end diastole. The SS-SSFP sequence was acquired at the end of expiration and breath holding was not necessary. Both sequences were recorded in all patients. In every other patient the SS-SSFP sequence was acquired first.
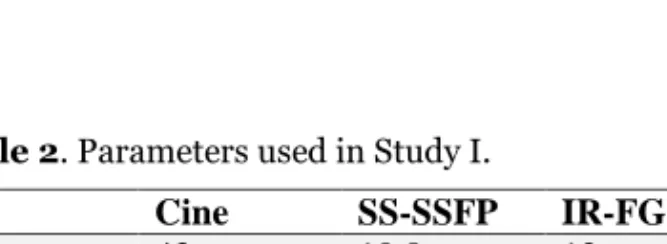
Table 2. Parameters used in Study I.
Cine SS-SSFP IR-FGRE TR 43 ms 10.8 ms 12 ms TE 1.3 ms 1.26 ms 5.4 ms FA 72◦ 50◦ 30◦ BW 930Hz 1180 Hz 140 Hz Slice 8 mm 8 mm 8 mm Matrix 192 x 156 192 x 108 256 x 160
Repetition Time = TR, Echo Time = TE, Flip Angle = FA, Band Width = BW.
Study II
Blood pressure was measured before the examination for baseline reference. For stress perfusion adenosine (140 µg min/kg body weight) was infused after the patients had abstained from caffeine for 24 h [122]. During adenosine infusion patients were placed outside the scanner for observation. After three min adenosine infusion, the radiotracer, 99mTc tetrofosmin, was given (for the MPS
study), followed by 8 ml Gd, Gadopentate dimeglumine 0.5 mmol/ml(Magnevist; Bayer Schering Pharma, Berlin, Germany) at a rate of 4 ml/sec. Under contrast injection three perfusion short axis images, positioned at the base, mid and apex of the LV, were recorded, while the adenosine infusion was running. Thirty of the 60 participants were examined with a SSFP sequence and 30 with a GRE-EPI sequence, and the result was compared with MPS as reference. Technical data are given in table 3. Ten min after stress, perfusion at rest was recorded using the same parameters as for stress. For LGE images a third injection was given aiming at a total dose of 0.2 mmol/ kg bodyweight [59] (max dose 30 ml). Cine images were acquired immediately after contrast injection followed by LGE images approximately 15 minutes after contrast. MPS was performed about 60 min after the injection of the radiotracer.
Table 3. Parameters used in Study II
SSFP GRE-EPI TR 172.7 ms 146.95 ms TE 1.11 ms 1.26 ms FA 40◦ 20◦ BW 1359 Hz 1628 Hz Slice 8 mm 8 mm Matrix 60 x 160 102 x 128
Repetition Time = TR, Echo Time = TE, Flip Angle = FA, Band Width = BW.
MRI analysis (I&II)
Study I
The short axis stack of cine images was segmented in diastole and systole and LV volumes were measured. Infarct size was measured on the LGE short axis images where the papillary muscles were included in the LV size/infarction if they were attached to the myocardium at the particular site.
Visual assessment of the LGE image quality was performed in terms of the delineation of non-infarcted and infarcted myocardium and the presence of motion and other artefacts. Finally, an overall quality score of the left ventricle was assigned. All aspects were evaluated on a five point rating scale with five being the highest score [75]. The rating scale corresponded to the following verbal expressions: “very good”, “good”, “moderate”, “poor” or “very poor”.
Cine images, in short axis view, were evaluated visually in two aspects, one regarding the occurrence of artefacts and the other was an overall evaluation of blurring from irregular displacement of the LV wall. The same five-point rating scale was used with 5 being the highest rating. The quality of the LGE and cine images was evaluated by two observers and averaged. Both observers were blinded to which LGE sequence had been used.
SI, SNR and CNR were determined on images from the LGE sequences, SS-SSFP and IR-FGRE. To calculate SI, regions of interest (ROI) were placed in normal (myo) and infarcted myocardium (inf). A ROI of at least 300 mm2 was used in the
blood pool. Noise was defined as the standard deviation (SD) of the SI measured in the air outside the patient. The SNR was calculated by dividing SI by the noise. The CNR value for the infarcted myocardium compared with the normal myocardium was calculated as (SIinf-SImyo)/noise. The CNR value for infarcted
myocardium compared with the blood in the ventricle was (SIinf-SI blood)/noise.
Study II
The perfusion studies were evaluated qualitatively and semi-quantitatively. A qualitative, visual evaluation was done to assess if there was a delay in the wash-in of contrast medium. If there was a delay at stress but not wash-in the rest images, ischemia was deemed to be the likely cause. If the delay was four beats or less and affected a shallow depth of the LV wall, an artefact was considered to be the cause [123]. Diagnostic confidence was rated on a four-point scale: (1) normal with high confidence, (2) normal with low confidence, (3) pathologic with low confidence and (4) pathologic with high confidence [124]. A qualitative evaluation of first-pass perfusion was performed by an experienced reader of CMR who was blinded to the MPS result. LGE was used to identify scar areas. An LGE-positive segment was always considered pathologic [125, 126] (Figure 2).
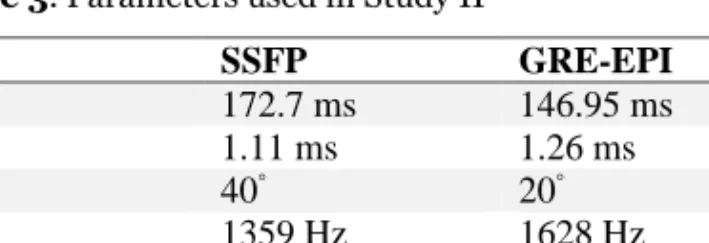
A semi-quantitative analysis was performed to measure the slope of the signal increase in the myocardium during contrast injection using “Argus dynamic signal” from Siemens Healthcare. The three slices were automatically divided into 6 segments each (a total of 18 segments). The epicardium and the endocardium were manually outlined, excluding high signal from blood pool and from epicardial fat surrounding the LV. The slope (wash-in curve) of the inflow signal was calculated between the foot and the peak of the signal intensity curve (Figure 3).
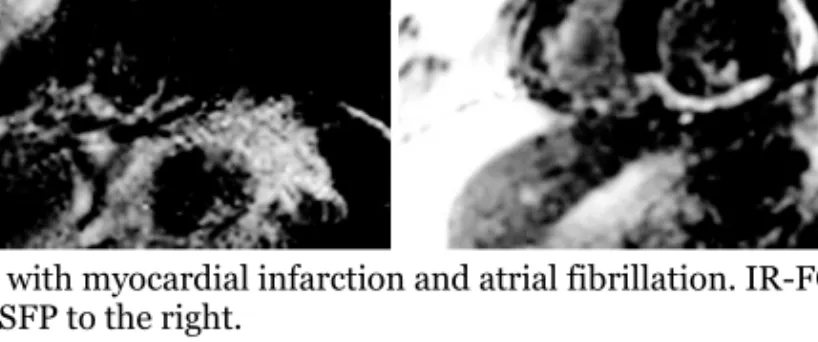
Figure 2. Composite image of two patient studies with ischemia and myocardial scar, SSFP in 1 (upper row) and GRE-EPI in 2 (lower row). Perfusion with SSFP-sequence (1a), anteroseptal scar visualized with LGE-sequence (1b), corresponding MPS image (1c) and contrast wash-in curves (1d). The bloodpool curve was annotated red, a pathologic segment blue and a normal segment green. In the lower row, perfusion is depicted with the GRE-EPI sequence (2a), an inferoseptal scar in 2b, MPS image 2c and wash-in curves 2d, with annotation of the curves in 2d as in 1d. Segment numbers according to SCMR. Scar is indicated by thin arrows and ischemia by thick arrows. In wash-in curves, MRI contrast signal intensity is depicted on the y-axis and time (sec) on the x-axis.
Figure 3. Endocardial and epicardial segmentation (left). Wash-in curves for the blood pool and the 6 segments in one slice (right).
SNR and CNR were calculated in the anterior segment of the basal LV when healthy and in all segments with ischemia, before (lowest signal) and after (highest peak signal) contrast injection. Noise was the SD of SI from air outside
the patient. SNR was calculated as SI/noise. CNR was calculated for the contrast enhanced myocardium during perfusion as signal intensity difference divided with noise (SIMyocard perfusion- SIMyocard baseline)/noise.
MPS (II)
MPS imaging was started 60 minutes after the injection of the radiotracer, 5.7 MBq 99mTc tetrofosmin/kg bodyweight was given i.v. (max 570 MBq ) (Myoview TM, GE Healthcare Medi-Physics, Inc, Arlington Heights, IL, USA). A
dual-detector gamma camera (E. Cam; Siemens Medical System Inc, Hoffman Estates IL, USA) equipped with a high resolution collimator was used. Thirty-two views were acquired in steps of 2.8 degrees per detector. Acquisition time/angle was 30 s. and a 19% window was asymmetrically placed (129-155 keV) on the 140keV peak. A 64 x 64 matrix was used.
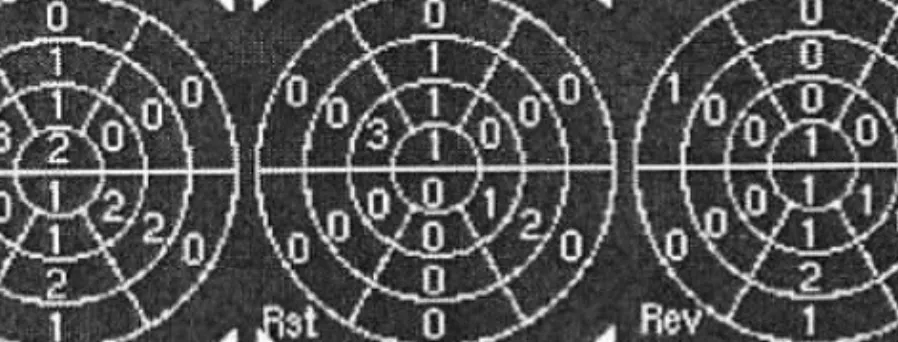
Figure 4. Three schematic images of the heart, during stress (left), at rest (mid) and their difference indicating reversibility (right). Stress scores from QPS software, > 2 is
considered pathological.
Analysis of MPS (II)
Non-gated acquisition files were reconstructed using filtered back-projection, prefiltered with a Butterworth filter (cut-off 0.8 cm-1, order 10), (Hermes Medical
Solution, Stockholm, Sweden). The images were realigned into short axis and long axis presentations. The short axis stack was analysed with QGS-QPS Quantitative Perfusion SPECT (Cedars-Sinai Medical Centre, Los Angeles, CA, USA). Stress perfusion images were divided into 20 segments. The two apical segments were excluded since the apical images are not available on the perfusion CMR. A stress score was given according to reference standard incorporated in the QPS software, being based on segmental differences in signal intensity in a reference population. The scores were: (0) normal, (1) probably normal, (2) probably diseased and (3 and 4) definitely diseased (Figure 4) Visual assessment was performed by an experienced nuclear physician, who was blinded to the CMR-perfusion result, using both stress and rest images.
Measures (III & IV)
Permission was granted by the publisher to use the CAQ and HAD questionnaires. For MRI-FSS and STAI-S, published public versions were used. Cardiac Anxiety Questionnaire (CAQ) (IV)
The CAQ consists of 18 statements divided into three factors assessing heart focused anxiety [127]. The factors are fear (eight statements), avoidance, and attention (five statements each). The statements are rated on a five-point scale, ranging from 0 (“never”) to 4 (“always”), where a higher score indicates more intense heart focused anxiety. The total score ranges from 0 to 72.
Hospital Anxiety and Depression scale (HAD) (III & IV)
The HAD measures general anxiety and depression [108, 128]. It consists of two factors with seven questions about anxiety and seven about depression. Both scales are rated on a four-point scale where a higher score indicates a more intense level of anxiety and depression. The possible score ranges between 0 and 21 for each scale
Magnetic Resonance Imaging Fear Survey Schedule (MRI-FSS) (III & IV) The MRI-FSS consists of nine statements from the Fear Survey Schedule [129], defined by Lukins et al. [130]. These nine statements deal with fear in situations related to MRI examinations and were developed to predict fear during such examinations [96]. Patients rate the statements on a seven-point scale ranging from “no fear at all” to “terrified”. Higher scores predict more intense level of anxiety during the examination. The total score ranges between 9 and 63.
Spielberger State Anxiety Index (STAI) (III & IV)
The STAI consists of two separate scales with 20 items each, measuring state (situational) and trait (baseline) anxiety [103, 131]. In the present study, only the state anxiety scale, which measures the anxiety patients experience at a particular moment, was used, denoted STAI-S. Patients rate their feelings on a four-point scale ranging from ”not at all“ to ”very much“, with a total score range between 20 and 80. High scores imply a more intense level of anxiety
Two study specific questions (III & IV)
In the single item questions the participants were asked to rate their feeling of anxiety and worry during examination. They were rated on visual analogue scale ranging from 1=”very good” to 10=”very bad”.
The staff (III & IV)
Staff was asked about patient sedation and if the patients entered the tunnel head or feet first. They also ranked how they judged patient feelings of anxiety and worry during examination. The staff responses were rated on a visual analogue scale ranging from 1=”very good” to 10=”very bad”, similar to the scale used by the patients.
Magnetic Resonance Imaging Anxiety Questionnaire MRI-AQ (IV)
The MRI-AQ measures anxiety during MRI examinations [132]. It involves 15 items, divided in two factors. One factor is anxiety, consisting of 12 items and one is relaxation, 3 items. The statements are rated on a four-point scale ranging from 1=“not at all” to 4 =“very much”. The score ranges from 15 to 60, where a higher score indicates a higher level of anxiety.
Information (IV)
The patients were asked to rate their impression of the information on a visual analogue scale ranging from 1=”very good” to 10=”very bad”.
Development of Magnetic Resonance Imaging-Anxiety Questionnaire (MRI-AQ)
(III)
Scale development
The first step towards creating an instrument with high validity is to ensure that the correct questions are asked. With permission from the authors [94], 22 items were constructed based on the result of a hermeneutic phenomenological study in which 19 patients were interviewed about their experience during MRI examinations. The 22 items were discussed by an expert group that decided to exclude three items. Two of the excluded questions dealt with patient thoughts during the examination. One was unclear in terms of difficult choice of statements. Content validity was evaluated with the help of the content validity index (CVI). CVI was rated by a group of seven health care professionals. The items were judged on a four-point scale ranging from 1=not relevant, 2=somewhat relevant, 3=quite relevant and 4=highly relevant. The answers were then dichotomized to 0=not relevant and 1=relevant. CVI was evaluated on item level (I-CVI): the number of experts who rated an item as relevant was divided by the number of experts, and the scale level (CVI-S) calculated as the average proportion of items rated as relevant [133].
After discussion in the expert group, we decided to use a four point rating scale: 1 =”not at all”, 2=”somewhat”, 3= “moderately” and 4=”very much”. The use of the statements can be illustrated by “I wanted to come out” which was rated “1” if the patient did not agree and “4” if they did. Reversed items in the instrument had to be inverted before calculation, to allow a high score to indicate a higher degree of anxiety.
Psychometric testing
Patients who participated in the study responded to questionnaires after scanning was completed. For the test-retest part, 111 patients answered the questionnaire once more, one week after the examination.
Missing data, score distribution, ceiling and floor effects were evaluated. The homogeneity of the scale, which means how each item correlates with the sum of
To explore underlying structures, an exploratory factor analysis using the unweighted least square method was used. Before the factor analysis the correlation between the items was evaluated with Bartlett’s test of sphericity (X2(153) = 2058.8, p<0.001) and Kaiser-Mayer-Olkin measure of sampling
adequacy (0.896), indicating a satisfactory correlation between the items. The number of factors were selected using the Kaiser criterion >1 [135, 136] and confirmed by Horn’s parallel analysis, using 95th percentile and 500 iterations [137].
Communality values were inspected to evaluate how much of the variance in each variable was explained by the extracted factors. Items with low communality values (<0.20) and/or factor loadings (<0.40) were excluded.
Cronbach’s alpha measures the internal consistency, meaning the extent to which the items are interrelated. A Cronbach’s α > 0.70 is rated acceptable for psychometric scales, > 0.80 good and > 0.90 excellent. If alpha exceeds 0.90 it can also be used for individual assessment [135].
Criterion-related validity was calculated between the instruments MRI-AQ, STAI-S, MRI-FSSTAI-S, HAD and the two study-specific single items about experiences and worries. Known-group validity evaluates the sensitivity of the new instrument to distinguish between different groups of patients. We hypothesized that MRI-AQ correlated higher with instruments measuring anxiety than those measuring depression and that it could distinguish between patients examining the heart or the spine.
Procedure for the intervention study (IV)
All CMR studies were performed with contrast injection. All examinations were performed at rest, without use of pharmacologic or physical stress.
The participants responded to questionnaires before the examination and immediately after. A one-week follow-up was performed to evaluate the intensity of the memory of the experience and anxiety of the examination (Table 4).