University of Kalmar
The influence of the cyanobacterium
Nodularia spumigena on the growth of perch
(Perca fluviatilis)
Martin Olofsson
Degree project work in biology
Level: D
Degree project works made at the University of Kalmar, School of Pure and Applied Natural Sciences, can be ordered from: www.hik.se/student
or
University of Kalmar
School of Pure and Applied Natural Sciences SE-391 82 KALMAR
SWEDEN
Phone + 46 480-44 62 00 Fax + 46 480-44 73 05 e-mail: info@nv.hik.se
This is a degree project work and the student is responsible for the results and discussions in the report.
The influence of the cyanobacterium Nodularia spumigena on the
growth of perch (Perca fluviatilis)
Martin Olofsson Biology, 240 hp
Degree project work in marine biology, 30 hp for Master of Science
Supervisors: Associate Professor Catherine Legrand, University of Kalmar; Research Assistant Patrik Stenroth, University of Kalmar
Examiner: Associate Professor Jan Herrmann, University of Kalmar
Abstract
Nodularin (NODLN) is a pentapeptide produced by the filamentous cyanobacterium Nodularia spumigena that is a bloom-forming species in the Baltic Sea. NODLN is an intracellular hepatotoxin, which can have a negative effect on aquatic life including fish. Toxins are released into the water when cells are lysing, e.g. during a decaying bloom. N. spumigena filaments have previously been shown to have a negative effect on perch egg development and perch larval survival. Coastal fish such as perch (Perca fluviatilis) have suffered from recruitment problems in the Baltic Sea the last decades. However, little is known about the impact of toxic cyanobacteria on juvenile perch. In the autumn of 2007, 1+ perch were exposed, during 29 days to either whole live cells (WC) or a crude extract (CE) of broken N. spumigena cells. Chlorophyll a concentrations in the aquaria were 50 µ g L -1. Perch were fed chironomidae larvae twice a day. Unexposed perch either fed (CoF) or without food (Co) served as controls. Length and weight of perch were measured at onset and termination of experiment. NODLN content was measured in N. spumigena filaments, crude extract and perch liver samples using liquid chromatography-mass spectrometry (LC-MS). Total lipids (TL) were extracted and quantified from whole-body lyophilised perch excluding livers. No significant differences for length and weight of perch were found between treatments and fed control. NODLN was detected in the crude extract samples, while no NODLN was detected in the perch livers. Moreover TL determination revealed no significant differences between treatments and fed control. Nodularia spumigena did not affect perch in this experiment, probably due to that the critical period of the first year for the perch was exceeded. Therefore, 1+ perch was not as susceptible to the cyanobacterium as eggs, larvae and younger juveniles of fish
found in the literature. Perch liver did not contain NODLN, thus either the toxin was detoxicated with no recorded energetic cost or it was not ingested. The variables studied here did not show any effects of NODLN. However, other chemical methods such as enzymatic activity may disclose effects of NODLN.
Sammanfattning
Nodularin (NODLN) är en pentapeptid producerad av den filamentösa cyanobakterien Nodularia spumigena, en blommande art i östersjön. NODLN är ett intracellulärt levergift som kan ha en negativ effekt på levande organismer, fisk inkluderat. Giftet frigörs ut i vattenmassan när cyanobacteriecellerna lyserar, t.ex. när cellerna bryts ner i slutskedet av en blomning. Kustfisk som abborre har lidit av misslyckad rekrytering längs med östersjökusten under de senaste årtionden. Problemen har varit som
allvarligast I Kalmar sund. Väldigt lite är dock känt om giftiga cyanobakteriers påverkan på juvenil fisk. Utveckling hos ägg från abborre och abborrlarvers överlevnad har tidigare visat sig påverkas negativt av N. spumigena. Under hösten 2007 utsattes 1+ abborrar under 29 dagar, för antingen hela, levande celler, "whole cells" (WC) eller ett cellextrakt “crude extract”(CE) av lyserade celler av N.
spumigena. Cellkoncentrationen var 50 µ g klorofyll a L -1. Abborrarna matades med chironomidaelarver två gånger om dagen. Fisk i akvarium med och utan tillgång till mat användes som kontroll. Abborrarnas längd och vikt mättes innan och efter experimentets slut. Toxinhalten mättes i tillsatt CE och abborrlevrar med hjälp av Liquid chromatography mass spectrometry (LC-MS). Totalfett extraherades ur helkropp av frystorkad abborre utan lever. Inga signifikanta skillnader för längd och vikt av abborre hittades mellan olika behandlingar och kontroll med mat. NODLN upptäcktes i cellextraktet medan inget NODLN upptäcktes i abborrlevrarna. Totalfett av abborrarna avslöjade inga andra skillnader mellan behandlingar och matkontroll. Abborren i experimentet påverkades inte av N. spumigena, antagligen för att den kritiska perioden under det första året hade passerat. Därav var fisken inte längre lika känslig för cyanobakterien som ägg, larver eller yngre juveniler av fisk har visat sig vara från litteraturen. Levrar från abborren innehöll inget NODLN så antingen gick avgiftningen fort och utan kostnad av energi eller var intaget försumbart. Variablerna studerade här visade inte på några effekter av NODLN. Andra kemiska metoder så som analys av avgiftningsenzym kan möjligen avslöja effekter av NODLN.
Table of Contents
1 INTRODUCTION ... 6
1.1 Cyanobacteria in the Baltic Sea...6
1.2 Perch in the Baltic Sea...8
1.3 Effects of Cyanobacteria on aquatic life ...10
1.4 Objective ...12
2 MATERIALS AND METHODS ... 13
2.1 Experimental set up ...13
2.2 Cultures ...14
2.3 Fish...15
2.4 Toxin analyses...16
2.5 Lipid analysis...16
2.6 Calculations and statistical analyses ...17
3 RESULTS AND DISCUSSION ... 17
3.1 Physical conditions ...17
3.2 Chla analysis ...21
3.3 Growth of perch ...23
3.3.1 Weight of perch liver...29
3.4 Toxin analysis ...31 3.5 Lipid analysis...34 4 CONCLUSIONS ... 35 5 ACKNOWLEDGEMENT... 36 6 REFERENCES ... 37 7 APPENDIX 1 ... 44 8 APPENDIX 2 ... 45 9 APPENDIX 3 ... 46 10 APPENDIX 4 ... 47
1 Introduction
1.1 Cyanobacteria in the Baltic Sea
Large annual accumulations of filamentous cyanobacteria in the Baltic Sea are well recognized and described (Sivonen et al., 1989; Kononen et al., 1996) and fossil pigments from sediment cores reveal evidence of cyanobacterial presence 7000 years ago (Bianchi et al., 2000). Cyanobacterial blooms have been a common feature since the 19th century (Finni et al, 2001). In the last decades cyanobacterial blooms are suggested to have increased both in frequency and extent (Kahru, et al., 1994), most likely due eutrophication during the 20th century (Larsson et al., 1985) which may have led to a change in nutrient ratios (Smayda, 1990 cited by Lehtimäki, 2000).
Blooms of Cyanobacteria usually occur in the summer months peaking in July to August in the Baltic Sea (Kononen et al., 1996). When solar radiation heats up the surface layers in the Baltic Sea, the water tends to get stratified. During calm days at low wind speed cyanobacteria may become the dominant phytoplankton if the inorganic N:P ratio is low. During calm conditions cyanobacteria can form large aggregations over vast areas in the Baltic proper (Kononen et al., 1996). The two major cyanobacterial species in the Baltic, Nodularia spumigena and Aphanizomenon flos-aquae, have the ability to fixate molecular nitrogen (Capone & Carpenter, 1999) thus benefiting from N-limited waters after the spring bloom (Kononen et al., 1996). Other properties, besides fixing N2, making them competitive are regulation of buoyancy through gas vesicles in their cells (Walsby et al., 1997) and storage of phosphorous in vacuoles (Oliver & Ganf, 2000). Furthermore some species have been shown to exert allelopathic effect on other phytoplankton species (Suikkanen et al., 2004).
Cyanobacteria are capable of producing a wide range of bioactive compounds including toxins of different modes of action (e.g. reviewed by Sivonen, 1996, Codd, 2000 and Codd et al., 2005). Four groups of toxins have been outlined; neurotoxins, dermatotoxins, hepatotoxins (Sivonen, 1996) and endotoxins such as lipopolysaccharides (LPS) present at the outer structure of the cell wall of gram-negative bacteria including cyanobacteria (reviewed by Hoiczyk & Hansel, 2000). The LPS mode of action and toxicity of cyanobacteria may, however, differ from that
of heterotrophic bacteria and vary between strains (Stewart et al., 2006). LPS have been found to enhance the effects of cyanobacterial toxins (Pietsch et al., 2001).
Nodularia is a potentially toxic genus and the species Nodularia spumigena is found to produce a group of cyclic pentapeptides called nodularins (NODLN) which are hepatotoxins (Sivonen et al., 1989) inhibiting the serine-threonine protein phosphatases PP1 and PP2A (Bagu et al., 1997). NODLN is structurally and functionally similar to another group of hepatotoxins called microcystins (MC), which are cyclic heptapeptides produced by several species with Microcystis aeruginosa as the most common species (Sivonen, 1996).
NODLN is highly selective to hepatocytes due to the bile acid pathway. In acute doses NODLN can cause death of organism from hemorrhagic shock and in non-lethal doses it can be tumour promoting as a cause of hyperphosphorylation of proteins leading to disturbances in cytoskeleton and loss of subunits (Ohta et al., 1994). In addition the binding to protein phosphatases (PPs) is not covalent, contrary to some MCs, and reactive residue of NODLN can freely interact with other informational macromolecules contributing to its carcinogenic properties (Bagu et al., 1997; Ohta et al., 1994). The LD50 value in mice has in most cases proven to be 50-150 µg kg -1 body weight (Lehtimäki, 2000), which makes nodularin a highly potent toxin. For a period of time Nodularia was believed to be the only toxin-producing genus in the Baltic Sea (Sivonen 1996). However, Herfindal et al. (2005), found benthic isolates of the genus Anabaena to be toxic.
In the Baltic Sea waves may transport cyanobacterial blooms towards the shoreline and when reaching the littoral zone in sheltered bays the blooms may form dense layers. Humans often consider the blooms as a nuisance when found in recreational waters due to surface scum and odour and more lately their toxicity (Hansson, 2006). The decomposition of cyanobacterial filaments at late stationary phase is facilitated by intact gas vesicles keeping dead cells at the surface level where solar heating makes microbial degradation more effective (Bursa, 1968 and Hope, 1981, cited by Sellner, 1997). These sheltered bays may serve as spawning and nursery grounds for coastal dwelling fish like pike (Esox lucius L.) and perch (Perca fluviatilis L.). When the cells of N. spumigena are decaying the intracellular toxin is released into the
surrounding water together with other bioactive compounds (Sivonen & Jones, 1999) such as lipopolysaccharides (LPS), which may have a negative impact on aquatic life (Pietsch et al., 2001; Best et al., 2002; 2003).
Reports of animal poisoning have been associated with cyanobacterial toxins (e.g. see Lundberg et al., 1983 and Edler et al., 1985, cited by Sivonen 1989; see also Nehring et al., 1993, cited by Sellner, 1997). Fish kills (Rodger et al., 1994; Zimba et al., 2001) are often coinciding with cyanobacterial blooms although other circumstances like poor water quality, pH fluctuations and anoxia may be involved. These attributes are, however, most likely also a consequence of the cyanobacterial blooms (Rodger et al., 1994).
1.2 Perch in the Baltic Sea
Coastal fish, such as perch (P. fluviatilis L.) and pike (E. lucius L.) have suffered from a decline at a number of different locations along the Swedish coastline since the middle of the nineties (Karås, 1999). This decrease has been attributed to recruitment failure (Karås, 1998; Andersson, 2000; Nilsson et al., 2004). The problems for perch in particular have been evident in Kalmar Sound where fishing during spawning has been banned since 1998. (Andersson et al., 2000).
Several causes to the recruitment failure of perch have been suggested such as predation from stickleback and sprat; lack of proper food for young of the year (y-o-y) fish (Ljunggren et al., 2005) and anthropogenic activities like eutrophication (Sandström & Karås, 2002), boating and fishing (Ljunggren et al., 2005). Although dense populations of stickleback have been found in high recruitment areas as well as in low recruitment areas, hence the predation of stickleback seems not to be the sole cause (Ljunggren et al., 2005). However, the impacted areas are mainly situated at the outer archipelago or at exposed sites (Andersson et al., 2000; Ljunggren et al., 2005) leading to the conception that changes in the ecosystem of the Baltic Proper may be the underlying source of problems. The Baltic proper ecosystem shifted from a cod-dominated system to a sprat-cod-dominated system simultaneously with the recruitment problem of perch (Ljunggren et al., 2005). Decreasing abundance of zooplankton has been proposed as one of several reasons for this shift (Andersson et al., 2000;
Ljunggren et al., 2005; Möllman et al., 2008) possibly as a consequence of climate change (Möllman et al., 2008). Negative effects of cyanobacteria on aquatic life (ref. therein) together with increasing cyanobacterial blooms (Kahru et al., 1994) suggest potential cyanobacterial influence on ecosystem changes as reviewed by Karjalainen et al. (2007). The recruitment problems for perch in the Baltic Sea, however, are most likely not caused by a single factor but a combination of factors with synergistic effects.
The size of most fish populations is mainly determined by predation/fishing and recruitment of y-o-y fish (Neuman, 1976; Karås, 1996). Growth the first year has been outlined as the major feature governing year class strength of perch (Perca fluviatilis) with temperature being the single most important factor limiting growth (Neuman, 1976; Karås, 1996; Kjellman et al., 2003). Growth is a measure of fitness since individuals with faster growth reaching larger sizes more rapid have greater chances of surviving and thus also to reproduce. Risk of predation is less when growth is rapid, especially during the first year of growth (e.g. Pauly, 1981 and Pepin & Mayers, 1991, cited by Karås 1999).
In the coastal zone of the Baltic spawning usually occurs from late April to June and at rare occasions until the beginning of July (Karås 1987). Time of spawning for perch depends on a wide range of environmental conditions such as water temperature, day length, substrate conditions, water levels and velocity (Craig, 2000). Biotic interactions such as production of pheromones may also play a role in the timing of spawning (Craig, 2000).
Nowadays, perch is more important for the recreational fisheries than for the commercial fisheries. In 2004, according to a questionnaire, the catches from the recreational fisheries were 1200 tons compared to 103 tons for the commercial fisheries (Aho et al., 2007). Yearly landings for the commercial fisheries vary mainly with the strength of year classes, which in turn is determined by growth and summer temperature (Neuman, 1976; Karås, 1996; Kjellman et al., 2003). From 1994 to 2006 the annual commercial catches in the Baltic Sea have decreased with one third from 148 to 105 tons (Aho et al., 2007). Moreover changes in the perch/roach (Rutilus rutilus L.) ratio are often used in coastal fish community assessments (HELCOM
2006) suggesting preservation and restoration of habitats and recruitment areas to be of great concern (Ljunggren et al., 2005).
1.3 Effects of Cyanobacteria on aquatic life
Cyanobacteria may affect individuals, populations and even entire ecosystem (Karjalainen et al. 2007). Studies based on the effects of Microcystis and the structurally and functionally similar toxin MCs in freshwater environments are more frequent than studies about the impacts of Nodularia and NODLN. The increasing occurrence of Nodularia in the Baltic Sea calls for extensive research on this topic (Kankaanpää et al., 2002; Karjalainen et al., 2006)
Harmful effects, of cyanobacteria on zooplankton, have been associated with toxins (DeMott et al., 1991; Reinikainen et al., 1994) and are well known but also mechanical interference due to morphology has been found (Gliwicz & Lampert, 1990 cited by DeMott et al., 1991). Considering low energetic value of cyanobacteria (Ahlgren et al., 1992), experiments have shown high mortality and low egg production rate of a copepod feeding even on non-toxic Nodularia, suggesting insufficient nutritional value for copepod production (Koski et al., 1999). Mysid shrimps showed high resistance to toxic Nodularia extract during long time exposure (Engström et al., 2001). The same study also showed mysid shrimps capable of selective feeding, avoiding toxic Nodularia filaments. Negative effects on the crustacean Gammarus zaddachi have been shown when exposed to Nodularia (Korpinen et al., 2006).
Bioaccumulation of cyanobacterial toxins has been detected in zooplankton (Karjalainen et al., 2006), mollusks (Sipiä et al., 2001a; 2002; Kankaanpää et al., 2002; Marzek et al., 2007) and fish (Sipiä et al., 2001b, 2002; 2007; Mazur-Marzek et al., 2007; Pääkkönen et al., 2008). Benthic organisms, such as clams, and deposit feeders like the blue mussel (Mytilus edulis) accumulated the highest concentration of NODLN in the Baltic Sea (Sipiä et al., 2001a; 2002). Benthic feeding fish like flounders also accumulate substantial amounts of NODLN in their liver (Sipiä et al., 2001b; Mazur-Marzek et al., 2007; Persson et al., submitted). However, there appears to be a biodilution rather than a biomagnification of NODLN
as less than 1% is transferred from one trophic level to another due to toxin degradation at every level (Karjalainen et al., 2007). Still Karjalainen et al. (2005) found the ingestion rate and growth rate of pike larvae to be lower during an 11-day experiment when fed on zooplankton pretreated with N. spumigena extract compared to non-exposed zooplankton.
Embryonic and larval development of fish has been negatively influenced when exposed to cyanobacteria producing MCs especially in experiments with cyanobacterial crude extract (Oberemm et al., 1999; Ojaveer et al., 2003; Palikova et al., 2003). Moreover Pietsch et al. (2001) found the activity of detoxication enzymes in a wide range of organisms including zebra fish (Danio rerio) to be elevated in treatments with purified MCs but decreased when treated with a crude cell extract. LPS fractions in the crude extract seem to inhibit detoxication enzymes and enhance the effects of cyanobacterial toxins. Further detoxication enzyme systems glutathione S-transferases (GST) were impaired in embryos and adult zebra fish by a Microcystis strain and water bloom containing LPS from both heterotrophic bacteria and cyanobacteria (Best et al., 2002). Liver enlargement and an increase of drinking rate in rainbow trout (Oncorhynchus mykiss) were shown by Best et al. (2003). Intraperitoneal (IP) injection of bacterial LPS in the gut followed by treatments of whole and lysed Microcystis cells where lysed cells together with LPS had the most severe effects. Increased drinking rate may lead to increased intake and exposure to toxin (Best et al., 2003). Similarly, GST and catalase (CAT) activities decreased significantly in flounder liver exposed to IP injections of NODLN (Persson et al., submitted). Alterations of the enzymatic defense system may lead to increased energetic costs, hence decreasing growth and survival of fish. Cyanobacteria with associated toxins potentially affect the growth of aquatic life including fish. Detoxification of the organism costs energy thus growth may to be impaired or at least it leads to an increase in energy demand (Pietsch et al., 2001; Kamjunke et al., 2002; Pääkkönen et al., 2008). In addition two minor experiments have shown toxic effects of N. spumigena on perch eggs (Albinsson, 2005) and larvae (Alfredsson, 2006).
Orally ingested N. spumigena cells led to severe but reversible liver damage of sea trout (Salmo trutta) and NODLN accumulated in liver tissues (Kankaanpää et al.,
2002). A single injection into the fish stomach was followed by an 8-day study where fish were sampled continuously. The worst signs of liver damage appeared at day 1-2 but liver was gradually restored though still swollen at day 8. Accumulations of NODLN-like compounds, however, increased during the experiment suggesting conversion of NODLN to less toxic conjugates (Kankaanpää et al., 2002).
1.4 Objective
Blooms of Nodularia spumigena occur frequently in the Baltic Proper and may drift ashore with winds, likely to reach spawning and nursery grounds of coastal fish like pike (Esox lucius) and perch (Perca fluviatilis). When these blooms are degraded they can contain toxins and other bioactive compounds possibly affecting fish development and survival. Survival of juvenile fish are often determined by its size and growth rate, e.g. to avoid predation. Higher growth rate and larger size increases the chance of surviving and later on to reproduce, which may lead to higher fitness. Organisms exposed to cyanobacterial toxins consume energy at detoxification that normally could be used for growth. Lipids are an example of an important energy reserve utilized for growth and an indicator of the health status of juvenile fish. Several studies have shown the negative impact of cyanobacteria on embryonic and larval development of fish, generally with the largest impact from lysed cyanobacterial cells. However, young of the year (y-o-y) or older juveniles of fish are seldom studied. Hence the objective was to study in parallel the influence of live whole cells and crude extract of N. spumigena on the growth of 1+ juvenile of P. fluviatilis, testing the following hypotheses:
• The growth of P. fluviatilis exposed to N. spumigena will be impaired compared to P. fluviatilis not exposed.
• Crude extract of N. spumigena will have a more negative influence on the growth of P. fluviatilis than will whole cells.
• The total lipid concentration in P. fluviatilis exposed to N. spumigena will be less compared to P. fluviatilis not exposed.
2 Materials and methods
2.1 Experimental set up
Perch were kept in aerated 40L aquaria (5 fish in each) during a 29-day experiment. Fish were exposed to treatments of live whole cells and crude extract (referred to as WC and CE respectively) from Nodularia spumigena cultures, n = 5, at a concentration of 50 µg chla L-1. In the Baltic Sea 50 µg chla L-1 is a common bloom condition (Mazur-Marzek et al., 2006). Control perch unexposed to Nodularia were either fed as in the treatments (CoF) or kept in aquaria without food (Co). The control without food was chosen as an ultimate control. If perch growth would be negatively influenced by N. spumigena exposure the starving control would then serve as a reference point on how severe the effects had been. During the experiment the perch were fed Chironomidae larvae (Ocean Nutrition Europe, Belgium) in excess twice a day.
The aquaria were set up on an upper and a lower shelf with a draining system in a temperature and light controlled room (Fig. 1, Appendix 1). The experiment was conducted with dim light settings at an intensity of 2.55 and 1.46-µE m-2 s -1 at the upper and lower shelf respectively. Treatments were blocked and randomly distributed within the block (Fig. 3, Appendix 2).
Sand-filtered temperate Baltic Sea water (17-18ºC, 7 psu) was used for the experiment. Dissolved oxygen concentration, pH and temperature were monitored daily. Live cultures and crude extract were added every second or third day, for the WC and CE treatment respectively, to obtain a final chla concentration of 50 µg L-1. The first three days of the experiment samples for chla were taken before and after addition of Nodularia in both treatments to estimate the algal sedimentation. Additions based on these calculations were then made in order to keep a constant algal concentration. After that, sampling and addition was carried out every third or fourth day until day 10. Difficulties in keeping the concentration constant due to different sedimentation rates in the aquaria led to sampling and additions every day from day 11 on. Cleaning of aquaria and water exchange (10L) were done every third or fourth day with new CE and WC additions based on the chla value from the day
before. At the same time sampling for both chla and toxins were taken before and after water replenishment and additions.
Chlorophyll a was measured on 10-15 ml samples filtered onto Pall A/E glass fibre filters, extracted in the dark for at least 8 hours in 4 ml 96% ethanol using a Turner AU fluorometer calibrated with 96% Ethanol (Jespersen & Christoffersen 1987).
To determine perch growth, the length and weight of individual fish were measured at the beginning and at the end of the experiment (Fig. 2, Appendix 1) with an additional measuring point after 22 days when most of the perch in the Co treatment had died. To monitor the biomass of cyanobacteria, which should be kept constant at 50 µg chla L-1 in the aquaria, samples for chla were taken at regular intervals.
2.2 Cultures
Nodularia spumigena strain KAC13 (Fig. 4 Appendix 3), isolated in the Kalmar Sound and obtained from the Kalmar algal collection at the University of Kalmar, Sweden (http://www.bom.hik.se/nesch/kac/). KAC13 was grown in batch cultures (0.5-10 L) and transferred to aerated mesocosm containers of 100L, 18ºC 16:8 h light: dark cycle and an irradiance of 305 µE m -2 s -1. The non-axenic cultures were grown in modified f/2 medium (Guillard, 1975) up to 50L with concentrations of 2000-4000
µg chla L-1 starting three months before the beginning of the experiment. Among tested Nodularia strains from the Kalmar Algal Collection KAC13 was shown to exert the most severe effect on survival of perch larvae (Alfredsson, 2006). Further, KAC13 contained among the highest concentrations of NODLN compared to other Nodularia strains (Esplund & Stolte, unpublished data). Cultures were harvested continuously and added to the WC treatment every second and third day in order to achieve a concentration of 50 µg chla L-1. Chla in the cultures was monitored every week.
Batches of crude extract were prepared from the cultures several times during a 3-month period. A protocol was developed and modified partly based on Palikova et al. (2003) and Pietsch et al. (2001). N. spumigena filaments were centrifuged 45-60 min at 14000 rpm until the cells had sedimented. The pellet was collected, manually
grinded and redissolved in culture medium. Sample for chla was then taken followed by sonication 3 x 10 min. After each 10 min cycle, the cells were studied microscopically to make sure they were lysed. The extracts were stored frozen (-80° C) in 20 ml batches with different chla concentration. Batches of CE were thawed and added to reach a theoretical concentration of 50 µg chla L-1. At an early stage of this method the supernatant, which still contained a great deal of cyanobacterial cells due to the time of centrifugation, was filtered through a 5 µm filter made out of plankton net. The cells on the filter were redissolved, grinded and sonicated. The same concentration of 50 µg chla L-1 was used for the CE treatment.
2.3 Fish
1 year old perch was caught in May 2007 in Båtstadsfjärden, salinity ~ 5 psu (Andersson, personal comm.) and water temperature of 20 ºC, near Simpevarp power plant outside Oskarshamn (Fig 4, Appendix 4). The water in the area is receiving the cooling water from the power plant is 10 ºC above ambient water at full production. Perch in this bay experience prolonged autumns, warm winters and early springs. The hormone system of perch needs a period with low temperature and short photoperiod for successful gonad development. (Luksiene et al., 2000). However, this fact should have little impact on the experiment, as growth was the parameter of interest compared between treatments and controls and the experiment was conducted in temperate seawater of 17-18 ºC.
The fish was caught using gill nets 10 mm mesh size, 1.8 or 1.5 x 30 m. Nets were laid and gone through with half an hour intervals. The fish was brought to the laboratory facilities at the University of Kalmar and kept in aerated 400L tanks with continuous flow of water between June-August in order to acclimatize them to lab environment. The perch were adapted to feed on Chironomidae larvae (Ocean Nutrition Europe, Belgium) and then put into 40L aquaria with a new acclimatizing period of two weeks before starting the experiment (Sept-Nov).
2.4 Toxin analyses
Results from previous experiments with N. spumigena KAC13 (Olofsson, 2007) were used to estimate the NODLN concentration added to the WC and CE treatments based on the concentration of chla added. When batches of crude extract were added to the CE treatments, subsamples from the batches were also taken. Actual NODLN concentrations in the batches were measured on day 0, 1, 9, 15, 16, 20, 21, 22, 26 and 27. Volumes of collected crude extract were based on values of chlorophyll and filtered culture material from Olofsson (2007). In that previous experiment 30 ml of culture was filtered and a chla concentration of 85 µg L -1 was more than enough for detection of NODLN. The batches of crude extract were of different chla concentrations thus sample volumes differed (Table 3). Water samples from the CE and WC treatments were collected but not sent for analysis. Samples were stored at - 20 °C prior to freeze-drying.
At termination the perch were killed by an overdose of benzocain, measured and weighed before stored in freezer prior to analysis. The fish was thawed and the liver isolated, weighed and freeze-dried (together with the rest of the fish in order to determine the dry weight). The lyophilised liver samples were pooled making one sample for each aquarium and five per treatment. Selected samples from crude extract batches and the pooled liver samples were sent for analysis at the Department of Food Chemistry, Friedrich-Schiller University in Jena, Germany. NODLN was quantified by Liquid Chromatography-Mass Spectrometry (LC-MS), using a Perkin-Elmer series 200 pump and autosampler coupled to an API 165 mass spectrometer equipped with an atmospheric pressure ionization source and a single quadrupole (Applied Biosystems, Foster City, CA, USA). Analyses were performed by Thomas Krüger.
2.5 Lipid analysis
After isolation of perch liver, lyophilisation and dry weight had been recorded the remains of each perch were homogenized with an Omni Mixer (Omni International Marietta, USA) and lipid content extracted according to Bligh & Dyer (1959). The method was modified as samples were centrifuged at 14000 rpm for 1 min after extraction and the chloroform phase containing lipids were transferred to pre-weighed tubes without filtration. Finally the total lipids (TL) were gravimetrically determined.
2.6 Calculations and statistical analyses
After starved control fish had died, the Co was terminated at day 22, while the experiment continued with CE and WC treatments and the CoF. Comparisons of perch length and weight in the CE and WC treatments and CoF between day 22 and 28 showed no significant differences (One-way ANOVA p>0.05). Thus data shown here compares Co at day 22 with treatments and fed control at day 28.
Specific growth rate (Gw% d -1) was calculated according to Strand et al. (2007b):
Gw= (lnWt -lnWi)/∆t*100 (1)
Where Wt is the weight at time t (g) and Wi is the initial weight (g).
Condition factor (CF) was calculated according to Bagenal & Tesch (1978) as cited by Lozys (2004):
CF = (Wt/Lt3)*100 (2)
Where Wt is the weight at time t (g) and Lt is the length at time t (cm).
Data processing and calculations were performed using Microsoft Excel 2004 while STATISTICA, version 8.0 (StatSoft, Tulsa, USA) was used when carrying out one-way ANOVA.
3 Results and discussion
3.1 Physical conditions
The oxygen saturation levels in the aquaria showed to be sufficient and remained stable, throughout the experiment, for both controls and treatments (Fig. 5). On average (mean ± SD) the concentration was 8.0 ± 0.6 mg L -1 for the CE and WC treatments together with the CoF and 8.2 ± 0.5 L -1 for the Co. At day 22 most of the perch in the Co had died and replicates were terminated.
The pH level varied more (7.7-8.5) and was generally lower in all aquaria at the end of the experiment with a main decrease at day 16 in all treatments and controls except for the WC, which had a more gradual decrease. Towards the end the pH rises slowly but never reaches the level in the first half of the experiment (Fig. 6). The average pH
was 8.08 ± 0.14 and 8.08 ± 0.1 for the treatments CE and WC respectively. For the controls the average was 8.21±0.08 and 8.12 ± 0.15, Co and CoF respectively.
0 2 4 6 8 10 12 0 5 10 15 20 25 30 O 2 c o n c ( m g L -1 ) CE 0 2 4 6 8 10 12 0 5 10 15 20 25 30 O 2 c o n c ( m g L -1) WC 0 2 4 6 8 10 12 0 5 10 15 20 25 30 O 2 c o n c ( m g L -1) Co 0 2 4 6 8 10 12 0 5 10 15 20 25 30 Time (days) O2 c o n c ( m g L -1) CoF
Fig. 5. O2-concentrations over the experimental time for the treatments (CE and WC) and the controls
with (CoF) and without (Co) food (mean values ± SD, n = 5). Values the same day reveals water exchange at day 5, 9, 12, 16, 19, 22 and 26.
The average temperature remained constant (18 °C) throughout the experiment except for the drop in temperature at day 13 but recovered at day 16 (Fig. 7) and the trend was the same in all aquaria irrespective of treatment and control. The last two days the temperature decreased by 1°C.
7.6 7.7 7.8 7.9 8 8.1 8.2 8.3 8.4 8.5 0 5 10 15 20 25 30 p H CE 7.7 7.8 7.9 8 8.1 8.2 8.3 8.4 8.5 8.6 0 5 10 15 20 25 30 p H WC 7.8 7.9 8 8.1 8.2 8.3 8.4 8.5 8.6 0 5 10 15 20 25 30 p H Co 7,7 7,8 7,9 8 8,1 8,2 8,3 8,4 8,5 8,6 0 5 10 15 20 25 30 Days p H CoF
Fig. 6. Variation of pH over the experimental time for the treatments (CE and WC) and the controls
with (CoF) and without (Co) food (mean values ± SD, n = 5). Values the same day reveals water exchange at day 5, 9, 12, 16, 19, 22 and 26.
The temperature was always at least half a degree, sometimes more than one degree, higher on the upper shelf compared to the lower, which can explain the large variation for some values.
15.5 16 16.5 17 17.5 18 18.5 19 0 5 10 15 20 25 30 T e m p ( ° C ) CE 15.5 16 16.5 17 17.5 18 18.5 19 0 5 10 15 20 25 30 T e m p ( ° C ) WC 15.5 16 16.5 17 17.5 18 18.5 19 0 5 10 15 20 25 30 T e m p ( ° C ) Co 15,5 16 16,5 17 17,5 18 18,5 19 0 5 10 15 20 25 30 Days T e m p ( ° C ) CoF
Fig. 7. Temperature variation during the 29-day experiment for CE, WC, Co and CoF respectively
(mean values ± SD, n = 5). Values the same day reveals water exchange at day 5, 9, 12, 16, 19, 22 and 26.
The drop in temperature coincided with the decrease in pH. Whether the two are connected or not is not clear but the pH decreased when the temperature recovered at day 16. The water from the temperate sea water supply might have had an alteration in pH and/or temperature. Although a possible decrease in room temperature may be more plausible, as otherwise the ambient air should have had the time to heat up the water between water renewals. The decrease in pH at day 16 could definitely be due to the water exchange.
The physical factors should not have any influence on the experiment. All aquaria were saturated in oxygen throughout the experiment and the temperature constant, although small differences between aquaria. pH levels in all aquaria were well within the tolerable range for perch. The lower limit where increased mortality has been found is pH 5 and the upper limit is pH 9 (Alabaster&Lloyd, 1980 cited by Karås 1999).
3.2 Chla analysis
The chla concentration in the treatments varied during the experiment with peaks after addition of CE and WC but due to sedimentation the concentration went down drastically in 72 h or even in some cases in 24 and 48 h (Fig. 8). Treatments with CE showed sharper but most often more regularly decline than did treatments with WC. The calculated mean value (± SD) of all chla measurements revealed average exposure levels of 46 ± 33 and 49± 22 µg chla L-1 for the CE and WC treatments, respectively.
Chla describes the biomass of N. spumigena and thus the amount of exposure. The NODLN/Chla ratio for this N. spumigena strain was measured during a previous experiment (Olofsson, 2007). Therefore it might be possible to also predict the amount of toxins present (Table 2. in 3.4 Toxin analysis).
0 50 100 150 0 5 10 15 20 25 30 C h la ( µ g L -1 ) CE 0 50 100 150 0 5 10 15 20 25 30 Days C h la ( µ g L -1 ) WC
Fig. 8. Variation of chla concentrations in the CE and WC treatment. Arrows indicate additions after
water replenishment during the experiment (Mean value ± SD, n = 5).
The variation in chla concentrations was natural, due to sedimentation and in the case of CE the cells were sonicated and frozen therefore lysed and cell debris lacks their gas vesicles which regulate the buoyancy. Chla is also likely to be decomposed more rapidly when cells are lysed, probably due to the heterogeneous distribution of chlorophyll a in the cell debris. Despite intensive monitoring and addition the concentration varied largely. However, the average exposure levels of 46 and 49 µg chla L-1 for the CE and WC treatments respectively were very close to the intentional 50 µg chla L-1. Pulses of cyanobacterial exposure like these may be common in coastal water as patchy distribution of blooms float ashore with winds and fish can move away from exposed areas. On the other hand, juvenile fish are more likely to
stay in their nursery grounds than move due to the risk of predation (Engström-Öst et al., 2006).
3.3 Growth of perch
In the control without food (Co) both length and weight decreased with time (Fig. 9). Due to heavy mortality the Co treatment was terminated and the fish in all treatments and controls were measured. The experiment then continued with the crude extract (CE) and whole cells (WC) treatments together with the food control (CoF) until day 28. At that point some perch had died rapidly in what seemed to be a disease not related to the treatments. Mortality occurred in the control as well as in the treatments. There was no significant difference in length and weight between the treatments or between the treatments and the fed control (one-way ANOVA, p>0.05). Significant difference was only found when comparing with the starved control (p<0.01), which obviously showed negative growth (Fig. 9). Specific growth rate (Gw% d -1) calculated in order to minimize any differences in initial weight (Equation 1) did not disclose any further differences (Table 1). Gw% d -1 = 0.7 ± 0.1 for the CE treatment was not significantly higher than 0.6 ± 0.1 for both WC and CoF (p>0.05).
Table 1. Specific growth rate (Gw% d -1) and the condition factor (CF) for the treatments crude extract
(CE) and whole cells (WC) and the fed control (CoF). Neither Specific growth rate nor CF differed statistically between treatments and the fed control (one-way ANOVA, p>0.05).
CE WC CoF Co
Gw (% d -1) 0.7 ± 0.1 0.6 ± 0.1 0.6 ± 0.1 -0.9 ± 0.1
A 80 85 90 95 100 105 0 5 10 15 20 25 30 L e n g th ( m m ) CE WC Co CoF B 0 2 4 6 8 10 12 0 5 10 15 20 25 30 Days W e ig h t (g ) CE WC Co CoF
Fig. 9. Growth of the perch in CE, WC, Co and CoF over time, mean values ± SD, n = 5. Neither length (A) nor weight (B) showed no difference between treatments and controls (one-way ANOVA
p>0.05) except for perch in Co which naturally had significantly lower growth (p<0.01) than the rest of
the aquaria.
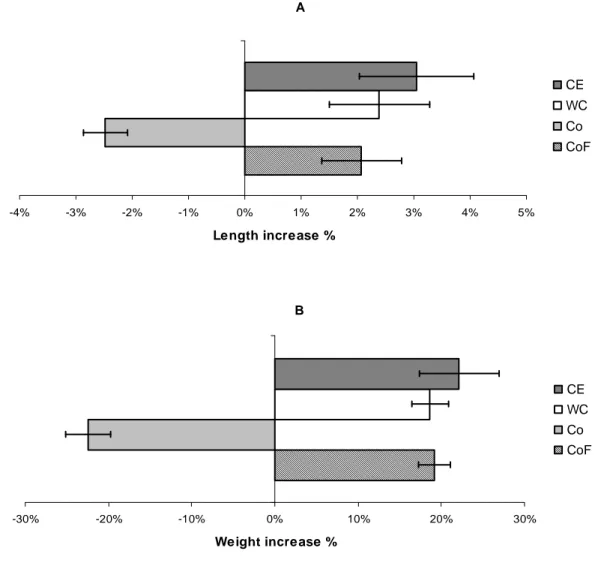
The length increase in percent described a slightly different picture than the weight increase in percent. Perch in the CE treatment seemed to increase more in both length and weight compared to the WC treatment and the fed control CoF but it seemed more pronounced when comparing length. However, no significant differences were found in either case between treatments and fed control (one-way ANOVA, p>0.05) as shown in Fig. 10. The Co was excluded from the ANOVA due to negative growth. Nevertheless, not significant, perch in the fed control indicated less increase in length than in weight when compared to treatments, e.g. between CoF and CE, 2.1 ± 0.7 and 3.0 ± 1.0% respectively. The WC ends up in between with 2.4 ± 0.9% increase in length. Looking at weight increase perch in the CE treatment increased with 22 ±
4.8% compared to 19 ± 2.2 and 19 ± 1.9% for WC and CoF respectively. In an attempt to further assess the condition of the perch a condition factor (CF) was calculated (Equation 2). Table 1 shows no significant deviation between treatments and fed control with respect to CF (p>0.05).
A -4% -3% -2% -1% 0% 1% 2% 3% 4% 5% Length increase % CE WC Co CoF B -30% -20% -10% 0% 10% 20% 30% Weight increase % CE WC Co CoF
Fig. 10. The length (A) and weight (B) increase in percent during the experiment for the treatments CE
and WC and the controls not fed (Co) and fed (CoF), mean values ± SD, n = 5. The weight at termination was related to the weight at onset indicating a larger increase in the CE compared to WC and CoF but not statistically significant (One-way ANOVA, p>0.05). Co excluded in the test.
Comparisons of growth rate data in the literature are difficult due to different growth conditions and age of perch. Freshwater reared perch of different European origin were observed to grow at a rate of 0.89-1.2% d -1 in 22-23 °C during 74 days fed artificial dry food (Mandiki et al., 2004a). Initial weight was 4 times higher than in this study. Mandiki et al. (2004b) recorded Gw in perch, twice the initial weight compared to this experiment, and over a 3 months period to be 0.82% d -1. Overton et al. (2008) found Gw of approximately 3% d -1 for perch of similar size in salinity of 4
and 8‰ at 20°C. In a fresh water experiment with different light intensity and tanks of different colours, Gw of 0.7% d -1 was recorded during 3 weeks (Strand et al., 2007a). Temperature was approximately 21°C, though, and initial weight of fish was much greater, about 10 times higher than in my study. Furthermore Strand et al. (2007b) showed Gw of 0.70 and 0.94% d -1 for perch grown in freshwater of 17 and 23
°C respectively. Initial weight of fish was approximately six fold higher than in my experiment. Even considering the different growth conditions, the growth rate found in my experiment seemed to be at the lower end of the range but still within the range of other studies. The Chironomidae larvae given as food could have been insufficient as the perch may have reached a certain size or age when they start foraging for larger prey (Aho et al., 2007). No comparable in situ data was found in the literature.
Moreover comparing the relationship between weight and length through the condition factor (CF) did reveal a minor difference where the CE had the highest followed by the CoF and WC, however not significant (Table 1). Considering the larger increase in length for CE and WC compared to CoF that was indicated here was evident only for the WC which had the lowest CF. Pääkkönen et al. (2008) found a lower condition index in three-spined sticklebacks exposed to filaments of N. spumigena and zooplankton pre-fed N.spumigena filaments. No such effect could be found here.
The dry weight of perch collected at termination revealed the same pattern with no differences between treatments and food control, as shown in Fig. 11. The dry weight of the treatments CE and WC was recorded to 2.13 ± 0.36 and 1.93 ± 0.50 g respectively. When compared to the dry weight of the fed control CoF (2.00 ± 0.56 g) no treatment deviated statistically from CoF or one another (one-way ANOVA, p>0.05).
CE WC Co CoF 0 0,5 1 1,5 2 2,5 3 D ry w e ig h t (g ) CE WC Co CoF
Fig. 11. Dry weight of perch is shown at the end of experiment for treatments of crude extract (CE),
whole cells (WC) and controls without and with food (Co and CoF respectively), mean values± SD,
n=25. No significant differences between treatments and fed control were found (one-way ANOVA, p>0.05).
When Co with a dry weight of 1.25 ± 0.53 g was included perch in the Co had a significantly lower dry weight compared to treatments and fed control (one-way ANOVA, p<0.01).
Dry weight was determined to see if the perch accumulated water in their bodies as a response to stress as found by Best et al. (2003) examining the exposure of rainbow trout to injected Microcystis cells. Some of the perch were observed to be swollen which might be due to the unidentified disease appearing at the end of experiment in both treatments and control. Since the observations were made in both treatments and control, no trend could be detected here.
The perch grew equally well in both treatments (CE and WC) and the food control (CoF) indicating low susceptibility to NODLN and Nodularia spumigena for healthy 1+ perch juveniles. Considering the deviation between Nodularia strains regarding toxicity and morphology (Sivonen, 1989; Alfredsson, 2006) nothing can be stated with certainty until the effects of several strains has been tested. However, as shown by Alfredsson (2006) KAC13 had a negative effect on perch larval survival and Albinsson (2005) found the hatching success of perch eggs to be negatively influenced by N. spumigena. The critical stage as larvae and (y-o-y) juveniles may
have been exceeded for the perch to be affected by KAC13. High growth rate of perch the first year has been related to warm water temperature (Neuman, 1976; Karås, 1996; Kjellman et al., 2003). The water where the fish was caught is affected by the power plant in the vicinity heating the water. Therefore growth the first year is most likely rapid with individuals, originating from this site, reaching large sizes and better chances of surviving. If perch originating from this site suffer from a malfunctioning reproductive system due to the elevated temperature (Luksiene et al., 2000), the higher growth may not lead to higher fitness as it normally could do. Nonetheless, during captivity prior to experiment several individuals did not survive thus indicating “strong individuals” adapted to lab environment and, hence used in the experiment.
The perch in this experiment was clearly in a good physiological state, where one of the reason was the excess of food given. If perch in less good health status (e.g. due to low food supply) would have been exposed to KAC13, the result might have shown an effect on growth.
Perch were fed Chironomidae larvae and both WC and CE were observed to adsorb to the larvae and larvae were orally ingested by perch. But whether or not the fish preferred Chironomidae larvae without algae attached to them could not be observed. Instant feeding was also random. Nevertheless, perch in the CE treatment seemed slightly more eager to feed than perch in WC, perhaps due to lower turbidity in the CE aquaria. This was especially obvious after new additions of CE and WC. Perch feeding behaviour have shown to be affected by turbidity, as they are dependent on their vision when foraging (Ljunggren & Sandström, 2007). However, if KAC13 filaments were ingested together with food items, the exposure would probably be enough for the fish to be affected if sensitive to toxin and /or cyanobacterial cells. No deviation in growth was recorded, which indicated healthy perch.
Lipopolysaccharides (LPS) from bacteria and cyanobacteria inhibit the activity of detoxication enzyme systems such as glutathione S-transferase (GST) in most organisms (reviewed by Stewart et al., 2006) including fish as found by Best et al. (2002) examining both zebra fish embryos and adults exposed to LPS from heterotrophic bacteria+MC and LPS from cyanobacteria+MC. When present together with toxins, e.g. crude extract, it has been shown to enhance the negative effects of
the toxin, which was shown by Pietsch et al. (2001). In the present study no such effect could be found, further supporting the hypothesis of “strong individuals”.
Metabolizing cyanotoxins is an energetically costly procedure increasing energy demands and possibly limit growth (Wiegand et al., 1999; Pietsch et al., 2001; Kamjunke et al., 2002; Pääkkönen et al., 2008). Perch exposed to crude extract and whole cells of N. spumigena in this experiment did not show any tendencies of this whatsoever. Nevertheless, no feeding experiment was conducted to disclose any differences in feeding behaviour or eventual increase in energy demand even though it would be of interest to carry out such an experiment.
The experimental length of 28 days may be too short for the growth to be affected when fish has reached the 1+ stage. On the other hand, a cyanobacterial bloom is not likely to prevail longer than a month period (Hansson, 2006) as triggering and duration of blooms are governed by a wide range of abiotic (nutrient concentration and ratios, salinity, hydrodynamics, temperature and weather conditions etc.) and biotic factors (grazing, competition, parasites etc.).
3.3.1 Weight of perch liver
Dry weight of perch livers in the CE treatment suggested a slightly higher weight when compared to WC and CoF, although not statistically significant (Fig. 12, one-way ANOVA, p>0.05). Only CE, WC and CoF were tested. The two treatments had an average liver dry weight of 38.7 ± 10.4 (CE) and 31.5 ± 13.4 mg (WC) weighed against the CoF dry weight of 34.4 ± 11.2. In the Co, on the other hand, the livers were much smaller with an average weight of 8.2 ± 2.4 mg. Looking at liver wet weight the relationship between treatments and controls were the same and, moreover, the liver dry weight in percent of liver wet weight revealed no differences whatsoever (data not shown).
CE WC Co CoF 0 10 20 30 40 50 60 L iv e r d w ( m g ) CE WC Co CoF
Fig. 12. Dry weight of isolated perch liver from the crude extract (CE) and the whole cell (WC)
treatments and controls not fed (Co) and fed (CoF) are shown (mean values± SD, n=25). One-way ANOVA were conducted excluding Co with no significant difference as result (p>0.05).
An enlarged liver could mean stress from toxin exposure (Kankaanpää et al., 2002; Best et al., 2003). Perch livers of various size and colours were observed during isolation. The healthy red colour liver could be seen in both control and treatments, as could a pale looking supposedly unhealthy liver. Whether or not it could be related to or be a symptom of the unknown disease appearing at the end of experiment remains unclear. However, as it was observed in treatments as well as in controls, no effect of Nodularia or its toxin could be found neither on liver weight nor morphology. This is in contrast to Best et al. (2003) that recorded liver enlargement in rainbow trout (Oncorhynchus mykiss) injected to the gut with LPS and exposed to Microcystis aeruginosa. In addition liver damage symptoms such as swollen liver found in sea trout (Salmo trutta) when injected with a mixture of N. spumigena cells and food as shown by Kankaanpää et al., (2002) was not evident here. On the other hand, no assessment of liver damage was conducted here and hence no conclusions could be made. The two latter studies are physiological studies with injections of Nodularia. In this experiment ecologically relevant concentrations and exposure of cyanobacteria have been used in an attempt to investigate its influence on perch growth.
3.4
Toxin analysis
Toxin in the WC treatment was not analysed even though samples were taken. However, based on a previous study of N. spumigena KAC13, the NODLN/chla ratio showed to be inversely related during a 14-day experiment as shown in Table 2 (Olofsson, 2007). The ratio varied between 0.3 and 1.2, hence yielding theoretical NODLN concentrations in the WC aquaria of approximately 8-85 µg L-1,considering the average chla concentration of 49 ± 22 in the WC treatment. Given the fact that NODLN is an intracellular toxin, most of it would probably be trapped in the cells with little exposure to the perch. Moreover, as the perch were fed Chironomidae larvae twice a day, they had no reason to feed on cyanobacterial filaments.
Table 2. NODLN and chla values for N. spumigena KAC13 during a previous 14-day
experiment, n=3 (Olofsson, 2007).
Days
KAC13 NODLN µg L-1
KAC13 chla
µg L-1 KAC13 NODLN/chla ratio
0 85 ± 1.8 71 ± 12 1.2 ± 0.2
9 126 ± 5.3 232 ± 66 0.5 ± 0.2
13 128 ± 6.6 525 ± 248 0.3 ± 0.2
NODLN was not detected in the liver samples in any of the treatments. In the crude extract samples, NODLN was only detected in a few samples at day 1 and day 9. However, these samples contained rather high amounts of NODLN ranging from 2.5 to 56.7 ng NODLN µl-1 crude extract (Table 3). Assuming there was no previous NODLN in the aquaria concentrations were estimated by multiplying the measured NODLN with volume added and divided with aquarium volume. It reveals a variation of 2 to 14 µg NODLN L -1 (Table 3).
Table 3. NODLN levels detected in the CE samples and the final concentration in these aquaria (mean
values, n=2). Theoretical concentration in the aquaria was 50 µg L-1 and n.d. =not detected. Days Sample volume µL Chla concentration mg L-1 NODLN ng µL-1 Limit of detection ng µL-1 Aquarium Vol added to aquaria ml NODLN in aquarium µg L-1 0 11 390 n.d. 0.14 All CE 20 n.d 1 53 50 20.59 0.03 CE1 20 10.3 CE5 20 2.7 1 65 40 5.43 0.03 CE11 20 2.7 CE13 22 8.2 1 44 60 14.99 0.04 CE19 18 6.7 9 27 96 n.d. 0.03 CE1 25 n.d. CE5 10 n.d. 9 15 200 n.d. 0.10 CE13 10 n.d. 9 30 85 56.73 0.05 CE11 10 14.2 9 100 26 2.52 0.02 CE19 30 1.9 15 10 290 n.d. 0.15 All CE 1-1.5 n.d. 16 10 280 n.d. 0.15 All CE 6.3-8 n.d. 20 10 250 n.d. 0.15 All CE 5.7-7.5 n.d. 21 20 160 n.d. 0.08 All CE 4.5-12 n.d. 22 15 200 n.d. 0.10 All CE 10 n.d. 26 20 140 n.d. 0.08 All CE 7-13 n.d. 27 20 200 n.d. 0.08 All CE 2.5-5.5 n.d.
The fact that very few of the CE samples contained NODLN suggests no harmful exposure of NODLN to perch in the CE treatment or at least limited exposure in time. This is shown by the absence of NODLN in the perch livers. Also noticeable is the growth result where perch from the CE treatment had as high or appear to have had even slightly higher growth rate, weight increase, dry weight and liver weight, although not statistically significant (Table 1, Fig. 10, 11, 12). On the other hand, the samples sent for analysis contained very little material, with volumes of not more than 100 µ L. In samples of less volume than 30 µ L, NODLN could not be detected thus there could be a possibility that these batches of CE still contained NODLN. But the low volume and little cyanobacterial material may not have been enough for detection. On the other hand, the method is sensitive with low detection limit. Nonetheless, in the former scenario, the exposure was inadequate to affect growth and in the latter, the perch were not susceptible. Further investigations are needed before, possibly, establishing susceptibility of 1+ perch. Calculations on sampling volumes were based on chla concentrations in turn based on previous experiments with N.
spumigena KAC13 toxin analysis (Olofsson, 2007) Limited amounts of crude extract also restrained the sampling. Instead larger volumes are proposed, equivalent to dry mass material needed for the analysis. The preparation of crude extract may also be necessary to improve. Nevertheless, considering the relative stability of NODLN in the environment (Torunska et al., 2008), the degradation of the toxin should not pose any problem during the procedure even though temperature is elevated when sonicating.
Here, regardless of treatment, no NODLN accumulated in the perch livers (detection limit 70.6 ng g -1 liver sample). In situ samples of fish like flounder (Platichthys flesus) from the Gulf of Finland and the Öresound (Sipiä et al., 2002; Persson et al, submitted), three-spined stickleback (Gasterosteus aculeatus) and herring (Clupea harengus membras) caught in the northern Baltic Sea (Sipiä et al., 2007) have all been found to accumulate NODLN. Cod (Gadus morhua) from the southern Baltic Sea has also shown to accumulate NODLN in liver tissue (Sipiä et al., 2001). Under laboratory conditions sea trout (Salmo trutta trutta) did accumulate NODLN when a mixture of N.spumigena cells and food was orally injected to the fish (Kankaanpää et al., 2002). A more ecologically relevant study was conducted in laboratory environment with juvenile three-spined sticklebacks either exposed or not to bloom condition of N. spumigena feeding on zooplankton fed N. spumigena filaments (Pääkkönen et al., 2008). In their study, NODLN content found in the whole body of investigated juvenile sticklebacks corresponded to NODLN found in sticklebacks collected from open sea. The experimental time was only 15 days, therefore the contrasting results in the present study are remarkable. On the other hand, three-spined stickleback juveniles were caught from a littoral zone in the Baltic Sea, where cyanobacterial blooms frequently occur and NODLN concentration decreased during the experiment actually suggesting no or little accumulation during the experiment itself. Even more important, the results from studies showing accumulation of NODLN in fish compared to the results from my experiment indicate that Nodularia or NODLN need to be ingested, which was not found in the present study. However, the rate at which fish detoxify NODLN occur within days while less toxic conjugates or detoxification products of NODLN are accumulated (Kankaanpää et al., 2002). In this toxin analysis desmethyl-nodularin (dmNOD) and metabolic products like glutathione (NOD-GSH and cysteine metabolites (NOD-Cys) were tested for but
nothing was found. Detection limit regarding these products could not be determined due to a lack of standard solutions.
3.5 Lipid analysis
Since the livers were isolated and sent for toxin analysis, lipids from perch livers were excluded from the analysis. No lipids were extracted from perch in the Co. The TL in the perch represented 2.5 ± 0.6, 2.3 ± 0.7 and 2.4 ± 0.7% of the wet weight for the treatments CE, WC and the control CoF respectively (Fig. 13.) Applying the one-way ANOVA, no significant differences were found (p>0.05).
The TL concentration in the 1+ perch investigated here did not appear to change when exposed to N. spumigena strain KAC13 and a crude extract of lysed cells.
CE WC CoF 1 1,5 2 2,5 3 3,5 4 4,5 5 % l ip id s o f w w CE WC CoF
Fig. 13. Total lipids (TL) extracted from perch exposed to treatments of crude extract (CE) and whole
cells (WC) compared to the fed control (CoF) in percent of wet weight did not record any significant differences (one-way ANOVA, p>0.05). Mean values ± SD are shown, n=25.
The conception about detoxication of NODLN as an energy demanding process and hence reduced energy reserves like lipids as a result was not confirmed here. Energy reserves normally required for growth may be used when metabolizing toxins in fish as concluded by Wiegand et al. (1999) and Pääkkönen et al. (2008) Again, if the actual toxin exposure was of significance the detoxifying processes in the perch, at least in the CE treatment, were not costly enough to affect the growth. Taken into account that perch had unlimited access to food this could possibly compensate for
increased energy demand. Feeding experiments could be a tool to reveal the relationship. Nonetheless, no signs of energetic cost in respect of TL could be observed here.
4 Conclusions
Perch juveniles at the age 1+ were not subjected to any recordable effects of the N. spumigena strain KAC13. Growth was not impaired, as expected, from neither crude extract nor live whole cells. Furthermore crude extract did not exert a more severe influence on perch growth than did whole cells. This was most likely due to low sensitivity of these perch to this N. spumigena strain caused by their age, i.e. the critical stage as y-o-y fish was probably exceeded and not as sensitive as eggs, larvae and younger juvenile fish. Additionally the low susceptibility suggests strong and healthy perch individuals. Annual blooms of cyanobacteria may influence growth and survival of y-o-y perch and hence the recruitment of juveniles to the adult population. However, the results imply that the growth of 1+ perch was not influenced by the presence of N. spumigena under bloom condition. Thus future studies may be directed to investigate the impact of N. spumigena on perch during the first growth season.
CE and WC treatments in this experiment did not influence NODLN accumulation in perch livers. Furthermore TL concentration in perch was not affected by the treatments. NODLN may have been detoxicated with no recorded energetic cost or, more likely, the toxin was not ingested. Studying other parameters on a molecular level such as proteins, RNA:DNA ratio, C:N relationship, proteins, enzyme activity etc. may reveal a negative effect on the physiological status of perch exposed to toxic cyanobacteria.
Considering the poor results of not detecting NODLN in the crude extract samples, it calls for an improved sampling procedure (larger volumes) and preparation of crude extract when carrying out experiments with cyanobacteria. It also constrains the ability to conclude whether or not crude extract of N. spumigena had an influence on the growth of perch. Nevertheless, fresh culture of N. spumigena KAC13 under bloom conditions did not have an effect on the perch investigated in this study.
5 Acknowledgement
I would like to thank my supervisors, Catherine Legrand and Patrik Stenroth, for valuable help, good advice and their patience, Per Larsson for help with the lipid extraction. Also thanks to Christina Esplund for the supply of culture and advice on culturing procedure.
Most of the people working in the laboratory at the marine division of the University of Kalmar have helped me in one way or the other, especially Andres Brutemark and Elin Lindehoff sharing of their experience. Thanks to Timmy Nyström that, together with Patrik Stenroth, helped me to catch the perch.
I appreciate the equipment and chemicals provided by Sara Gunnarsson and the practical input from Anders Månsson and Sven Bergh.
Finally Maria Rudström deserves a great deal of credit for assisting me throughout the experiment and giving constructive comments on the writing