Global, regional, and national disability-adjusted life-years
(DALYs) for 333 diseases and injuries and healthy life
expectancy (HALE) for 195 countries and territories,
1990–2016: a systematic analysis for the Global Burden of
Disease Study 2016
GBD 2016 DALYs and HALE Collaborators*
Summary
Background
Measurement of changes in health across locations is useful to compare and contrast changing
epidemiological patterns against health system performance and identify specific needs for resource allocation in
research, policy development, and programme decision making. Using the Global Burden of Diseases, Injuries, and
Risk Factors Study 2016, we drew from two widely used summary measures to monitor such changes in population
health: disability-adjusted life-years (DALYs) and healthy life expectancy (HALE). We used these measures to track
trends and benchmark progress compared with expected trends on the basis of the Socio-demographic Index (SDI).
Methods
We used results from the Global Burden of Diseases, Injuries, and Risk Factors Study 2016 for all-cause mortality,
cause-specific mortality, and non-fatal disease burden to derive HALE and DALYs by sex for 195 countries and territories
from 1990 to 2016. We calculated DALYs by summing years of life lost and years of life lived with disability for each
location, age group, sex, and year. We estimated HALE using age-specific death rates and years of life lived with disability
per capita. We explored how DALYs and HALE differed from expected trends when compared with the SDI: the geometric
mean of income per person, educational attainment in the population older than age 15 years, and total fertility rate.
Findings
The highest globally observed HALE at birth for both women and men was in Singapore, at 75·2 years
(95% uncertainty interval 71·9–78·6) for females and 72·0 years (68·8–75·1) for males. The lowest for females was
in the Central African Republic (45·6 years [42·0–49·5]) and for males was in Lesotho (41·5 years [39·0–44·0]). From
1990 to 2016, global HALE increased by an average of 6·24 years (5·97–6·48) for both sexes combined. Global HALE
increased by 6·04 years (5·74–6·27) for males and 6·49 years (6·08–6·77) for females, whereas HALE at age 65 years
increased by 1·78 years (1·61–1·93) for males and 1·96 years (1·69–2·13) for females. Total global DALYs remained
largely unchanged from 1990 to 2016 (–2·3% [–5·9 to 0·9]), with decreases in communicable, maternal, neonatal, and
nutritional (CMNN) disease DALYs offset by increased DALYs due to non-communicable diseases (NCDs). The
exemplars, calculated as the five lowest ratios of observed to expected age-standardised DALY rates in 2016, were
Nicaragua, Costa Rica, the Maldives, Peru, and Israel. The leading three causes of DALYs globally were ischaemic
heart disease, cerebrovascular disease, and lower respiratory infections, comprising 16·1% of all DALYs. Total DALYs
and age-standardised DALY rates due to most CMNN causes decreased from 1990 to 2016. Conversely, the total DALY
burden rose for most NCDs; however, age-standardised DALY rates due to NCDs declined globally.
Interpretation
At a global level, DALYs and HALE continue to show improvements. At the same time, we observe that
many populations are facing growing functional health loss. Rising SDI was associated with increases in cumulative
years of life lived with disability and decreases in CMNN DALYs offset by increased NCD DALYs. Relative compression
of morbidity highlights the importance of continued health interventions, which has changed in most locations in pace
with the gross domestic product per person, education, and family planning. The analysis of DALYs and HALE and
their relationship to SDI represents a robust framework with which to benchmark location-specific health performance.
Country-specific drivers of disease burden, particularly for causes with higher-than-expected DALYs, should inform
health policies, health system improvement initiatives, targeted prevention efforts, and development assistance for
health, including financial and research investments for all countries, regardless of their level of sociodemographic
development. The presence of countries that substantially outperform others suggests the need for increased scrutiny
for proven examples of best practices, which can help to extend gains, whereas the presence of underperforming
countries suggests the need for devotion of extra attention to health systems that need more robust support.
Funding
Bill & Melinda Gates Foundation.
Lancet 2017; 390: 1260–344*Collaborators listed at the end of the Article Correspondence to: Prof Simon Iain Hay, Institute for Health Metrics and Evaluation, Seattle, WA 98121, USA
Introduction
Objective measurement of population health is a fun
damental requirement of good governance that allows
international, regional, national, and local actors to frame
evidencebased policy informed by past trends and current
performance of health systems.
1–4Summary measures of
population health include techniques that measure the
overall burden of health loss due to fatal and nonfatal
diseases, as well as measures of expected fatal and non
fatal disease burden based on Sociodemographic Index
(SDI).
5The disabilityadjusted lifeyear (DALY) measures
health loss due to both fatal and nonfatal disease burden.
DALYs are the sum of the years of life lost (YLLs) due to
premature mortality and years of life lived with disability
(YLDs).
6The YLL is based on remaining life expectancy
when compared with a reference standard life table at age
of death,
7and the YLD is calculated by multiplying the
prevalence of a disease or injury and its main disabling
outcomes by its weighted level of severity.
6,8One DALY
represents 1 year of healthy life lost. Examination of levels
and trends of DALYs facilitates quick comparison between
different diseases and injuries. Conversely, healthy life
expectancy (HALE), a metric based on methods by
Sullivan,
9provides a single summary measure of popu
lation health across all causes combined by weighting
years lived with a measure of functional health loss before
death and is the most comprehensive among competing
expectancy metrics.
1–4Together, DALYs and HALE enable
comparisons of the magnitude of functional health loss
across societies due to diseases, injuries, and risk factors,
against which provisioning and performance of health
systems can be calibrated.
4Research in context
Evidence before this study
The Global Burden of Diseases, Injuries, and Risk Factors Study
2015 (GBD 2015) provided disability-adjusted
life-year (DALY) estimates for 315 diseases and injuries for
195 countries and territories, including subnational
assessments for 11 countries and, thus, for a total of
519 locations, from 1990 to 2015. GBD 2015 also introduced
analyses of DALYs and healthy life expectancy (HALE) in
relation to the Socio-demographic Index (SDI). Only the WHO
Global Health Estimates has published updated estimates of
DALYs, and these estimates were heavily reliant on GBD 2015
results.
Added value of this study
This study, the Global Burden of Diseases, Injuries, and Risk
Factors Study 2016 (GBD 2016), updates and improves the
first of the annual Global Burden of Disease iterations,
GBD 2015. GBD 2016 is, to our knowledge, the only
peer-reviewed, Guidelines for Accurate and Transparent Health
Estimates Reporting-compliant, comprehensive, and annual
assessment of DALYs and HALE by age group, sex, cause, and
location, analysed consistently from 1990 to 2016. The
improved approaches to the analysis and refinements in data
(gap fills, updates, and revisions), as well as the widening of
scope by cause, location, age, and time are all relevant to this
study. The summary population health metrics of DALYs and
HALE synthesise the cumulative effect of all of these
improvements, the most notable of which are as follows. First,
we added substantial location-years of cause-specific mortality
data and non-fatal data for GBD 2016. The added data
progressively fill gaps in the period of estimation, most
substantially for India. Second, many analytical methods have
been improved, such as improvement of mortality to incidence
ratios for cancers to better reflect lower survival than in
GBD 2015 and for non-fatal tuberculosis to better reflect
higher incidence in low-income and middle-income countries
based on SDI. Third, we included new subnational assessments
for Indonesia at the provincial level and further disaggregated
subnational estimation in England to the local government
area level. Fourth, we refined our estimation of age-specific
outcomes for ages 80 years and older into 5 year groups
extending to age 95 years and older to better account for
disease burden in elderly populations than in GBD 2015. Fifth,
we estimated DALYs for several additional causes for the first
time. Sixth, we improved our analysis of the epidemiological
transition as a function of SDI, which allowed for a more
nuanced interpretation of global health trends against the
sociodemographic development spectrum than in GBD 2015.
Finally, we used these analyses to identify the exemplar
countries that exceeded population health summary metric
expectations relative to their SDI position alone. The GBD 2016
iteration supersedes all previous GBD studies of DALYs and
HALE and re-estimates these measures for the complete time
series from 1990 to 2016. We focus on new methods and
approaches since GBD 2015 and highlight nations that
overperformed or underperformed on the basis of what would
be expected on the basis of their SDI.
Implications of all the available evidence
The epidemiological transition continues apace globally, with
a shift from DALYs attributable to communicable, maternal,
neonatal, and nutritional diseases to those attributable to
non-communicable diseases. This progression is concomitant
with improvements in SDI and thus improvements in
education, fertility rates, and economic status. A more
detailed analysis than in this study of the epidemiological
changes that have occurred in countries that have consistently
exceeded expectations could provide improved insights into
good practice in public health policy, which might be
emulated elsewhere. A similarly detailed appraisal of countries
that are lagging in DALYs and HALE relative to expectations
on the level of SDI alone will help identify countries in most
need of domestic and international attention across the
development continuum.
As the second in a series
7,8,10,11of now annual updates,
the Global Burden of Diseases, Injuries, and Risk Factors
Study 2016 (GBD 2016) is the most comprehensive and
current source of summary health metrics. The Global
Burden of Disease (GBD) is based on development of the
largest available database of health outcomes, risk factor
exposure, intervention coverage, and sociodemographic
factors related to health. We applied analytical techniques
to reduce data biases and support comparability, propa
gated the uncertainty in these estimates, and provided
insights at the highest temporal and spatial resolution
afforded by the data.
The purpose of this study is to present the results of
GBD 2016 for DALYs and HALE, building on updated
estimates of mortality, causes of death, and nonfatal
health loss
7,10to identify nations with notable variation in
health performance from that expected on the basis of
SDI. Approaches to the analysis have been previously
described.
2–4,12GBD 2016 improvements include addition
of newly available retrospective data, refined analytical
methods (such as improvement to mortality to incidence
ratios [MIRs] for cancers to better reflect lower survival in
lowincome and middleincome countries based on SDI),
new subnational estimation for England and Indonesia,
disaggregation of certain cause groupings to capture
greater detail, and expansion of older age groups to
enhance relevance for a wider range of health policy
decisions.
6Methods
Overview
We used the results of GBD 2016 to evaluate trends in
epidemiological patterns and health performance on a
global, regional, national, and subnational scale using
DALYs and HALE as summary measures of changes in
health states. Greater detail than presented in this section
for methods used to estimate DALYs and HALE,
including analytic approaches for assessment of relative
morbidity and mortality from individual diseases and
injuries, is provided in related publications in this
series
8,10and the appendix.
This analysis follows the Guidelines for Accurate and
Transparent Health Estimates Reporting,
13,14which include
recommendations on documentation of data sources,
estimation methods, and statistical analysis. We did
analyses using Python version 2.7.12 and 2.7.3, Stata
version 13.1, and R version 3.2.2. For more information on
Guidelines for Accurate and Transparent Health Estimates
Reporting compliance, please refer to the appendix
(pp 13–15). Additionally, interactive online tools are
available to explore GBD 2016 data sources in detail.
Causespecific estimation for GBD 2016 covers the years
1990–2016. For a subset of analyses, we focus on the last
decade, from 2006 to 2016, to address current policy
priorities. The GBD 2016 results for all years and by
location can be explored further with dynamic data
Cause and location hierarchies
In the GBD 2016 study, causes of mortality and morbidity
are structured with use of a fourlevel classification
hierarchy to produce levels that are mutually exclusive and
collectively exhaustive. GBD 2016 estimates 333 causes of
DALYs, 68 of which are a source of disability but not a
cause of death (such as trachoma, hookworm, and low
back and neck pain) and five of which are causes of death
but not sources of morbidity (sudden infant death
syndrome, aortic aneurysm, late maternal deaths, indirect
maternal deaths, and maternal deaths aggravated by
HIV/AIDS). Within each level of the hierarchy, the
number of collectively exhaustive and mutually exclusive
fatal and nonfatal causes for which the GBD study
estimates is three at Level 1, 21 at Level 2, 168 at Level 3,
and 276 at Level 4. The full GBD cause hierarchy, including
corresponding International Classification of Diseases
(ICD)9 and ICD10 codes, is detailed in GBD 2016
publications on causespecific mortality
10and nonfatal
health outcomes,
8with causespecific methods detailed in
the corresponding appendices.
The GBD study is organised by a geographical hierarchy
of seven superregions containing 21 regions, with
195 countries and territories nested within those regions.
12GBD 2016 included new subnational assessments for
Indonesia by province and for England by local govern
ment area. In this study, we present subnational data for
the five countries with a population greater than
200 million people in 2016: Brazil, China, India, Indonesia,
and the USA.
Estimation of mortality and non-fatal health loss
To estimate allcause and causespecific mortality, the
GBD study first systematically addressed known data
challenges—such as variation in coding of causes or
age group reporting, misclassification of deaths from
HIV/AIDS, or methods for incorporation of population
based cancer registry data—using standardised methods
described in detail in the GBD 2016 mortality
7and causes
of death
10publications. As noted in other GBD
publications, each death is attributed to a single underlying
cause in accordance with the ICD. We take steps to
standardise cause of death data to address the small
fraction of deaths that are not assigned an age or sex,
deaths assigned to broad age groups that are not 5 year
age groups, and various revisions and national variants of
the ICD. Additionally, we identify and redistribute deaths
assigned to ICD codes that cannot be underlying causes of
death, are intermediate causes of death rather than the
underlying causes, or lack specificity in coding.
10We
estimated causespecific mortality using standardised
modelling processes—most commonly, the Cause of
Death Ensemble model, which uses covariate selection
and outofsample validity analyses and generates
estimates for each locationyear, age, and sex.
10Additional
detail, including model specifications and data availability
See Online for appendix
For the online tools see http://ghdx.healthdata.org
For the data visualisations see https://vizhub.healthdata.org/
appendix of the GBD 2016 mortality
7and causes of death
10publications. We used the allcause mortality estimates to
establish a reference life table from the lowest death rates
for each age group among locations with total populations
greater than 5 million.
7From this reference life table, we
multiplied life expectancy at the age of death by cause
specific deaths to calculate causespecific YLLs. We then
used the GBD world population age standard to calculate
agestandardised rates for deaths and YLLs.
7The GBD
world population age standard and the standard life
expectancies are available in the appendix of the GBD 2016
mortality publication.
7Changes implemented since the Global Burden of
Diseases, Injuries, and Risk Factors Study 2015 (GBD 2015)
for causespecific mortality include incorporation of
substantial sources of new mortality data; important model
improvements for HIV, malaria, tuberculosis, injuries,
diabetes, and cancers; disaggregation of specific causes
into subgroupings to provide additional detail (the
following were all estimated separately for the first time:
alcoholic cardiomyopathy; urogenital, musculoskeletal,
and digestive congenital anomalies; Zika virus disease;
Guinea worm disease; selfharm by firearm; sexual
violence; myocarditis; and the following types of tuberc
ulosis: extensively drugresistant tuberculosis, multidrug
resistant tuberculosis without extensive drug resistance,
drugsusceptible tuberculosis, extensively drugresistant
HIV/AIDStuberculosis, multidrugresis
tant HIV/AIDS
tuberculosis without extensive drug resistance, and
drugsusceptible HIV/AIDStuberculosis); modelling of
anti retroviral therapy (ART) coverage for each location
year by CD4positive cell count at initiation; breakdown of
terminal age groups from 80 years and older to 80–84 years,
85–89 years, 90–94 years, and 95 years and older; expansion
of the GBD location hierarchy; and changes in the
calculation of SDI.
10The database for GBD 2016 now
includes data for the 333 causes estimated for DALYs and
new subnational units for Indonesia (n=34) and England
(n=150). For GBD 2016, we included substantial amounts
of additional data sources from new studies and our
network of collaborators; details of the types of data added
can be found in the GBD 2016 cause of death
10and non
fatal
8publications. Additionally, research teams did
systematic reviews to incorporate literature data into fatal
and nonfatal models. Further details on search strings are
available in the GBD 2016 nonfatal
8and cause of death
10publication appendices. The Registrar General of India
provided improved verbal autopsy data collected through
their Sample Registration System, enabling a more
detailed and thorough analysis of subnational data for
India than in GBD 2015. The methods for constructing the
SDI, initially developed for GBD 2015,
15were revised for
GBD 2016 to account for expansion in the number of
subnational estimates and the effect of a growing time
period of estimation given fixed limits for index
components.
10The components of SDI—total fertility rate
(TFR), educational attainment in the population aged older
than 15 years, and lagdistributed income (LDI)—are based
on new systematic assessments of educational attainment,
LDI, and fertility, and each component is scaled relative to
maximum effect on health outcomes.
10In most cases, we estimated nonfatal health loss using
the Bayesian metaregression tool DisModMR 2.1 to
synthesise variable data sources to produce internally
consistent estimates of incidence, prevalence, remission,
and excess mortality.
16Causespecific data availability
and epidemiological characteristics required additional
analytical techniques in some cases (details are available
in the appendix of the GBD 2016 nonfatal publication
8);
these causes include many neglected tropical diseases
(NTDs) such as dengue, as well as injuries, malaria, and
HIV/AIDS.
17,18We estimated each nonfatal sequela separately and
assessed the occurrence of comorbidity in each age group,
sex, location, and year separately using a microsimulation
framework. We distributed disability estimated for
comorbid conditions to each contributing cause during the
comorbidity estimation process. Although the distribution
of sequelae—and therefore the severity and cumulative
disability per case of a condition—can be different by age,
sex, location, and year, previous studies have found that
disability weights do not substantially vary across locations,
income, or levels of educational attainment.
19,20In the GBD
study, disability weights were based on population surveys
with 60 890 respondents and held invariant between
locations and over time.
20Additional details, including
model specifications and data availability for each cause
specific model and development of disability weights by
cause and their use in the estimation of nonfatal health
loss, are available in the appendix of the GBD 2016 non
fatal publication.
8For nonfatal estimation, several methodological
changes were made for GBD 2016. New data for the main
causes of YLDs were identified through our collaboration
with the Indian Council of Medical Research and the
Public Health Foundation of India. For particular risk
factors and diseases, the volume of available data
increased substantially, such as child growth failure
(stunting, wasting, or underweight), anaemia, congenital
anomalies, schistosomiasis, intestinal helminths, and
lymphatic filariasis. We have improved our analysis of
total admissions per person by country, year, age, and
sex, which facilitated incorporation of additional hospital
data sources that were previously excluded because of
incomplete knowledge of catchment population size. We
extended our analyses of linked USA medical claims data
to impute agespecific and sexspecific ratios for multiple
admissions per illness episode, ICD code appearance in
the nonprimary position, and inpatient versus outpatient
use.
8We applied each of the three ratios sequentially to
nonlinked hospital inpatient data from elsewhere that
only had a single ICD code per visit to adjust prevalence
and incidence data. We have incorporated more
predictive covariates into our nonfatal disease models to
better predict variation in disease levels rather than
measurement error as the source of variation, and we
improved our analysis of the MIRs for cancers, resulting
in considerably higher ratios in lower SDI quintiles and
thus substantially lower YLD estimates for cancer.
Estimation of DALYs, HALE, and corresponding
uncertainty
We calculated DALYs as the sum of YLLs and YLDs for
each cause, location, age group, sex, and year.
8,10The same
estimates of YLDs per person for each location, age, sex,
and year from 1990 to 2016 are used to establish HALE by
age group within abridged multipledecrement life tables
with use of methods developed by Sullivan.
9For all results, we report 95% uncertainty intervals (UIs)
derived from 1000 draws from the posterior distribution of
each step in the estimation process. Unlike confidence
intervals, UIs capture uncertainty from multiple modelling
steps, as well as from sources such as model estimation
and model specification, rather than from sampling error
alone. Uncertainty associated with estimation of mortality
and YLLs reflects sample sizes of data sources, adjustment
and standardisation methods applied to data, parameter
uncertainty in model estimation, and uncertainty within
allcause and causespecific mortality models. For esti
mation of prevalence, incidence, and YLDs, UIs incor
porated variability from sample sizes within data sources,
adjustments to data to account for nonreference def
initions, parameter uncertainty in model estimation, and
uncertainty associated with establishment of disability
weights. Because direct information about the correlation
between uncertainty in YLLs and YLDs was scarce, we
assumed that uncertainty in agespecific YLDs was
independent of agespecific YLLs or death rates.
Epidemiological transition and relationship between
DALYs, HALE, and SDI
For GBD 2016, the composite indicator of SDI was
again based on the geometric mean of three measures—
LDI per person, average years of schooling among
populations aged 15 years or older, and TFR—but the
analysis was strengthened in three important ways.
10First, we substantially revised estimates of education,
adding new data and improved methods for subnational
locations. Second, instead of using estimates of TFR
from the UN Population Division, we systematically
reviewed, extracted, and analysed fertility data from all
available locations to derive a time series of TFR for
each national and subnational GBD location.
7Third,
rather than rescaling SDI on the basis of the full range
of observed values within the time series, we developed
a fixed scale for GBD 2016; details on development of
this fixed scale are available in the GBD 2016 mortality
publication.
7We examined the average relationship
between DALYs, HALE, and SDI using a Gaussian
process regression model; we used these regressions to
at each level of SDI. Additional detail on SDI calculation
and locationspecific SDI values are available in the
appendix of the GBD 2016 mortality publication.
7Data sharing
The statistical code used in the entire process is available
through an online repository.
Role of the funding source
The funder of the study had no role in study design, data
collection, data analysis, data interpretation, or writing of
the report. The corresponding author had full access to
all the data in the study and had final responsibility for
the decision to submit for publication.
Results
Global levels of and trends for DALYs and HALE
The total number of allage DALYs in 2016 was
2·39 billion (95% UI 2·18 billion to 2·63 billion). Total
allage DALY counts for CMNN causes fell by 40·1%
(37·4–42·7) from 1·11 billion (1·07 billion to 1·16 billion)
in 1990 to 668 million (632 million to 708 million) in
2016, whereas total allage DALY counts from NCDs
increased by 36·6% from 1·07 billion (958 million to
1·20 billion) in 1990 to 1·47 billion (1·30 billion to
1·66 billion) in 2016 (table 1). Total DALYs from injuries
decreased by 1·6% (–3·8 to 6·2) from 260 million
(243 million to 277 million) in 1990 to 255 million
(236 million to 281 million) in 2016. Age groups older
than 80 years had 149 million (139 million to 159 million)
allage DALYs in 2016 compared with 75·1 million
(71·1 million to 79·5 million) in 1990, with increases
across all SDI quintiles. Of these, 87·8% were due to
NCDs in 2016 compared with 86·8% in 1990.
From 1990 to 2016, global HALE at birth increased
from 56·9 years to 63·1 years, with 160 of 195 locations
registering significant improvements. Global HALE
increased by an average of 6·24 years (95% UI
5·97–6·48) for both sexes combined. Globally, HALE at
birth increased from 55·38 years (53·27–57·31) in 1990
to 61·42 years (59·01–63·58) in 2016 for males and from
58·42 years (55·80–60·77) to 64·91 years (61·88–67·54)
for females, rising 6·04 years (5·74–6·27) for males and
6·49 years (6·08–6·77) for females (tables 2 and 3). The
total number of years of functional health lost (life
expectancy minus HALE) increased from 1990 to 2016,
from 8·22 years to 9·34 years. The gap between life
expectancy at birth and HALE, which represents years
of functional health lost, grew between 1990 and 2016
from 7·32 years (life expectancy 62·70 [62·42–62·99] vs
HALE 55·38 [53·27–57·31]) to 8·37 years (69·79
[69·29–70·22] vs 61·42 [59·01–63·58]) for males and
from 9·15 years (67·57 [67·33–67·77] vs 58·42
[55·80–60·77]) to 10·42 years (75·33 [74·95–75·64] vs
64·91 [61·88–67·54]) for females. Globally, in 2016, life
expectancy at age 65 years was 18·57 years (18·37–18·72)
For the statistical code see https://github.com/ihmeuw/ ihme-modeling
whereas HALE was 13·88 years (12·57–15·02) for
females and 11·87 years (10·83–12·80) for males.
HALE
increased by 1·96 years (1·69–2·13) from 11·92
(10·88–12·89) in 1990 for females and by 1·78 years
(1·61–1·93) from 10·09 years (9·22–10·87) for males.
Global trends for allage DALYs and agestandardised
DALY rates for Level 1 causes by SDI quintile are shown in
figure 1. Trends in total DALYs, which show the absolute
burden at each SDI quintile, are shown in figure 1A. The
figure highlights the large burden and subsequent declines
in lowmiddleSDI (decreased by 44·5% [95% UI
41·3–47·6]) and middleSDI (decreased by 56·2%
[53·6–59·0]) locations for CMNN DALYs from 1990 to 2016,
offset by large increases for NCD DALYs over the same
time period in lowmiddle SDI (increased by 54·4%
[47·9–60·8]) and middleSDI (increased by 36·5%
[39·9–32·8]) locations. Progress has been made in lowSDI
countries for CMNN DALYs, which decreased by 20·7%
(16·8–24·7) since 2006. At all levels of SDI, total NCD
DALYs have increased since 1990. Trends in age
standardised rates—which account for both population
size and age structure—emphasise the reduction in the
contribution of CMNN causes to DALYs, both over time
and with increasing SDI (figure 1B). These rapid decreases
in agestandardised rates were fastest at low SDI, where
agestandardised DALY rates from CMNN causes decreased
by 51·5% (49·0–54·1) between 1990 and 2016 to be on par
with agestandardised DALY rates for NCDs in 2016. At
lowmiddle SDI, agestandardised CMNN DALY rates were
more than double those for NCDs in 1990 (31·7 thousand
[30·3 thousand to 33·3 thousand] per 100
000), but
decreased to 14·1 thousand (13·2 thousand to 15·1 thousand)
per 100 000 in 2016. At all other levels of SDI, age
standardised DALY rates for CMNN causes were lower
than those for NCDs and lower than those of injuries in the
highSDI quintile. Reductions in agestandardised rates for
NCDs occurred across all levels of SDI between 1990 and
2016, a trend that was also evident, albeit less strongly, for
agestandardised DALY rates from injuries.
Global causes of DALYs
Agestandardised DALY rates for all causes decreased by
30·5% (95% UI 28·6–32·6) between 1990 and 2016
(appendix pp 49–62). In 2016, CMNN causes accounted
for 28·0% (26·4–29·7) of global DALYs, NCDs
contributed 61·4% (59·4–63·2), and injuries contributed
10·7% (10·1–11·3; appendix pp 35–48). From 2006 to
2016, CMNN causes decreased by 31·9% (29·7–34·2),
with 48 Level 4 CMNN causes experiencing decreases in
agestandardised DALY rates of greater than 20%
(table 1). Decreases were greater than 70% for
three infectious diseases: Guinea worm disease
(decreased by 99·6% [99·5–99·7]), human African
trypanosomiasis (decreased by 78·2% [68·8–84·6]), and
measles (decreased by 73·6% [68·8–77·8]). By contrast
with the overall trend of decreasing DALYs, a subset of
Level 4 CMNN causes had increases in agestandardised
DALY rates, including dengue (50·5% [24·7–97·7]) and
cutaneous and mucocutaneous leishmaniasis (12·5%
[1·7–26·1]). Overall, total allage DALYs attributable to
maternal disorders decreased by 23·9% (17·4–29·3)
between 2006 and 2016 and by 30·4% (24·4–35·4) in
terms of agestandardised DALY rates. As a cause group,
neonatal disorders decreased by 22·8% (18·9–26·8) in
allage DALYs and 23·1% (19·2–27·0) in terms of age
standardised DALY rates over the same time period;
however, this decrease was not significant for neonatal
sepsis. Total DALYs from the London Declaration NTDs
was 9·0 million (5·3 million to 14·5 million) in 2016.
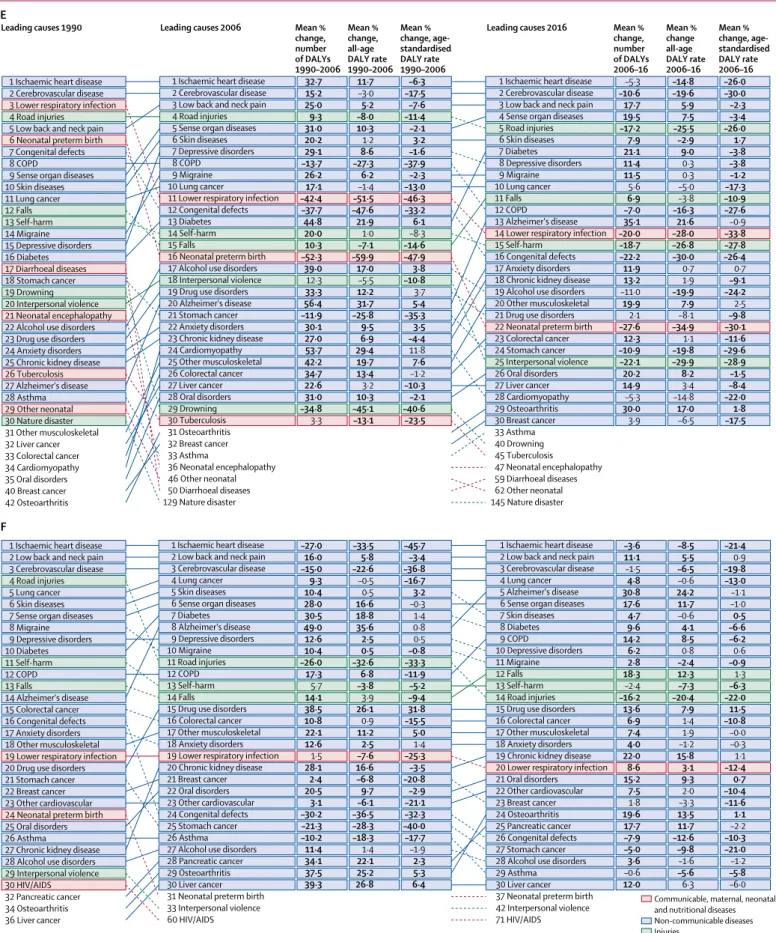
In 2016, the leading Level 3 causes of total DALYs
among NCDs included ischaemic heart disease
(175 million [95% UI 170 million to 180 million] DALYs),
cerebrovascular disease (116 million [111 million to
121 million]), and low back and neck pain (87 million
[61 million to 114 million]), comprising 16·1%
(13·99–17·67) of all DALYs
(table 1). Among chronic
respiratory diseases, all causes, with the exception of
interstitial lung disease, pulmonary sarcoidosis, and
other chronic respiratory diseases, decreased in age
standardised DALY rates between 2006 and 2016, whereas
total allage DALY counts increased from 2006 to 2016 for
all chronic respiratory diseases, with the exception of
silicosis. Cirrhosis and other chronic liver diseases had a
mean change of 7·6% (2·5–13·7) from 2006 to 2016 in
total allage DALY counts, but had a mean decrease in
agestandardised DALY rates of 12·0% (7·2–16·1) over the
same period. Agestandardised DALY rates of digestive
diseases decreased from 2006 to 2016, with a mean
percentage decrease of 13·6% (10·8–16·4); however, all
age DALY counts for digestive diseases increased by 4·1%
(0·4–7·7) over the same period. Total DALYs associated
with most neurological disorders increased from
2006 to 2016, with Alzheimer’s disease and other de
mentias (increase of 37·5% [35·3–39·7]) and Parkinson’s
disease (increase of 35·6% [32·9–38·2]) increasing by
more than 30% each. Between 2006 and 2016, various
NCDs significantly increased in terms of both total
burden and agestandardised DALY rates. Several mental
and substance use disorders followed this pattern,
including eating disorders (agestandardised DALY rates
increased by 8·9% [7·6–10·1]) and bipolar disorder
(increased by 0·8% [0·2–1·4]). Diabetes (allage DALY
count increased by 24·4% [22·7–26·2]) and chronic
kidney disease (increased by 20·0% [17·4–22·7]) both also
increased in allage DALY counts, as did musculoskeletal
disorders (increased by 19·6% [18·5–20·8]).
Percentage change in agestandardised DALY rates of
unintentional injuries (decreased by 15·1% [95% UI
12·2–18·0]), road injuries (decreased by 14·7% [12·8–16·8]),
and transport injuries (decreased by 14·3% [12·3–16·4])
each decreased substantially between 2006 and 2016
(table 1). Among unintentional injuries, drowning had the
largest reduction in both allage DALY burden (26·6%
[20·1–30·1]) and agestandardised DALY rates (32·1%
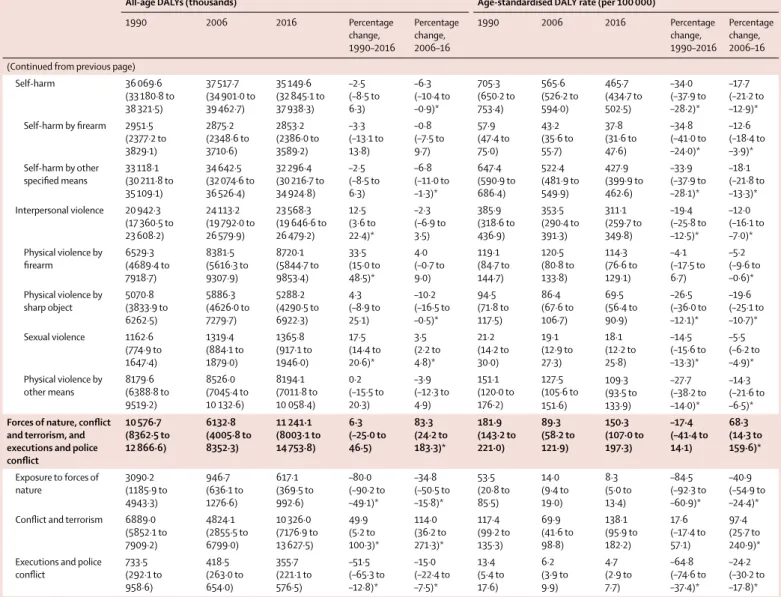
All-age DALYs (thousands) Age-standardised DALY rate (per 100 000) 1990 2006 2016 Percentage change, 1990–2016 Percentage change, 2006–16 1990 2006 2016 Percentage change, 1990–2016 Percentage change, 2006–16 All causes 2 448 430·5 (2 305 218·2 to 2 608 339·5) 2 490 698·9 (2 308 527·1 to 2 689 861·1) 2 391 258·0 (2 184 254·1 to 2 631 699·0) –2·3 (–5·9 to 0·9) –4·0 (–6·0 to –2·1)* 48 407·8 (45 385·4 to 51 762·0) 40 485·1 (37 556·0 to 43 679·3) 33 641·0 (30 808·7 to 36 924·3) –30·5 (–32·6 to –28·6)* –16·9 (–18·6 to –15·3)* Communicable, maternal,
neonatal, and nutritional diseases 1 114 176·6 (1 073 948·8 to 1 156 050·2) 918 804·8 (885 242·1 to 959 452·3) 667 823·7 (632 212·4 to 708 405·1) –40·1 (–42·7 to –37·4)* –27·3 (–29·8 to –24·9)* 18 071·6 (17 386·0 to 18 790·5) 13 801·1 (13 286·8 to 14 406·5) 9396·8 (8894·5 to 9956·2) –48·0 (–50·1 to –45·8)* –31·9 (–34·2 to –29·7)* HIV/AIDS and tuberculosis 84 184·5 (79 728·6 to 89 558·0) 159 063·9 (152 851·5 to 165 139·0) 101 133·3 (97 487·1 to 105 092·9) 20·1 (13·0 to 26·7)* –36·4 (–37·9 to –34·7)* 1788·1 (1690·1 to 1918·3) 2439·5 (2345·8 to 2531·5) 1355·2 (1306·2 to 1407·5) –24·2 (–29·7 to –20·1)* –44·5 (–45·7 to –43·0)* Tuberculosis 68 029·7 (64 153·4 to 73 066·3) 56 881·5 (54 312·6 to 59 442·6) 43 557·9 (41 529·0 to 45 716·5) –36·0 (–41·3 to –32·4)* –23·4 (–26·1 to –20·6)* 1480·1 (1390·4 to 1613·6) 916·5 (874·7 to 956·7) 593·1 (565·5 to 621·7) –59·9 (–63·7 to –57·7)* –35·3 (–37·6 to –32·9)* Drug-susceptible tuberculosis 67 560·5 (63 730·5 to 72 611·6) 51 760·2 (49 194·0 to 54 289·2) 39 869·8 (38 054·8 to 41 916·2) –41·0 (–45·6 to –37·5)* –23·0 (–25·7 to –20·0)* 1469·5 (1380·7 to 1603·6) 834·1 (791·6 to 873·6) 543·0 (517·8 to 571·1) –63·0 (–66·4 to –60·8)* –34·9 (–37·2 to –32·5)* Multidrug-resistant tuberculosis without extensive drug resistance 469·2 (378·3 to 578·8) 4886·9 (4122·2 to 5829·2) 3319·4 (2787·6 to 3910·3) 607·5 (511·8 to 717·0)* –32·1 (–38·5 to –24·8)* 10·6 (8·5 to 13·1) 78·7 (66·3 to 93·9) 45·1 (37·9 to 53·2) 327·6 (267·7 to 394·1)* –42·7 (–48·1 to –36·5)* Extensively drug-resistant tuberculosis ·· 234·5 (194·6 to 279·1) 368·8 (301·1 to 444·5) ·· 57·3 (36·1 to 82·1)* ·· 3·8 (3·1 to 4·5) 5·0 (4·1 to 6·0) ·· 32·5 (14·8 to 53·2)* Latent tuberculosis infection ·· ·· ·· ·· ·· ·· ·· ·· ·· ·· HIV/AIDS 16 154·8 (14 497·1 to 18 106·5) 102 182·3 (96 751·1 to 107 544·2) 57 575·4 (54 618·5 to 60 967·9) 256·4 (220·1 to 293·5)* –43·6 (–45·4 to –41·6)* 308·1 (276·2 to 345·6) 1522·9 (1443·6 to 1601·3) 762·1 (723·6 to 806·2) 147·4 (121·5 to 173·2)* –50·0 (–51·5 to –48·2)* Drug-susceptible HIV/AIDS-Tuberculosis 4668·5 (3624·4 to 5760·2) 24 070·5 (16 708·0 to 31 379·1) 11 724·0 (8154·4 to 15 522·4) 151·1 (116·8 to 191·3)* –51·3 (–54·0 to –48·6)* 88·2 (68·0 to 109·1) 359·7 (249·9 to 468·7) 155·5 (108·2 to 205·9) 76·2 (52·6 to 103·8)* –56·8 (–59·2 to –54·4)* Multidrug-resistant HIV/AIDS-Tuberculosis without extensive drug resistance 25·9 (16·0 to 40·6) 2051·8 (1282·8 to 3070·2) 979·2 (597·7 to 1481·6) 3673·4 (2732·2 to 4952·8)* –52·3 (–61·7 to –41·2)* 0·5 (0·3 to 0·8) 30·7 (19·2 to 45·8) 13·0 (7·9 to 19·7) 2486·4 (1853·0 to 3358·6)* –57·6 (–66·1 to –47·8)* Extensively drug-resistant HIV/AIDS-Tuberculosis ·· 39·9 (24·8 to 61·1) 57·3 (34·5 to 89·4) ·· 43·5 (25·5 to 65·4)* ·· 0·6 (0·4 to 0·9) 0·8 (0·5 to 1·2) ·· 26·8 (10·8 to 46·4)* HIV/AIDS resulting in other diseases 11 460·3 (9938·9 to 13 435·6) 76 020·0 (67 021·8 to 86 026·2) 44 814·9 (39 932·9 to 50 112·4) 291·1 (245·9 to 337·5)* –41·0 (–43·6 to –38·2)* 219·3 (189·8 to 257·4) 1131·9 (999·9 to 1280·9) 592·9 (528·6 to 663·0) 170·3 (138·2 to 203·1)* –47·6 (–49·9 to –45·1)* Diarrhoea, lower respiratory, and other common infectious diseases 557 388·0 (522 551·7 to 600 325·4) 337 062·8 (317 957·5 to 359 176·2) 229 961·4 (213 682·3 to 247 975·2) –58·7 (–61·9 to –55·2)* –31·8 (–35·3 to –27·8)* 8951·2 (8378·0 to 9601·7) 5152·7 (4858·8 to 5514·9) 3275·6 (3051·7 to 3531·8) –63·4 (–66·0 to –60·7)* –36·4 (–39·7 to –33·0)* Diarrhoeal diseases 175 168·6 (150 592·6 to 201 351·3) 113 944·8 (99 183·9 to 135 659·8) 74 414·6 (63 402·0 to 93 414·9) –57·5 (–62·8 to –50·1)* –34·7 (–41·0 to –28·1)* 2914·2 (2482·9 to 3469·2) 1768·5 (1526·0 to 2136·7) 1063·1 (907·5 to 1332·3) –63·5 (–67·6 to –58·3)* –39·9 (–45·2 to –34·3)* Intestinal infectious diseases 15 662·6 (8797·4 to 25 360·4) 12 822·7 (7207·6 to 20 879·4) 10 601·7 (6041·1 to 17 309·3) –32·3 (–43·5 to –21·8)* –17·3 (–25·1 to –10·8)* 249·7 (140·6 to 404·8) 184·6 (103·8 to 300·4) 144·3 (82·3 to 235·2) –42·2 (–51·5 to –33·7)* –21·9 (–29·4 to –15·6)* Typhoid fever 13 362·8 (7235·9 to 22 248·3) 10 793·8 (5876·4 to 17 717·0) 8843·0 (4901·5 to 14 436·1) –33·8 (–44·0 to –23·6)* –18·1 (–25·7 to –12·1)* 212·5 (115·0 to 353·9) 155·3 (84·8 to 254·0) 120·4 (66·6 to 196·8) –43·3 (–51·9 to –35·1)* –22·4 (–29·7 to –16·6)* Paratyphoid fever 1867·3 (850·2 to 3711·1) 1773·6 (826·8 to 3439·6) 1607·0 (759·0 to 3109·8) –13·9 (–27·1 to –1·5)* –9·4 (–17·9 to –1·8)* 30·6 (13·9 to 60·4) 25·6 (11·9 to 49·6) 21·7 (10·2 to 42·0) –29·0 (–39·4 to –19·2)* –15·1 (–22·9 to –8·0)* (Table 1 continues on next page)
All-age DALYs (thousands) Age-standardised DALY rate (per 100 000) 1990 2006 2016 Percentage change, 1990–2016 Percentage change, 2006–16 1990 2006 2016 Percentage change, 1990–2016 Percentage change, 2006–16 (Continued from previous page)
Other intestinal infectious diseases 432·5 (107·2 to 1290·8) 255·4 (58·5 to 753·4) 151·7 (42·1 to 412·1) –64·9 (–90·6 to 42·1) –40·6 (–84·7 to 126·3) 6·7 (1·7 to 19·5) 3·8 (0·9 to 11·2) 2·2 (0·6 to 5·9) –67·5 (–91·3 to 31·5) –42·9 (–85·2 to 114·5) Lower respiratory infections 202 365·5 (182 794·4 to 220 607·6) 131 015·4 (121 489·8 to 139 228·6) 91 844·6 (84 674·4 to 98 252·6) –54·6 (–58·7 to –49·4)* –29·9 (–34·4 to –25·3)* 3237·1 (2942·1 to 3515·4) 2022·6 (1879·0 to 2147·6) 1326·7 (1221·8 to 1419·7) –59·0 (–62·5 to –54·6)* –34·4 (–38·6 to –30·2)* Upper respiratory infections 4868·6 (3012·8 to 7444·9) 5551·2 (3380·7 to 8488·2) 5991·2 (3621·1 to 9193·8) 23·1 (19·0 to 26·3)* 7·9 (6·2 to 9·4)* 88·2 (54·9 to 134·0) 83·0 (50·8 to 126·9) 81·0 (49·0 to 124·0) –8·3 (–10·5 to –6·9)* –2·5 (–3·8 to –1·5)* Otitis media 3111·7 (2057·2 to 4485·0) 3171·4 (2005·0 to 4675·3) 3187·5 (1993·2 to 4716·5) 2·4 (–3·8 to 7·0) 0·5 (–2·1 to 3·0) 53·4 (35·3 to 76·9) 46·7 (29·6 to 68·9) 43·3 (27·1 to 64·2) –18·9 (–23·7 to –15·1)* –7·3 (–9·8 to –4·9)* Meningitis 30 239·3 (23 939·3 to 34 552·6) 24 957·4 (21 655·0 to 28 764·2) 21 865·9 (18 204·6 to 28 280·5) –27·7 (–41·7 to 3·1) –12·4 (–23·9 to 7·8) 481·8 (385·6 to 549·0) 369·9 (321·3 to 426·1) 306·1 (254·0 to 398·0) –36·5 (–48·5 to –9·7)* –17·2 (–28·1 to 2·1) Pneumococcal meningitis 2187·5 (1808·2 to 2576·0) 1940·0 (1649·9 to 2287·4) 1902·8 (1569·5 to 2382·2) –13·0 (–26·3 to 10·0) –1·9 (–11·5 to 12·0) 37·2 (31·0 to 43·4) 29·1 (24·8 to 34·2) 26·2 (21·6 to 32·7) –29·6 (–39·6 to –11·3)* –9·9 (–18·7 to 3·2) Haemophilus influenzae type B meningitis 3330·3 (2606·2 to 3982·2) 2725·7 (2276·3 to 3165·4) 2426·0 (1967·2 to 3212·2) –27·1 (–41·5 to 3·7) –11·0 (–23·9 to 9·3) 52·4 (41·5 to 62·0) 40·3 (33·7 to 46·8) 34·1 (27·6 to 45·1) –34·8 (–47·4 to –7·4)* –15·3 (–27·6 to 3·9) Meningococcal meningitis 14 191·0 (11 094·1 to 16 492·1) 11 548·6 (9913·5 to 13 418·2) 8327·1 (6806·4 to 10 911·9) –41·3 (–53·1 to –16·3)* –27·9 (–37·7 to –12·2)* 224·2 (177·0 to 259·3) 170·8 (146·7 to 199·1) 116·6 (95·2 to 152·9) –48·0 (–58·4 to –26·0)* –31·7 (–41·1 to –16·8)* Other meningitis 10 530·5 (8030·6 to 12 434·2) 8743·1 (7350·6 to 10 148·8) 9210·0 (7559·7 to 12 250·5) –12·5 (–30·3 to 28·9) 5·3 (–9·4 to 33·0) 168·1 (129·1 to 197·5) 129·7 (109·2 to 150·4) 129·2 (105·5 to 173·3) –23·1 (–38·2 to 12·4) –0·4 (–14·4 to 26·1) Encephalitis 7918·4 (5206·9 to 10 751·2) 7380·9 (6422·5 to 9033·9) 6704·1 (5469·3 to 8574·2) –15·3 (–44·0 to 40·6) –9·2 (–24·4 to 10·8) 135·5 (91·8 to 180·2) 111·5 (97·1 to 136·5) 92·7 (75·7 to 118·4) –31·6 (–53·6 to 10·0) –16·9 (–30·8 to 1·2) Diphtheria 842·7 (611·3 to 1167·2) 263·8 (183·1 to 374·7) 86·9 (62·5 to 123·4) –89·7 (–93·2 to –84·0)* –67·0 (–78·6 to –47·7)* 12·9 (9·4 to 17·9) 3·9 (2·7 to 5·6) 1·2 (0·9 to 1·8) –90·5 (–93·7 to –85·3)* –68·6 (–79·8 to –49·7)* Whooping cough 14 651·2 (6598·0 to 28 290·2) 9778·0 (4727·9 to 17 764·8) 6249·9 (3360·7 to 10 754·7) –57·3 (–77·1 to –19·2)* –36·1 (–63·1 to 17·1) 219·5 (98·9 to 424·0) 144·6 (69·9 to 262·6) 89·4 (48·1 to 153·9) –59·3 (–78·1 to –22·8)* –38·1 (–64·3 to 13·3) Tetanus 24 893·6 (14 235·3 to 33 445·8) 6340·9 (3695·4 to 7940·5) 2366·6 (1446·0 to 3062·9) –90·5 (–92·7 to –87·7)* –62·7 (–68·8 to –55·4)* 385·3 (222·8 to 516·6) 93·3 (54·4 to 116·8) 33·6 (20·3 to 43·4) –91·3 (–93·2 to –88·9)* –64·0 (–70·0 to –57·1)* Measles 76 350·8 (31 267·6 to 147 358·9) 20 794·3 (8237·6 to 43 871·3) 5724·8 (2148·6 to 12 257·6) –92·5 (–94·4 to –90·5)* –72·5 (–76·9 to –67·7)* 1150·7 (471·2 to 2220·4) 307·9 (122·0 to 649·2) 81·3 (30·5 to 174·2) –92·9 (–94·7 to –91·0)* –73·6 (–77·8 to –69·0)* Varicella and herpes
zoster 1314·9 (1138·7 to 1509·6) 1042·2 (909·6 to 1205·0) 923·5 (779·5 to 1098·7) –29·8 (–40·3 to –18·8)* –11·4 (–20·6 to –2·8)* 22·8 (19·8 to 25·9) 16·2 (14·1 to 18·9) 13·0 (11·0 to 15·4) –42·8 (–50·3 to –35·4)* –19·7 (–27·6 to –12·2)* Neglected tropical
diseases and malaria 87 294·8 (71 756·4 to 103 455·7) 99 229·2 (85 820·3 to 113 978·1) 74 995·1 (63 114·8 to 86 650·7) –14·1 (–31·0 to 6·2) –24·4 (–37·6 to –8·6)* 1423·8 (1183·4 to 1676·5) 1478·5 (1280·4 to 1696·3) 1050·5 (882·7 to 1217·9) –26·2 (–40·4 to –9·3)* –28·9 (–41·5 to –14·0)* Malaria 60 389·3 (46 548·2 to 74 912·5) 77 253·7 (64 810·3 to 91 256·8) 56 201·2 (45 785·6 to 67 880·8) –6·9 (–30·5 to 26·5) –27·2 (–43·3 to –6·7)* 931·0 (722·1 to 1150·5) 1147·0 (963·0 to 1354·6) 794·7 (646·5 to 962·2) –14·6 (–36·1 to 15·2) –30·7 (–46·2 to –11·1)* Chagas disease 309·8 (286·3 to 334·8) 226·1 (204·9 to 251·3) 219·0 (194·6 to 250·7) –29·3 (–34·4 to –23·7)* –3·1 (–8·2 to 2·7) 7·7 (7·1 to 8·3) 4·0 (3·7 to 4·5) 3·1 (2·8 to 3·6) –59·3 (–62·2 to –56·0)* –22·6 (–26·7 to –17·8)* Leishmaniasis 2531·5 (1470·2 to 4203·0) 1897·2 (1151·9 to 3064·4) 981·0 (658·3 to 1480·6) –61·2 (–67·2 to –52·0)* –48·3 (–54·0 to –39·6)* 45·7 (27·0 to 75·4) 28·4 (17·2 to 45·7) 13·4 (9·0 to 20·3) –70·6 (–74·9 to –64·1)* –52·6 (–57·7 to –44·9)* (Table 1 continues on next page)
All-age DALYs (thousands) Age-standardised DALY rate (per 100 000) 1990 2006 2016 Percentage change, 1990–2016 Percentage change, 2006–16 1990 2006 2016 Percentage change, 1990–2016 Percentage change, 2006–16 (Continued from previous page)
Visceral leishmaniasis 2406·1 (1350·5 to 4080·8) 1684·8 (943·7 to 2878·0) 707·9 (400·1 to 1206·2) –70·6 (–74·4 to –66·4)* –58·0 (–61·9 to –53·9)* 43·1 (24·4 to 72·6) 25·1 (14·1 to 42·9) 9·8 (5·5 to 16·6) –77·4 (–79·9 to –74·6)* –61·1 (–64·7 to –57·2)* Cutaneous and mucocutaneous leishmaniasis 125·3 (67·7 to 217·2) 212·4 (131·6 to 329·4) 273·1 (177·2 to 398·9) 117·9 (67·5 to 215·8)* 28·6 (16·8 to 42·9)* 2·6 (1·4 to 4·4) 3·3 (2·0 to 5·0) 3·7 (2·4 to 5·4) 43·5 (11·8 to 103·5)* 12·5 (1·7 to 26·1)* African trypanosomiasis 1046·8 (559·1 to 1711·5) 539·0 (288·0 to 876·8) 128·4 (64·7 to 215·0) –87·7 (–91·3 to –82·2)* –76·2 (–83·2 to –65·9)* 19·2 (10·3 to 31·6) 7·8 (4·2 to 12·8) 1·7 (0·9 to 2·9) –91·1 (–93·6 to –87·2)* –78·2 (–84·6 to –68·8)* Schistosomiasis 2096·8 (1340·2 to 3410·1) 2464·8 (1447·7 to 4194·7) 1863·6 (1122·0 to 3175·2) –11·1 (–17·5 to –6·7)* –24·4 (–26·2 to –21·9)* 42·8 (27·5 to 69·2) 37·5 (22·2 to 63·5) 24·9 (15·0 to 42·3) –41·9 (–46·3 to –38·9)* –33·7 (–35·4 to –31·6)* Cysticercosis 489·0 (363·4 to 621·4) 500·8 (359·2 to 657·1) 468·1 (322·8 to 625·8) –4·3 (–13·5 to 3·9) –6·5 (–12·4 to –0·9)* 10·5 (7·8 to 13·4) 8·0 (5·7 to 10·5) 6·3 (4·4 to 8·4) –40·0 (–45·2 to –35·0)* –21·0 (–26·0 to –16·5)* Cystic echinococcosis 326·8 (237·4 to 449·1) 226·2 (161·3 to 313·8) 136·5 (95·3 to 193·7) –58·2 (–68·4 to –44·3)* –39·6 (–53·9 to –16·3)* 6·3 (4·5 to 8·7) 3·5 (2·5 to 4·8) 1·8 (1·3 to 2·6) –70·6 (–77·7 to –61·1)* –46·6 (–59·1 to –26·5)* Lymphatic filariasis 1595·7 (733·4 to 2983·5) 1897·7 (873·9 to 3542·8) 1189·0 (587·7 to 2114·9) –25·5 (–41·4 to –9·3)* –37·4 (–52·4 to –26·0)* 32·5 (14·9 to 60·7) 28·9 (13·3 to 54·0) 15·8 (7·8 to 28·1) –51·5 (–61·8 to –41·2)* –45·3 (–58·4 to –35·5)* Onchocerciasis 1420·4 (777·0 to 2254·9) 1266·4 (705·0 to 2003·3) 962·5 (452·3 to 1672·1) –32·2 (–47·6 to –16·8)* –24·0 (–41·6 to –6·5)* 28·4 (16·0 to 45·4) 19·1 (11·0 to 30·1) 12·9 (6·1 to 22·4) –54·6 (–65·7 to –43·4)* –32·6 (–48·5 to –17·5)* Trachoma 231·1 (156·9 to 324·3) 246·5 (166·2 to 348·4) 245·2 (162·4 to 353·6) 6·1 (–2·6 to 14·6) –0·5 (–6·5 to 5·2) 6·7 (4·5 to 9·4) 4·9 (3·3 to 6·9) 3·7 (2·5 to 5·3) –44·3 (–49·0 to –39·6)* –23·8 (–28·5 to –19·3)* Dengue 822·8 (308·1 to 1364·0) 1798·2 (789·6 to 2494·8) 2956·9 (1359·2 to 4146·9) 259·4 (104·2 to 683·3)* 64·4 (36·2 to 115·9)* 13·9 (5·2 to 23·2) 26·7 (11·7 to 37·1) 40·2 (18·6 to 56·3) 189·0 (65·5 to 523·4)* 50·5 (24·7 to 97·7)* Yellow fever 784·5 (170·6 to 2314·6) 424·5 (89·8 to 1247·2) 374·0 (80·8 to 1075·1) –52·3 (–61·3 to –41·2)* –11·9 (–26·9 to 7·4) 13·2 (2·9 to 39·0) 6·1 (1·3 to 18·0) 5·0 (1·1 to 14·5) –61·8 (–68·5 to –52·9)* –17·1 (–31·3 to 1·3) Rabies 2979·4 (1867·4 to 4076·4) 1451·6 (867·1 to 1868·0) 744·2 (383·8 to 1106·3) –75·0 (–82·7 to –61·4)* –48·7 (–58·9 to –34·1)* 51·3 (32·6 to 71·3) 21·5 (12·9 to 27·5) 10·1 (5·2 to 15·1) –80·3 (–86·5 to –69·9)* –52·9 (–62·4 to –39·5)* Intestinal nematode infections 7460·9 (4726·6 to 11 584·0) 4083·3 (2617·1 to 6154·1) 3331·2 (2076·2 to 5158·6) –55·4 (–57·9 to –52·6)* –18·4 (–22·9 to –14·3)* 132·8 (83·2 to 206·9) 60·8 (39·0 to 91·6) 45·0 (28·2 to 69·6) –66·1 (–68·0 to –64·0)* –25·9 (–30·0 to –22·2)* Ascariasis 4634·7 (2996·9 to 7119·9) 1902·0 (1325·4 to 2758·9) 1308·8 (883·2 to 1942·4) –71·8 (–74·6 to –68·4)* –31·2 (–37·6 to –24·8)* 80·3 (51·4 to 124·0) 28·3 (19·8 to 41·1) 17·9 (12·1 to 26·4) –77·8 (–79·9 to –74·9)* –37·0 (–42·8 to –31·0)* Trichuriasis 671·4 (364·9 to 1142·9) 421·5 (233·0 to 717·2) 337·0 (186·2 to 573·6) –49·8 (–55·2 to –44·3)* –20·0 (–27·9 to –11·6)* 12·5 (6·8 to 21·2) 6·3 (3·5 to 10·7) 4·5 (2·5 to 7·7) –63·7 (–67·8 to –59·7)* –27·8 (–34·9 to –20·2)* Hookworm disease 2154·8 (1278·7 to 3371·1) 1759·8 (1058·9 to 2739·1) 1685·4 (1001·5 to 2648·9) –21·8 (–26·7 to –16·6)* –4·2 (–9·5 to 1·3) 40·0 (23·7 to 62·8) 26·2 (15·7 to 40·7) 22·6 (13·5 to 35·5) –43·4 (–47·2 to –39·6)* –13·5 (–18·2 to –8·5)* Food-borne trematodiases 1425·0 (591·7 to 2937·7) 1659·6 (832·5 to 3083·5) 1771·2 (923·9 to 3158·4) 24·3 (–3·9 to 71·7) 6·7 (1·3 to 15·7)* 27·9 (12·0 to 56·7) 25·4 (12·9 to 46·8) 23·7 (12·2 to 42·0) –15·3 (–34·0 to 13·1) –7·0 (–11·4 to 0·5) Leprosy 23·0 (15·5 to 32·3) 31·3 (21·3 to 44·0) 31·6 (21·4 to 44·0) 37·5 (34·0 to 40·9)* 1·1 (–1·3 to 3·6) 0·6 (0·4 to 0·8) 0·5 (0·4 to 0·8) 0·4 (0·3 to 0·6) –20·7 (–22·7 to –18·8)* –18·1 (–20·0 to –16·2)*
Ebola virus disease ·· ·· 0·3
(0·2 to 1·1)
·· ·· ·· ·· ·· ·· ··
All-age DALYs (thousands) Age-standardised DALY rate (per 100 000) 1990 2006 2016 Percentage change, 1990–2016 Percentage change, 2006–16 1990 2006 2016 Percentage change, 1990–2016 Percentage change, 2006–16 (Continued from previous page)
Zika virus disease ·· ·· 5·1
(3·4–8·0) ·· ·· ·· ·· 0·1 (0·0–0·1) ·· ··
Guinea worm disease 50·7 (35·3 to 69·2) 0·2 (0·1 to 0·3) ·· –100·0 (–100·0 to –100·0)* –99·5 (–99·7 to –99·4)* 1·1 (0·7 to 1·4) ·· ·· –100·0 (–100·0 to –100·0)* –99·6 (–99·7 to –99·5)* Other neglected tropical
diseases 3311·2 (2409·7 to 4421·6) 3262·2 (2470·4 to 4130·1) 3386·0 (2569·6 to 4260·7) 2·3 (–22·0 to 31·6) 3·8 (–14·9 to 23·9) 52·2 (38·2 to 69·0) 48·3 (36·6 to 61·2) 47·4 (35·9 to 59·7) –9·1 (–29·8 to 15·8) –1·9 (–19·5 to 17·3) Maternal disorders 21 597·1 (20 063·6 to 22 834·1) 18 093·0 (16 785·8 to 19 171·8) 13 763·0 (12 668·6 to 15 064·0) –36·3 (–41·3 to –31·0)* –23·9 (–29·3 to –17·4)* 388·6 (361·4 to 411·5) 257·2 (238·8 to 272·5) 179·0 (164·7 to 195·8) –53·9 (–57·6 to –50·2)* –30·4 (–35·4 to –24·4)* Maternal haemorrhage 6945·7 (5770·8 to 8257·7) 5416·4 (4627·6 to 6301·7) 4078·3 (3311·7 to 5035·2) –41·3 (–47·4 to –34·9)* –24·7 (–32·5 to –16·0)* 124·4 (103·1 to 148·1) 77·0 (65·8 to 89·7) 53·0 (43·1 to 65·4) –57·4 (–61·7 to –53·0)* –31·2 (–38·2 to –23·3)* Maternal sepsis and
other maternal infections 2102·5 (1614·0 to 2721·4) 1562·3 (1223·7 to 1984·3) 1139·4 (833·1 to 1525·2) –45·8 (–51·9 to –39·7)* –27·1 (–35·7 to –18·1)* 37·6 (29·0 to 48·2) 22·1 (17·3 to 28·0) 14·8 (10·9 to 19·8) –60·6 (–64·8 to –56·1)* –33·0 (–40·9 to –24·8)* Maternal hypertensive disorders 2469·0 (1945·4 to 3125·5) 2478·1 (1983·1 to 3052·0) 1996·8 (1569·9 to 2483·1) –19·1 (–26·0 to –11·2)* –19·4 (–27·3 to –11·1)* 44·0 (34·8 to 55·2) 35·1 (28·2 to 43·2) 26·0 (20·5 to 32·3) –40·9 (–45·8 to –35·4)* –25·8 (–33·1 to –17·9)* Maternal obstructed
labour and uterine rupture 1440·8 (1086·2 to 1865·8) 1240·4 (944·6 to 1582·8) 969·0 (716·6 to 1270·1) –32·8 (–37·4 to –27·7)* –21·9 (–27·4 to –15·9)* 27·0 (20·4 to 35·0) 17·9 (13·6 to 22·9) 12·6 (9·3 to 16·5) –53·3 (–56·5 to –50·0)* –29·5 (–34·5 to –24·1)* Maternal abortion,
miscarriage, and ectopic pregnancy 1743·4 (1338·9 to 2235·5) 1469·0 (1150·0 to 1845·5) 1145·1 (855·9 to 1541·6) –34·3 (–40·9 to –26·8)* –22·1 (–30·6 to –12·6)* 31·9 (24·6 to 40·6) 20·9 (16·4 to 26·3) 14·9 (11·1 to 19·9) –53·3 (–57·8 to –48·0)* –28·8 (–36·6 to –20·4)* Indirect maternal deaths 2611·6
(1943·4 to 3385·8) 2577·2 (1949·1 to 3277·1) 1987·9 (1463·8 to 2619·8) –23·9 (–30·7 to –16·4)* –22·9 (–30·1 to –14·8)* 47·0 (35·2 to 60·4) 36·7 (27·7 to 46·6) 25·8 (19·1 to 34·0) –45·0 (–49·7 to –39·9)* –29·6 (–36·2 to –22·1)* Late maternal deaths 374·2
(244·4 to 552·4) 298·2 (178·6 to 480·8) 228·5 (134·6 to 370·9) –39·0 (–50·1 to –28·8)* –23·4 (–29·9 to –16·2)* 6·7 (4·4 to 9·8) 4·2 (2·5 to 6·8) 3·0 (1·8 to 4·8) –55·8 (–63·7 to –49·2)* –29·9 (–35·5 to –23·5)* Maternal deaths aggravated by HIV/AIDS 36·9 (21·5 to 52·5) 128·5 (81·8 to 169·0) 105·4 (66·7 to 142·9) 185·9 (142·7 to 243·7)* –17·9 (–27·8 to –6·0)* 0·7 (0·4 to 0·9) 1·9 (1·2 to 2·4) 1·4 (0·9 to 1·9) 104·5 (73·6 to 146·1)* –26·1 (–35·0 to –15·3)* Other maternal disorders 3872·9
(3015·3 to 4777·9) 2923·1 (2365·7 to 3539·5) 2112·5 (1628·9 to 2673·2) –45·5 (–50·6 to –39·9)* –27·7 (–34·7 to –19·7)* 69·3 (54·4 to 84·9) 41·5 (33·6 to 50·0) 27·5 (21·2 to 34·8) –60·4 (–64·0 to –56·5)* –33·7 (–40·1 to –26·4)* Neonatal disorders 261 357·2 (248 875·2 to 282 758·2) 211 984·8 (203 477·1 to 221 317·2) 163 569·7 (154 643·2 to 172 756·7) –37·4 (–42·7 to –32·7)* –22·8 (–26·8 to –18·9)* 3818·4 (3635·3 to 4130·2) 3073·5 (2949·7 to 3208·5) 2364·2 (2237·5 to 2493·4) –38·1 (–43·2 to –33·5)* –23·1 (–27·0 to –19·2)*
Neonatal preterm birth
complications 112 767·2 (105 488·9 to 124 122·5) 81 159·7 (76 378·0 to 89 409·0) 62 031·6 (57 062·9 to 67 530·0) –45·0 (–50·3 to –39·5)* –23·6 (–29·9 to –17·4)* 1652·8 (1546·2 to 1819·4) 1176·6 (1107·3 to 1296·0) 892·7 (822·1 to 970·7) –46·0 (–51·2 to –40·7)* –24·1 (–30·4 to –18·1)* Neonatal encephalopathy
due to birth asphyxia, and trauma 68 251·9 (61 749·3 to 76 860·5) 60 334·8 (55 822·8 to 65 138·9) 47 031·7 (41 794·2 to 51 919·1) –31·1 (–41·3 to –20·8)* –22·1 (–29·3 to –14·6)* 993·0 (897·9 to 1117·7) 874·2 (808·8 to 943·9) 682·2 (606·6 to 751·3) –31·3 (–41·4 to –21·4)* –22·0 (–29·1 to –14·6)* Neonatal sepsis and
other neonatal infections 24 573·0 (18 972·5 to 31 156·6) 25 874·0 (21 266·6 to 32 360·3) 23 675·8 (20 056·0 to 30 684·5) –3·6 (–22·7 to 20·9) –8·5 (–19·1 to 4·0) 360·8 (278·4 to 460·0) 375·7 (308·9 to 469·6) 341·7 (291·0 to 444·5) –5·3 (–23·7 to 18·6) –9·0 (–19·5 to 3·2) Haemolytic disease and
other neonatal jaundice 12 277·3 (10 225·3 to 15 113·1) 7996·0 (7149·5 to 9006·9) 4912·8 (4310·5 to 5605·8) –60·0 (–69·1 to –50·4)* –38·6 (–46·2 to –30·3)* 179·9 (149·9 to 221·4) 116·1 (103·8 to 130·8) 70·7 (62·0 to 80·7) –60·7 (–69·6 to –51·4)* –39·1 (–46·6 to –30·8)* Other neonatal disorders 43 487·8
(37 402·4 to 50 951·9) 36 620·3 (33 314·2 to 40 250·5) 25 917·7 (23 440·4 to 28 405·4) –40·4 (–50·6 to –28·5)* –29·2 (–36·1 to –21·0)* 631·9 (543·4 to 740·9) 530·9 (483·0 to 583·6) 376·8 (340·8 to 413·1) –40·4 (–50·6 to –28·4)* –29·0 (–35·9 to –20·7)* (Table 1 continues on next page)
All-age DALYs (thousands) Age-standardised DALY rate (per 100 000) 1990 2006 2016 Percentage change, 1990–2016 Percentage change, 2006–16 1990 2006 2016 Percentage change, 1990–2016 Percentage change, 2006–16 (Continued from previous page)
Nutritional deficiencies 69 823·3 (57 049·4 to 85 126·9) 64 648·9 (51 489·2 to 80 980·6) 60 936·1 (46 656·8 to 79 062·8) –12·7 (–23·8 to –1·2)* –5·7 (–12·3 to 0·1) 1167·8 (949·2 to 1434·1) 971·1 (775·1 to 1213·5) 844·3 (649·4 to 1090·3) –27·7 (–35·9 to –19·1)* –13·1 (–18·9 to –7·7)* Protein-energy malnutrition 35 843·1 (29 589·9 to 41 569·5) 26 417·6 (23 896·5 to 29 406·0) 20 718·9 (18 009·6 to 24 194·8) –42·2 (–51·8 to –26·7)* –21·6 (–32·3 to –8·8)* 561·0 (467·3 to 647·0) 398·8 (361·7 to 443·4) 296·7 (258·1 to 346·4) –47·1 (–55·8 to –33·4)* –25·6 (–35·7 to –13·6)* Iodine deficiency 4355·1 (2983·7 to 6048·6) 3453·9 (2363·8 to 4790·9) 3240·6 (2213·3 to 4488·7) –25·6 (–28·2 to –22·9)* –6·2 (–8·7 to –3·5)* 84·5 (58·0 to 117·3) 52·4 (35·9 to 72·6) 43·5 (29·8 to 60·3) –48·5 (–50·2 to –46·7)* –16·9 (–19·2 to –14·5)* Vitamin A deficiency 188·5 (116·6 to 294·4) 225·3 (139·7 to 348·3) 252·4 (158·8 to 388·3) 33·9 (27·4 to 41·0)* 12·0 (8·7 to 15·5)* 3·2 (2·0 to 4·9) 3·4 (2·1 to 5·2) 3·4 (2·2 to 5·3) 7·0 (2·2 to 11·4)* 2·6 (–0·3 to 5·6) Iron-deficiency anaemia 27 097·5 (18 018·7 to 38 749·1) 32 422·9 (21 535·8 to 46 668·3) 34 841·8 (23 085·2 to 49 693·9) 28·6 (26·5 to 30·4)* 7·5 (6·2 to 8·9)* 475·7 (317·4 to 679·7) 482·7 (320·9 to 693·0) 474·1 (314·1 to 676·0) –0·3 (–1·5 to 0·7) –1·8 (–3·0 to –0·5)* Other nutritional deficiencies 2339·1 (1908·0 to 2766·9) 2129·2 (1791·2 to 2366·5) 1882·4 (1592·2 to 2158·7) –19·5 (–32·9 to 5·7) –11·6 (–20·4 to 0·7) 43·3 (36·7 to 50·2) 33·8 (28·4 to 37·4) 26·4 (22·4 to 30·3) –38·9 (–48·1 to –24·3)* –21·7 (–29·1 to –11·6)* Other communicable, maternal, neonatal, and nutritional diseases 32 531·7 (25 112·3 to 42 021·4) 28 722·2 (22 674·6 to 36 833·4) 23 465·1 (18 762·9 to 29 098·8) –27·9 (–36·2 to –18·6)* –18·3 (–25·2 to –10·6)* 533·7 (424·3 to 675·0) 428·7 (340·1 to 547·4) 328·0 (261·3 to 409·8) –38·5 (–44·8 to –31·3)* –23·5 (–29·8 to –16·4)* Sexually transmitted
diseases excluding HIV 16 447·6 (9960·1 to 25 590·4) 15 145·5 (9416·5 to 22 818·4) 12 016·0 (7764·9 to 17 118·7) –26·9 (–37·6 to –13·9)* –20·7 (–30·2 to –9·4)* 254·0 (157·8 to 389·9) 222·6 (138·7 to 335·0) 169·4 (108·1 to 242·8) –33·3 (–42·1 to –22·6)* –23·9 (–32·8 to –13·4)* Syphilis 14 613·8 (8275·0 to 23 755·0) 12 825·3 (7321·4 to 20 493·5) 9415·8 (5467·7 to 14 602·8) –35·6 (–45·5 to –23·1)* –26·6 (–35·8 to –14·9)* 217·9 (124·4 to 352·0) 188·3 (107·7 to 300·6) 135·5 (78·6 to 210·2) –37·8 (–47·4 to –25·8)* –28·1 (–37·1 to –16·8)* Chlamydial infection 425·2 (287·5 to 639·0) 519·6 (341·4 to 782·1) 562·4 (370·3 to 851·1) 32·3 (25·6 to 39·6)* 8·2 (5·9 to 10·4)* 8·0 (5·4 to 11·8) 7·5 (5·0 to 11·3) 7·3 (4·8 to 11·0) –8·6 (–14·2 to –3·4)* –3·3 (–5·6 to –1·4)* Gonococcal infection 465·0 (334·8 to 630·0) 582·3 (412·5 to 824·5) 675·2 (467·7 to 974·9) 45·2 (26·9 to 64·5)* 16·0 (10·3 to 21·8)* 9·2 (6·8 to 12·4) 8·6 (6·1 to 12·1) 8·8 (6·1 to 12·7) –4·3 (–17·1 to 9·2) 2·7 (–2·7 to 7·8) Trichomoniasis 125·7 (48·3 to 265·4) 170·9 (65·2 to 362·0) 198·2 (75·9 to 420·8) 57·7 (55·1 to 60·5)* 15·9 (14·8 to 17·1)* 2·5 (0·9 to 5·2) 2·5 (1·0 to 5·4) 2·6 (1·0 to 5·5) 4·7 (3·6 to 5·8)* 1·8 (0·9 to 2·7)* Genital herpes 132·8 (43·0 to 302·2) 187·9 (61·0 to 428·1) 221·4 (71·2 to 507·1) 66·8 (61·5 to 70·0)* 17·8 (15·5 to 19·7)* 2·9 (0·9 to 6·6) 3·0 (1·0 to 6·8) 3·0 (1·0 to 6·8) 2·9 (1·3 to 4·8)* –0·2 (–1·6 to 1·5) Other sexually transmitted diseases 685·1 (474·3 to 964·9) 859·5 (589·4 to 1221·9) 943·0 (643·7 to 1349·4) 37·6 (30·6 to 44·7)* 9·7 (7·4 to 12·2)* 13·5 (9·4 to 18·9) 12·6 (8·7 to 17·9) 12·3 (8·4 to 17·6) –8·7 (–13·7 to –4·0)* –2·6 (–4·8 to –0·4)* Hepatitis 9017·2 (8255·1 to 9723·9) 7718·6 (7259·2 to 8169·0) 5777·8 (5492·2 to 6078·9) –35·9 (–41·5 to –30·1)* –25·1 (–29·2 to –21·0)* 163·7 (151·1 to 175·3) 117·8 (111·0 to 124·6) 78·6 (74·8 to 82·7) –52·0 (–55·9 to –48·3)* –33·3 (–36·8 to –29·6)* Acute hepatitis A 1271·9 (1017·1 to 1540·7) 849·3 (677·0 to 1036·3) 450·7 (364·0 to 544·8) –64·6 (–72·1 to –55·0)* –46·9 (–58·9 to –32·0)* 19·5 (15·7 to 23·5) 12·6 (10·1 to 15·3) 6·4 (5·2 to 7·8) –67·1 (–74·0 to –58·4)* –49·0 (–60·6 to –34·6)* Hepatitis B 4656·5 (4209·1 to 5096·9) 4373·2 (4013·0 to 4741·4) 3823·8 (3543·7 to 4119·0) –17·9 (–24·6 to –10·7)* –12·6 (–17·9 to –7·0)* 94·2 (86·2 to 102·2) 68·7 (63·5 to 74·3) 51·6 (47·9 to 55·6) –45·2 (–49·2 to –40·9)* –24·9 (–29·2 to –20·4)* Hepatitis C 88·4 (72·0 to 107·8) 90·9 (73·8 to 112·2) 83·7 (66·3 to 104·2) –5·3 (–17·1 to 7·5) –7·9 (–17·6 to 3·0) 1·8 (1·5 to 2·3) 1·5 (1·2 to 1·9) 1·1 (0·9 to 1·4) –37·1 (–44·2 to –29·1)* –22·3 (–30·4 to –13·0)* Acute hepatitis E 3000·4 (2479·7 to 3449·1) 2405·2 (2090·1 to 2702·9) 1419·6 (1230·3 to 1610·1) –52·7 (–60·4 to –44·5)* –41·0 (–47·5 to –33·9)* 48·1 (40·0 to 55·0) 35·1 (30·5 to 39·4) 19·4 (16·9 to 22·0) –59·6 (–65·9 to –52·9)* –44·6 (–50·6 to –38·0)* (Table 1 continues on next page)