Wang, H., Bhutta, Z., Coates, M M., Coggeshall, M., Dandona, L. et al. (2016)
Global, regional, national, and selected subnational levels of stillbirths, neonatal, infant, and
under-5 mortality, 1980-2015: a systematic analysis for the Global Burden of Disease Study
2015.
The Lancet, 388(10053): 1725-1774
https://doi.org/10.1016/S0140-6736(16)31575-6
Access to the published version may require subscription.
N.B. When citing this work, cite the original published paper.
Permanent link to this version:
of Disease Study 2015
GBD 2015 Child Mortality Collaborators*
Summary
Background
Established in 2000, Millennium Development Goal 4 (MDG4) catalysed extraordinary political,
fi nancial, and social commitments to reduce under-5 mortality by two-thirds between 1990 and 2015. At the
country level, the pace of progress in improving child survival has varied markedly, highlighting a crucial need to
further examine potential drivers of accelerated or slowed decreases in child mortality. The Global Burden of
Disease 2015 Study (GBD 2015) provides an analytical framework to comprehensively assess these trends for
under-5 mortality, age-specifi c and cause-specifi c mortality among children under 5 years, and stillbirths by
geography over time.
Methods
Drawing from analytical approaches developed and refi ned in previous iterations of the GBD study, we
generated updated estimates of child mortality by age group (neonatal, post-neonatal, ages 1–4 years, and under 5)
for 195 countries and territories and selected subnational geographies, from 1980–2015. We also estimated numbers
and rates of stillbirths for these geographies and years. Gaussian process regression with data source adjustments
for sampling and non-sampling bias was applied to synthesise input data for under-5 mortality for each geography.
Age-specifi c mortality estimates were generated through a two-stage age–sex splitting process, and stillbirth
estimates were produced with a mixed-eff ects model, which accounted for variable stillbirth defi nitions and data
source-specifi c biases. For GBD 2015, we did a series of novel analyses to systematically quantify the drivers of
trends in child mortality across geographies. First, we assessed observed and expected levels and annualised rates
of decrease for under-5 mortality and stillbirths as they related to the Soci-demographic Index (SDI). Second, we
examined the ratio of recorded and expected levels of child mortality, on the basis of SDI, across geographies, as
well as diff erences in recorded and expected annualised rates of change for under-5 mortality. Third, we analysed
levels and cause compositions of under-5 mortality, across time and geographies, as they related to rising SDI.
Finally, we decomposed the changes in under-5 mortality to changes in SDI at the global level, as well as changes in
leading causes of under-5 deaths for countries and territories. We documented each step of the GBD 2015 child
mortality estimation process, as well as data sources, in accordance with the Guidelines for Accurate and Transparent
Health Estimates Reporting (GATHER).
Findings
Globally, 5·8 million (95% uncertainty interval [UI] 5·7–6·0) children younger than 5 years died in 2015,
representing a 52·0% (95% UI
50·7–53·3) decrease in the number of under-5 deaths since 1990. Neonatal deaths
and stillbirths fell at a slower pace since 1990, decreasing by 42·4% (41·3–43·6) to 2·6 million (2·6–2·7) neonatal
deaths and 47·0% (35·1–57·0) to 2·1 million (1·8-2·5) stillbirths in 2015. Between 1990 and 2015, global under-5
mortality decreased at an annualised rate of decrease of 3·0% (2·6–3·3), falling short of the 4·4% annualised rate
of decrease required to achieve MDG4. During this time, 58 countries met or exceeded the pace of progress required
to meet MDG4. Between 2000, the year MDG4 was formally enacted, and 2015, 28 additional countries that did not
achieve the 4·4% rate of decrease from 1990 met the MDG4 pace of decrease. However, absolute levels of under-5
mortality remained high in many countries, with 11 countries still recording rates exceeding 100 per 1000 livebirths
in 2015. Marked decreases in under-5 deaths due to a number of communicable diseases, including lower respiratory
infections, diarrhoeal diseases, measles, and malaria, accounted for much of the progress in lowering overall
under-5 mortality in low-income countries. Compared with gains achieved for infectious diseases and nutritional
defi ciencies, the persisting toll of neonatal conditions and congenital anomalies on child survival became evident,
especially in low-income and low-middle-income countries. We found sizeable heterogeneities in comparing
observed and expected rates of under-5 mortality, as well as diff erences in observed and expected rates of change for
under-5 mortality. At the global level, we recorded a divergence in observed and expected levels of under-5 mortality
starting in 2000, with the observed trend falling much faster than what was expected based on SDI through 2015.
Between 2000 and 2015, the world recorded 10·3 million fewer under-5 deaths than expected on the basis of
Lancet 2016; 388: 1725–74
This online publication has been corrected. The corrected version first appeared at thelancet.com on January 5, 2017
See Editorial page 1447 See Comment pages 1448 and 1450
*Collaborators listed at the end of the Article
Correspondence to: Dr Haidong Wang, Institute for Health Metrics and Evaluation, University of Washington, Seattle, WA 98121, USA
Introduction
Substantial reductions in under-5 mortality have
occurred worldwide during the past 35 years, with every
region recording sizeable improvements in child
survival.
1–8National rates of decrease have varied
substantially,
1,5which has been attributed to rising levels
of income per person;
9,10greater educational attainment,
especially in women of reproductive age;
11,12lower
fertility rates; strengthened public health programmes;
and overall improvements in health technologies and
systems.
13Many view the development and scale-up of
many life-saving interventions targeting various leading
causes of under-5 deaths
14as primary accelerants of
child survival during this time, including
insecticide-treated nets,
15,16artemisinin-based combination
therapies,
17the prevention of mother-to-child
trans-mission of HIV,
18and a number of vaccines, such as for
measle s and rotavirus and the pneumococcal conjugate
vaccine.
19Further, expanding the provision of more
long-standing inter ventions, such as oral rehydration
therapy for diarrhoeal diseases or antibiotics for
pneumonia, and addressing environmental risks, such
as water and sanitation, probably contributed to
reductions in under-5 mortality in many places.
20,21Amid
such advances were increased domestic funding
and development assistance for health, particularly
fi nancing mechanisms, is vital to charting the pathways for ultimately ending preventable child deaths by 2030.
Funding
Bill & Melinda Gates Foundation.
Copyright
© The Author(s). Published by Elsevier Ltd. This is an Open Access article under the CC BY license.
Research in context
Evidence before this study
The Global Burden of Disease (GBD) study has a long history of
generating comprehensive, comparable estimates of child
mortality, and has continually refi ned current methods or
developed new analytical approaches to maximise a full range
of data sources and systems that track child survival. For the
2013 iteration of GBD, we evaluated the relative contributions
of diff erent factors, including number of births and education
levels, to changes in under-5 mortality from 2000 to 2013.
In recent years, several studies have sought to assess drivers of
changes in child mortality, such as postulating trends caused by
a subset of causes and indicators of technical progress.
A shortcoming of these past approaches is that estimates of
under-5 mortality levels and trends are typically produced
within separate analytical frameworks, rather than unifi ed
estimation systems. GBD 2015 child mortality analyses feature
several advances from previous rounds of the GBD, including
an expanded set of territories and subnational geographies,
additional causes, and critical examinations on the
measurement and impact of changes in sociodemographic
status on child survival.
Added value of this study
The GBD assessment of child mortality provides timely,
robust evidence on documenting child health achievements
during the Millennium Development Goal era, identifying
causes and regions for which less progress occurred,
development and child survival. Estimates of child mortality
by age (neonatal, post-neonatal, 1–4 years, and under-5), sex,
and cause over time now include 519 geographies, a notable
increase from the 264 included in GBD 2013. The under-5
mortality database has increased greatly since GBD 2013, and
we implemented several methodological improvements,
including data bias adjustments by data source and data type.
For the fi rst time, we estimated the number and rates of
stillbirths across geographies and over time. Further, this
analysis applies measures of Socio-demographic Index (SDI), a
composite measure of income per person, educational
attainment, and fertility for every geography year, to examine
the association between changes in child mortality and
improving levels of development.
Implications
This study provides the most comprehensive assessment so
far of levels and trends of child mortality worldwide, linking
recorded rates of change in under-5 mortality with expected
rates of decrease based on SDI alone. Through a series of
decomposition analyses, we identify which groups of causes
contribute most to reductions in under-5 mortality across
regions and the development spectrum. Comparisons of
recorded levels and cause composition for child mortality with
patterns expected based on SDI alone off er an in-depth,
nuanced picture of where countries might need to refocus
policies and resource allocation for accelerated improvements
Despite such progress, most low-income and
middle-income countries (LMICs) did not achieve the MDG4
target of reducing under-5 mortality by two-thirds
between 1990 and 2015, which equates to a
4·4% annualised rate of decrease during this time.
5From
1990 to 2000, the global rate of decrease for under-5
mortality averaged 2·0% (1·7–2·4) per year, and previous
forecasts by the UN Inter-agency Group for Child
Mortality Estimation (IGME) suggested that 62 of
195 countries would achieve MDG4 by 2015.
5Further, at
the global level, IGME estimated that MDG4 would be
missed by 14 percentage points (ie, a 53% decrease in
under-5 mortality between 1990 and 2015). The degree to
which countries diverged in their pace of progress has
prompted extensive debate and refl ection on the various
drivers of child health, including absolute and relative
funding levels,
25overarching governance,
26health-system
effi
ciencies,
27and implementation of optimum
inter-vention packages and specifi c health programmes.
13,28Further, the relative eff ect of gains in sociodemographic
status, advances in medical technologies, and reductions
in cause-specifi c mortality remains contested. Previous
studies postulate the eff ects of cause-specifi c death
patterns on national trends in under-5 mortality,
7,29and
others have sought to isolate the eff ect of broader factors,
including income per person and education.
30However,
few studies, if any, have systematically attributed changes
in mortality due to leading causes of child deaths, as well
as gains in overall development, across geographies and
over time.
Enhanced estimation methods, as well as increased
quantity and quality of data, not only show large
disparities in under-5 mortality across and within
countries,
1,5,31,32but also emphasise distinct variations in
survival by age group and cause among children
younger than 5 years.
1,14,33,34Previous studies report much
slower decreases in mortality rates for neonates, or
children younger than 28 days, than those recorded for
post-neonates and children aged 1 to 4 years.
1,33These
fi ndings have prompted a heighted focus on newborn
health,
35especially around the types of interventions
and health services that might accelerate reductions in
neonatal mortality.
36–38Systematic disaggregation of
levels and trends in neonatal mortality, particularly at
subnational levels, can help focus local needs and
strategies for improving newborn health. Recent
analyses also bring renewed attention to late fetal and
intrapartum deaths, known as stillbirths.
39,40Especially
in low-income areas, higher stillbirth rates have been
and within populations.
In 2015, the MDGs were replaced by the more
all-encompassing, albeit less health-focused, Sustainable
Development Goals (SDGs).
41SDG3.2 is the main
indicator for improving child survival, with targets of
reducing under-5 mortality to fewer than 25 deaths per
1000 livebirths, decreasing neonatal mortality to fewer
than 12 deaths per 1000 livebirths, and ending
preventable deaths of newborns and children younger
than 5 years, all by 2030. In view of these ambitious
global goals, and the highly heterogeneous trends
recorded in absolute and relative child mortality trends
in the past, it is crucial to comprehensively assess
factors that aff ected mortality trends in the past and to
identify which ones might further improve child
survival in the future.
The 2015 iteration of the Global Burden of Diseases,
Injuries, and Risk Factors Study (GBD 2015) provides the
analytical framework from which reductions in child
mortality can be thoroughly examined by age, geography,
and cause over time. For GBD 2015, we analyse rates of
under-5 mortality disaggregated by age group, as well as
stillbirths, for 195 countries and territories from 1980 to
2015; however, much of this paper focuses on results
between 1990 and 2015, aligning with the period of time
covered by MDG4. Expanding on subnational analyses
done for GBD 2013, we provide estimates of levels and
trends in under-5 mortality at subnational levels for
Brazil, China, India, Japan, Kenya, Mexico, Saudi Arabia,
South Africa, Sweden, the UK, and the USA. Through a
series of decomposition analyses and assessments
of child mortality in relation to measures of
sociodemographic status, we quantify diff erences in
observed and expected gains in child survival given
changes in development alone.
Methods
The methods used to generate estimates of under-5
mortality and age-specifi c death rates (early neonatal, late
neonatal, post-neonatal, ages 1–4 years, infant, and
under 5), contribute to broader GBD 2015 analyses and
results on all-cause mortality and cause of death.
Substantial detail on data inputs, processing, and
estimation methods can be found in an accompanying
GBD 2015 publication.
14Here we provide a brief summary
of our under-5 mortality estimation approach and
accompanying analyses, including an assessment of
mortality trends by Soci-demographic Index (SDI), and
attribute changes in under-5 mortality to leading causes
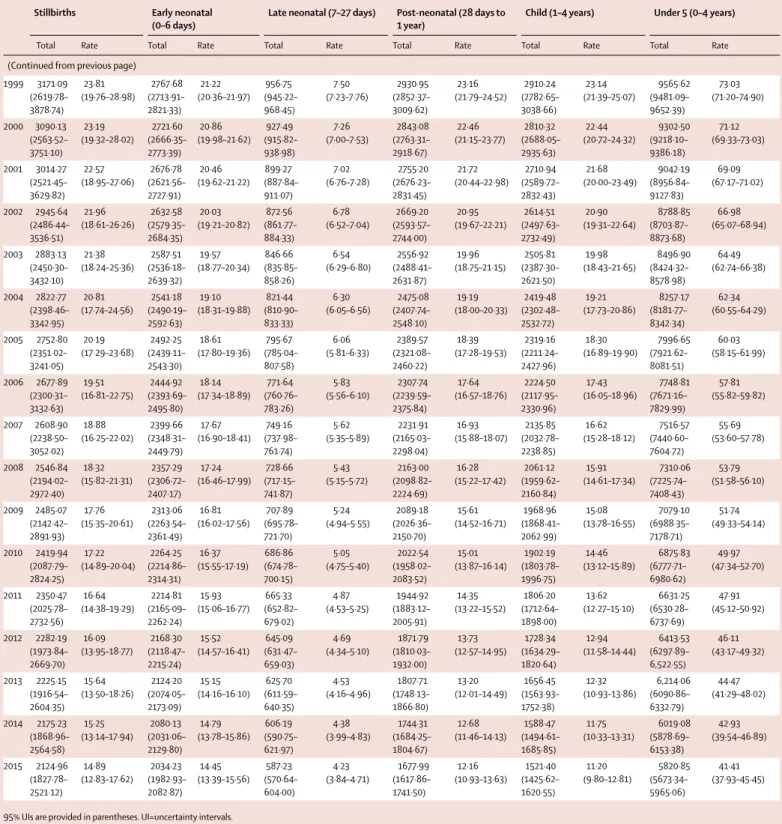
1981 4517·94 (3310·03– 6209·80) 34·48 (25·52–46·83) 3456·63 (3383·42– 3523·71) 27·24 (25·92–28·43) 1516·58 (1500·77– 1533·26) 12·29 (11·88–12·70) 4405·81 (4300·90– 4506·72) 36·47 (34·08–38·77) 4538·98 (4366·43– 4710·35) 39·67 (36·41–43·14) 13 918·00 (13 796·26– 14 056·49) 110·97 (108·04–114·26) 1982 4477·11 (3322·49– 6157·15) 33·62 (25·19–45·70) 3450·41 (3378·35– 3516·82) 26·74 (25·45–27·90) 1490·82 (1474·30– 1507·34) 11·88 (11·47–12·31) 4339·21 (4235·45– 4441·98) 35·33 (32·94–37·59) 4,434·38 (4267·06– 4598·46) 38·34 (35·13–41·88) 13 714·82 (13 589·45– 13 857·12) 107·85 (104·80–111·36) 1983 4446·63 (3338·48– 6038·33) 32·83 (24·87–44·10) 3451·08 (3379·46– 3517·62) 26·27 (25·04–27·41) 1468·12 (1453·15– 1484·66) 11·49 (11·08–11·93) 4395·90 (4228·10– 4616·23) 35·13 (32·49–37·94) 4391·16 (4210·33– 4575·38) 37·42 (34·12–40·92) 13 706·26 (13 502·87– 13 954·64) 106·02 (102·58–109·92) 1984 4414·01 (3341·28– 5878·18) 32·04 (24·46–42·24) 3451·40 (3380·96– 3516·47) 25·81 (24·58–26·95) 1445·49 (1429·90– 1462·11) 11·11 (10·70–11·55) 4343·05 (4177·90– 4563·00) 34·05 (31·53–36·86) 4309·64 (4142·86– 4480·44) 36·10 (32·99–39·37) 13 549·58 (13 353·43– 13 793·75) 103·03 (99·70–107·22) 1985 4372·44 (3329·84– 5815·48) 31·28 (24·01–41·20) 3444·53 (3373·90– 3511·49) 25·37 (24·18–26·53) 1419·42 (1404·16– 1435·52) 10·73 (10·33–11·20) 4198·69 (4086·96– 4316·23) 32·37 (30·07–34·57) 4193·23 (4036·11– 4354·84) 34·48 (31·56–37·46) 13 255·88 (13 120·30– 13 398·93) 99·21 (96·09–102·89) 1986 4324·91 (3303·47– 5687·58) 30·56 (23·53–39·83) 3430·87 (3362·62– 3494·07) 24·94 (23·79–26·07) 1392·32 (1375·98– 1408·90) 10·39 (10·01–10·83) 4095·77 (3997·51– 4193·69) 31·12 (29·00–33·22) 4097·73 (3941·17– 4255·73) 33·09 (30·34–35·95) 13 016·69 (12 893·07– 13 137·64) 96·03 (93·02–99·64) 1987 4268·38 (3281·74– 5574·35) 29·90 (23·16–38·72) 3413·24 (3345·71– 3476·16) 24·58 (23·42–25·70) 1364·90 (1348·09– 1380·90) 10·08 (9·70–10·52) 4034·29 (3937·80– 4131·20) 30·28 (28·20–32·40) 4026·78 (3876·37– 4185·56) 31·95 (29·21–34·86) 12 839·21 (12 714·31– 12 965·82) 93·57 (90·57–97·16) 1988 4191·84 (3222·94– 5475·83) 29·23 (22·64–37·86) 3382·27 (3315·87– 3445·31) 24·21 (23·08–25·28) 1333·94 (1319·08– 1349·92) 9·79 (9·42–10·21) 3960·20 (3864·38– 4053·88) 29·47 (27·51–31·55) 3955·56 (3804·58– 4,111·65) 30·91 (28·30–33·59) 12 631·98 (12 504·07– 12 758·92) 91·23 (88·36–94·63) 1989 4103·42 (3155·33– 5370·66) 28·62 (22·16–37·15) 3339·41 (3277·13– 3403·54) 23·90 (22·83–24·92) 1299·73 (1285·45– 1315·57) 9·53 (9·19–9·95) 3871·89 (3781·40– 3966·14) 28·70 (26·84–30·71) 3857·17 (3709·77– 4,011·25) 29·76 (27·26–32·53) 12 368·20 (12 253·57– 12 483·93) 88·90 (86·13–92·11) 1990 4007·90 (3083·10– 5236·38) 28·10 (21·77–36·41) 3288·20 (3224·96– 3349·07) 23·63 (22·59–24·60) 1264·72 (1250·49– 1279·28) 9·31 (8·97–9·68) 3784·52 (3693·53– 3877·42) 28·09 (26·21–29·94) 3782·69 (3637·18– 3933·80) 28·92 (26·55–31·67) 12 120·13 (12 010·80– 12 239·54) 87·08 (84·45–90·05) 1991 3909·41 (3019·26– 5069·41) 27·62 (21·48–35·55) 3233·63 (3172·82– 3293·92) 23·41 (22·39–24·31) 1230·80 (1216·82– 1244·35) 9·12 (8·79–9·47) 3695·00 (3601·95– 3786·01) 27·57 (25·77–29·31) 3707·73 (3561·58– 3857·32) 28·21 (25·95–30·87) 11 867·16 (11 761·90– 11 972·98) 85·54 (83·10–88·24) 1992 3800·25 (2976·27– 4886·14) 27·12 (21·38–34·62) 3168·04 (3106·90– 3229·12) 23·15 (22·12–24·09) 1192·12 (1178·59– 1205·93) 8·92 (8·61–9·26) 3582·20 (3493·61– 3673·52) 26·94 (25·19–28·74) 3593·27 (3453·91– 3735·14) 27·32 (25·04–29·82) 11 535·63 (11 426·11– 11 636·72) 83·69 (81·18–86·25) 1993 3687·65 (2907·35– 4735·37) 26·60 (21·10–33·92) 3098·80 (3037·91– 3157·56) 22·88 (21·88–23·80) 1152·81 (1139·48– 1166·25) 8·71 (8·41–9·02) 3467·75 (3381·02– 3556·99) 26·32 (24·59–28·06) 3486·85 (3349·67– 3624·72) 26·59 (24·47–28·95) 11 206·21 (11 110·76– 11 310·27) 81·96 (79·60–84·56) 1994 3577·24 (2847·62– 4544·93) 26·08 (20·88–32·92) 3037·42 (2977·47– 3096·64) 22·65 (21·67–23·56) 1118·66 (1105·33– 1133·13) 8·54 (8·23–8·85) 3372·75 (3287·97– 3467·51) 25·85 (24·26–27·54) 3427·31 (3268·93– 3578·27) 26·27 (24·13–28·58) 10 956·15 (10 836·81– 11 103·59) 80·83 (78·57–83·29) 1995 3471·39 (2787·86– 4366·54) 25·58 (20·65–31·97) 2970·80 (2910·75– 3030·03) 22·37 (21·46–23·29) 1079·27 (1067·15– 1091·46) 8·31 (8·04–8·60) 3285·45 (3200·44– 3372·30) 25·42 (23·86–26·93) 3291·68 (3160·12– 3422·11) 25·41 (23·42–27·47) 10 627·20 (10 534·17– 10 728·52) 79·15 (77·10–81·31) 1996 3389·05 (2755·17– 4219·81) 25·16 (20·56–31·15) 2914·02 (2856·68– 2969·53) 22·11 (21·21–22·93) 1046·09 (1034·26– 1057·84) 8·12 (7·86–8·39) 3190·20 (3106·86– 3272·35) 24·89 (23·41–26·26) 3193·88 (3066·06– 3323·32) 24·87 (22·91–26·96) 10 344·19 (10 255·67– 10 441·05) 77·71 (75·85–79·66) 1997 3325·06 (2729·68– 4111·07) 24·83 (20·48–30·53) 2862·34 (2805·44– 2916·48) 21·84 (20·96–22·64) 1014·89 (1003·33– 1027·15) 7·92 (7·67–8·18) 3100·92 (3016·31– 3180·72) 24·35 (22·95–25·71) 3095·57 (2967·45– 3227·97) 24·30 (22·38–26·32) 10 073·72 (9987·08– 10 166·45) 76·22 (74·45–78·04) 1998 3252·85 (2679·00– 4,002·19) 24·39 (20·18–29·85) 2813·68 (2759·54– 2868·11) 21·55 (20·69–22·34) 985·58 (973·89– 996·93) 7·72 (7·46–7·98) 3016·13 (2934·45– 3095·42) 23·78 (22·39–25·17) 3003·76 (2876·08– 3131·97) 23·75 (21·96–25·66) 9819·14 (9735·05– 9907·36) 74·70 (72·90–76·52)
(2619·78– 3878·74) (19·76–28·98) (2713·91– 2821·33) (20·36–21·97) (945·22– 968·45) (7·23–7·76) (2852·37– 3009·62) (21·79–24·52) (2782·65– 3038·66) (21·39–25·07) (9481·09– 9652·39) (71·20–74·90) 2000 3090·13 (2563·52– 3751·10) 23·19 (19·32–28·02) 2721·60 (2666·35– 2773·39) 20·86 (19·98–21·62) 927·49 (915·82– 938·98) 7·26 (7·00–7·53) 2843·08 (2763·31– 2918·67) 22·46 (21·15–23·77) 2810·32 (2688·05– 2935·63) 22·44 (20·72–24·32) 9302·50 (9218·10– 9386·18) 71·12 (69·33–73·03) 2001 3014·27 (2521·45– 3629·82) 22·57 (18·95–27·06) 2676·78 (2621·56– 2727·91) 20·46 (19·62–21·22) 899·27 (887·84– 911·07) 7·02 (6·76–7·28) 2755·20 (2676·23– 2831·45) 21·72 (20·44–22·98) 2710·94 (2589·72– 2832·43) 21·68 (20·00–23·49) 9042·19 (8956·84– 9127·83) 69·09 (67·17–71·02) 2002 2945·64 (2486·44– 3536·51) 21·96 (18·61–26·26) 2632·58 (2579·35– 2684·35) 20·03 (19·21–20·82) 872·56 (861·77– 884·33) 6·78 (6·52–7·04) 2669·20 (2593·57– 2744·00) 20·95 (19·67–22·21) 2614·51 (2497·63– 2732·49) 20·90 (19·31–22·64) 8788·85 (8703·87– 8873·68) 66·98 (65·07–68·94) 2003 2883·13 (2450·30– 3432·10) 21·38 (18·24–25·36) 2587·51 (2536·18– 2639·32) 19·57 (18·77–20·34) 846·66 (835·85– 858·26) 6·54 (6·29–6·80) 2556·92 (2488·41– 2631·87) 19·96 (18·75–21·15) 2505·81 (2387·30– 2621·50) 19·98 (18·43–21·65) 8496·90 (8424·32– 8578·98) 64·49 (62·74–66·38) 2004 2822·77 (2398·46– 3342·95) 20·81 (17·74–24·56) 2541·18 (2490·19– 2592·63) 19·10 (18·31–19·88) 821·44 (810·90– 833·33) 6·30 (6·05–6·56) 2475·08 (2407·74– 2548·10) 19·19 (18·00–20·33) 2419·48 (2302·48– 2532·72) 19·21 (17·73–20·86) 8257·17 (8181·77– 8342·34) 62·34 (60·55–64·29) 2005 2752·80 (2351·02– 3241·05) 20·19 (17·29–23·68) 2492·25 (2439·11– 2543·30) 18·61 (17·80–19·36) 795·67 (785·04– 807·58) 6·06 (5·81–6·33) 2389·57 (2321·08– 2460·22) 18·39 (17·28–19·53) 2319·16 (2211·24– 2427·96) 18·30 (16·89–19·90) 7996·65 (7921·62– 8081·51) 60·03 (58·15–61·99) 2006 2677·89 (2300·31– 3132·63) 19·51 (16·81–22·75) 2444·92 (2393·69– 2495·80) 18·14 (17·34–18·89) 771·64 (760·76– 783·26) 5·83 (5·56–6·10) 2307·74 (2239·59– 2375·84) 17·64 (16·57–18·76) 2224·50 (2117·95– 2330·96) 17·43 (16·05–18·96) 7748·81 (7671·16– 7829·99) 57·81 (55·82–59·82) 2007 2608·90 (2238·50– 3052·02) 18·88 (16·25–22·02) 2399·66 (2348·31– 2449·79) 17·67 (16·90–18·41) 749·16 (737·98– 761·74) 5·62 (5·35–5·89) 2231·91 (2165·03– 2298·04) 16·93 (15·88–18·07) 2135·85 (2032·78– 2238·85) 16·62 (15·28–18·12) 7516·57 (7440·60– 7604·72) 55·69 (53·60–57·78) 2008 2546·84 (2194·02– 2972·40) 18·32 (15·82–21·31) 2357·29 (2306·72– 2407·17) 17·24 (16·46–17·99) 728·66 (717·15– 741·87) 5·43 (5·15–5·72) 2163·00 (2098·82– 2224·69) 16·28 (15·22–17·42) 2061·12 (1959·62– 2160·84) 15·91 (14·61–17·34) 7310·06 (7225·74– 7408·43) 53·79 (51·58–56·10) 2009 2485·07 (2142·42– 2891·93) 17·76 (15·35–20·61) 2313·06 (2263·54– 2361·49) 16·81 (16·02–17·56) 707·89 (695·78– 721·70) 5·24 (4·94–5·55) 2089·18 (2026·36– 2150·70) 15·61 (14·52–16·71) 1968·96 (1868·41– 2062·99) 15·08 (13·78–16·55) 7079·10 (6988·35– 7178·71) 51·74 (49·33–54·14) 2010 2419·94 (2087·79– 2824·25) 17·22 (14·89–20·04) 2264·25 (2214·86– 2314·31) 16·37 (15·55–17·19) 686·86 (674·78– 700·15) 5·05 (4·75–5·40) 2022·54 (1958·02– 2083·52) 15·01 (13·87–16·14) 1902·19 (1803·78– 1996·75) 14·46 (13·12–15·89) 6875·83 (6777·71– 6980·62) 49·97 (47·34–52·70) 2011 2350·47 (2025·78– 2732·56) 16·64 (14·38–19·29) 2214·81 (2165·09– 2262·24) 15·93 (15·06–16·77) 665·33 (652·82– 679·02) 4·87 (4·53–5·25) 1944·92 (1883·12– 2005·91) 14·35 (13·22–15·52) 1806·20 (1712·64– 1898·00) 13·62 (12·27–15·10) 6631·25 (6530·28– 6737·69) 47·91 (45·12–50·92) 2012 2282·19 (1973·84– 2669·70) 16·09 (13·95–18·77) 2168·30 (2118·47– 2215·24) 15·52 (14·57–16·41) 645·09 (631·47– 659·03) 4·69 (4·34–5·10) 1871·79 (1810·03– 1932·00) 13·73 (12·57–14·95) 1728·34 (1634·29– 1820·64) 12·94 (11·58–14·44) 6413·53 (6297·89– 6,522·55) 46·11 (43·17–49·32) 2013 2225·15 (1916·54– 2604·35) 15·64 (13·50–18·26) 2124·20 (2074·05– 2173·09) 15·15 (14·16–16·10) 625·70 (611·59– 640·35) 4·53 (4·16–4·96) 1807·71 (1748·13– 1866·80) 13·20 (12·01–14·49) 1656·45 (1563·93– 1752·38) 12·32 (10·93–13·86) 6,214·06 (6090·86– 6332·79) 44·47 (41·29–48·02) 2014 2175·23 (1868·96– 2564·58) 15·25 (13·14–17·94) 2080·13 (2031·06– 2129·80) 14·79 (13·78–15·86) 606·19 (590·75– 621·97) 4·38 (3·99–4·83) 1744·31 (1684·25– 1804·67) 12·68 (11·46–14·13) 1588·47 (1494·61– 1685·85) 11·75 (10·33–13·31) 6019·08 (5878·69– 6153·38) 42·93 (39·54–46·89) 2015 2124·96 (1827·78– 2521·12) 14·89 (12·83–17·62) 2034·23 (1982·93– 2082·87) 14·45 (13·39–15·56) 587·23 (570·64– 604·00) 4·23 (3·84–4·71) 1677·99 (1617·86– 1741·50) 12·16 (10·93–13·63) 1521·40 (1425·62– 1620·55) 11·20 (9·80–12·81) 5820·85 (5673·34– 5965·06) 41·41 (37·93–45·45) 95% UIs are provided in parentheses. UI=uncertainty intervals.
Table 1: Global deaths (thousands) and mortality rates (per 1000 livebirths) for stillbirths, early neonatal, late neonatal, post-neonatal, child, and under-5 age groups, both sexes
Geographical units of analysis
For GBD 2015, we analysed 195 countries and territories
in the 21 GBD regions. Since GBD 2013, we added seven
territories and expanded subnational analyses from three
countries (China, Mexico, and the UK)
43–45to include eight
additional countries: Brazil, India, Japan, Kenya, Saudi
Arabia, South Africa, Sweden, and the USA. Here, we
present results at the global, regional, national, territory,
and, for a subset of countries, subnational levels from
1980–2015. Countries for which subnational estimates are
shown include Brazil (26 states and one district), China
(33 provinces and municipalities), India (62 urban and
rural administrative units), Japan (47 prefectures), Kenya
(47 counties), Mexico (32 states), Saudi Arabia (13 regions),
South Africa (nine provinces), Sweden (two regions), the
UK (four nations and nine subregions for England), and
the USA (50 states and the District of Columbia).
Data
Data sources and types used for estimating child
mortality are described extensively elsewhere,
14but in
sum, vital registration (VR)
systems, censuses, and
household surveys with complete or summary birth
histories served as primary inputs for our analyses. Other
sources, including sample registration systems and
disease surveillance systems, also contributed as input
data. In total we applied formal demographic techniques
to 8169 input data sources of under-5 mortality from
1950–2015. Overall data availability and availability by
source data type varied by geography.
Stillbirth data were extracted from major survey series,
including Demographic and Health Surveys, the Centers
for Disease Control & Prevention (CDC) Reproductive
Health Surveys, UNICEF Multiple Indicator Cluster
Surveys, and the WHO Multi-Country Surveys. We also
used VR systems, birth registries, and literature sources.
Following defi nitions for stillbirths used by previous
studies,
39,40we classifi ed fetal deaths at 28 weeks or later
and intrapartum deaths (ie, deaths that occurred after the
onset of labour but prior to birth) as stillbirths. We
collated 7579 geography-year datapoints from 1980–2015
on stillbirths, representing 350 countries, territories, and
subnational locations in our analysis. The appendix
provides additional detail on stillbirth data sources and
processing steps (appendix pp 19–22).
All-cause under-5 mortality and age-specifi c mortality
The appendix presents the analytical steps involved in
early neonatal, late neonatal, post-neonatal, and ages
1–4 years have been extensively discussed previously
46and in the appendix.
For subnational analyses, we rescaled estimates from
lower administrative units to the national level because
data densities were generally much higher at the national
level than at the subnational. South Africa was the
exception to this approach, where national-level estimates
were generated by aggregating subnational estimates up
to the national level.
To estimate mortality by age group and sex within
the under-5 categorisation, we used a two-stage
modelling process that has been described in detail
elsewhere.
3,14For this analysis, we report on early
neonatal and late neonatal mortality results in
aggregate as neonatal mortality; the appendix provides
estimates of early and late neonatal mortality (appendix
pp 35, 36).
Stillbirth analysis
In GBD 2015, for the fi rst time, we generated estimates
of stillbirths and stillbirth rates by location from
1980–2015. Drawing from data compiled by Blencowe
and colleagues,
39we expanded to include additional data
from published literature, VR, and surveys. We
estimated stillbirth trends by modifying the data
synthesis model used for under-5 mortality. We applied
a mixed-eff ects generalised linear model to quantify the
ratio of stillbirth rates to neonatal mortality in natural
logarithmic space. Our model covariates included
educational attainment among women of reproductive
age, skilled birth attendance, a random eff ect on
neonatal mortality classifi ed into 20 bins, random
intercepts for each location, and data source-specifi c
random eff ects nested within each location. Neonatal
mortality was chosen for its strong coeffi
cient of
correlation with stillbirth rates (0·8). Source-specifi c
fi xed eff ects were included to adjust for biases inherent
to a subset of data sources; the appendix provides the
complete list of data source types (appendix p 21).
Finally, we included a variable that accounted for
diff erent stillbirth defi nitions, encompassing the seven
defi nitions found within our database. These defi nitions
included fetal death after 28 weeks of gestation,
26 weeks of gestation, 24 weeks of gestation, 22 weeks
of gestation, 20 weeks of gestation, weighing at least
1000 g, and weighing at least 500 g. There were also
1744 location-years where no defi nition was provided,
which we included as an eighth undefi ned defi nition
Global 14·89 (12·83 to 17·62) 18·62 (17·26 to 20·14) 12·16 (10·93 to 13·63) 11·20 (9·80 to 12·81) 41·41 (37·93 to 45·45) 2124·96 (1827·78 to 2521·12) 5820·85 (5673·34 to 5965·06) –2·02 (–2·39 to –1·70) –3·61 (–4·17 to –2·98) –2·97 (–3·32 to –2·59) High SDI 3·00 (2·71 to 3·36) 2·78 (2·61 to 2·98) 1·59 (1·50 to 1·69) 0·95 (0·86 to 1·06) 5·31 (5·04 to 5·63) 42·18 (38·15 to 47·25) 74·54 (72·97 to 76·25) –3·90 (–4·12 to –3·69) –3·26 (–3·61 to –2·88) –3·52 (–3·74 to –3·28) High-middle SDI 6·73 (5·90 to 7·70) 8·52 (7·52 to 9·63) 4·39 (3·86 to 5·00) 2·81 (2·48 to 3·18) 15·64 (13·92 to 17·66) 165·69 (145·07 to 189·86) 372·15 (355·30 to 388·69) –3·65 (–4·42 to –2·91) –4·61 (–5·41 to –3·73) –4·22 (–4·75 to –3·69) Middle SDI 10·15 (8·84 to 11·64) 12·90 (11·55 to 14·30) 6·26 (5·46 to 7·17) 4·40 (3·83 to 5·05) 23·40 (20·89 to 26·09) 372·28 (323·69 to 427·48) 868·83 (828·55 to 909·42) –3·54 (–4·47 to –2·60) –4·97 (–5·79 to –4·14) –4·40 (–4·94 to –3·86)* Low-middle SDI 24·01 (20·78 to 28·01) 29·14 (27·14 to 31·34) 17·59 (15·81 to 19·52) 16·63 (14·34 to 19·23) 62·07 (57·46 to 67·10) 1115·34 (962·28 to 1306·27) 2814·33 (2706·19 to 2924·44) –2·56 (–2·87 to –2·27) –3·63 (–4·17 to –3·08) –3·20 (–3·53 to –2·86) Low SDI 20·56 (15·95 to 27·02) 27·65 (25·65 to 29·87) 28·19 (25·05 to 31·74) 30·64 (26·17 to 35·37) 84·02 (75·99 to 93·24) 428·45 (330·77 to 566·64) 1688·71 (1615·60 to 1769·42) –2·16 (–2·37 to –1·97) –3·89 (–4·50 to –3·23) –3·20 (–3·61 to –2·78) High income 2·94 (2·71 to 3·22) 2·69 (2·50 to 2·91) 1·54 (1·44 to 1·65) 0·84 (0·73 to 0·96) 5·06 (4·75 to 5·40) 34·73 (31·99 to 37·99) 59·66 (58·68 to 60·76) –3·91 (–4·11 to –3·75) –2·68 (–3·11 to –2·25) –3·17 (–3·43 to –2·91) High-income North America 2·81 (2·71 to 2·92) 3·27 (3·08 to 3·45) 1·69 (1·55 to 1·82) 0·97 (0·75 to 1·21) 5·92 (5·71 to 6·14) 12·45 (12·00 to 12·93) 26·10 (25·83 to 26·36) –3·24 (–3·35 to –3·13) –2·03 (–2·27 to –1·77) –2·51 (–2·65 to –2·36) Canada 2·57 (2·15 to 3·12) 2·77 (2·54 to 3·02) 1·45 (1·31 to 1·58) 0·82 (0·62 to 1·06) 5·03 (4·72 to 5·38) 1·00 (0·84 to 1·21) 1·94 (1·82 to 2·08) –3·15 (–3·47 to –2·84) –1·34 (–1·78 to –0·88) –2·06 (–2·32 to –1·79) Greenland 5·87 (4·14 to 8·11) 8·62 (7·50 to 9·86) 4·43 (3·93 to 4·96) 1·97 (1·42 to 2·60) 14·95 (13·40 to 16·71) <0·01 (<0·01 to 0·01) 0·01 (0·01 to 0·01) –5·51 (–6·33 to –4·66) –2·22 (–2·96 to –1·45) –3·54 (–4·03 to –3·03) USA 2·84 (2·73 to 2·95) 3·32 (3·14 to 3·50) 1·71 (1·57 to 1·85) 0·98 (0·74 to 1·25) 6·00 (5·80 to 6·21) 11·45 (11·02 to 11·91) 24·13 (23·90 to 24·36) –3·27 (–3·38 to –3·16) –2·06 (–2·29 to –1·82) –2·54 (–2·68 to –2·40) Australasia 3·65 (2·96 to 4·59) 2·09 (1·92 to 2·25) 1·32 (1·19 to 1·43) 0·76 (0·58 to 0·97) 4·16 (3·93 to 4·41) 1·38 (1·12 to 1·74) 1·56 (1·49 to 1·64) –4·21 (–4·51 to –3·89) –2·96 (–3·36 to –2·53) –3·46 (–3·71 to –3·21) Australia 3·71 (2·98 to 4·71) 2·04 (1·88 to 2·20) 1·19 (1·06 to 1·31) 0·72 (0·52 to 0·97) 3·94 (3·73 to 4·17) 1·18 (0·95 to 1·50) 1·25 (1·18 to 1·32) –4·28 (–4·66 to –3·88) –3·08 (–3·49 to –2·66) –3·56 (–3·81 to –3·31) New Zealand 3·34 (2·85 to 3·97) 2·32 (2·11 to 2·53) 1·99 (1·74 to 2·22) 0·97 (0·71 to 1·32) 5·27 (4·95 to 5·63) 0·20 (0·17 to 0·24) 0·32 (0·30 to 0·34) –3·97 (–4·42 to –3·51) –2·30 (–2·75 to –1·81) –2·96 (–3·25 to –2·67) High-income Asia Pacifi c 1·81 (1·64 to 2·01) 1·19 (1·07 to 1·32) 0·97 (0·87 to 1·08) 0·73 (0·60 to 0·88) 2·89 (2·68 to 3·15) 2·78 (2·51 to 3·09) 4·46 (4·19 to 4·73) –4·14 (–5·62 to –2·89) –4·18 (–4·71 to –3·58) –4·16 (–4·81 to –3·48) Brunei 4·06 (3·16 to 5·14) 3·86 (3·32 to 4·43) 2·50 (2·00 to 3·05) 2·57 (1·93 to 3·29) 8·90 (7·81 to 10·17) 0·03 (0·02 to 0·03) 0·06 (0·05 to 0·07) –1·38 (–2·28 to –0·58) 0·03 (–0·91 to 1·06) –0·53 (–1·15 to 0·10) Japan 1·78 (1·58 to 2·02) 1·11 (0·99 to 1·24) 0·92 (0·80 to 1·06) 0·70 (0·53 to 0·88) 2·73 (2·50 to 2·98) 1·84 (1·64 to 2·09) 2·84 (2·76 to 2·91) –2·88 (–3·14 to –2·59) –3·48 (–4·06 to –2·90) –3·24 (–3·58 to –2·88) Singapore 2·20 (1·75 to 2·81) 1·05 (0·94 to 1·17) 0·67 (0·58 to 0·77) 0·45 (0·33 to 0·59) 2·17 (1·95 to 2·42) 0·08 (0·07 to 0·11) 0·08 (0·07 to 0·09) –7·34 (–8·11 to –6·56) –3·53 (–4·34 to –2·73) –5·05 (–5·54 to –4·59)* South Korea 1·82 (1·51 to 2·18) 1·34 (1·09 to 1·65) 1·09 (0·89 to 1·30) 0·80 (0·59 to 1·06) 3·22 (2·69 to 3·82) 0·83 (0·69 to 1·00) 1·47 (1·23 to 1·74) –5·34 (–8·21 to –2·61) –5·30 (–6·47 to –4·15) –5·32 (–6·57 to –3·98)*
(Continued from previous page) Western Europe 2·65 (2·39 to 2·95) 1·88 (1·64 to 2·17) 1·12 (1·00 to 1·24) 0·58 (0·49 to 0·68) 3·58 (3·18 to 4·05) 11·72 (10·53 to 13·05) 15·82 (15·01 to 16·71) –4·92 (–5·08 to –4·77) –3·16 (–3·95 to –2·36) –3·87 (–4·34 to –3·37) Andorra 1·38 (1·12 to 1·75) 0·98 (0·81 to 1·23) 0·64 (0·50 to 0·82) 0·29 (0·19 to 0·43) 1·91 (1·55 to 2·39) <0·01 (<0·01 to <0·01) <0·01 (<0·01 to <0·01) –7·37 (–8·97 to –5·75) –2·83 (–4·10 to –1·49) –4·65 (–5·53 to –3·64)* Austria 2·23 (1·91 to 2·66) 1·85 (1·60 to 2·16) 1·10 (0·97 to 1·25) 0·57 (0·43 to 0·77) 3·53 (3·12 to 3·99) 0·18 (0·16 to 0·22) 0·29 (0·25 to 0·33) –5·34 (–6·09 to –4·67) –3·16 (–4·10 to –2·22) –4·03 (–4·57 to –3·52) Belgium 2·43 (1·95 to 3·09) 1·93 (1·70 to 2·19) 1·27 (1·13 to 1·42) 0·61 (0·46 to 0·79) 3·81 (3·45 to 4·22) 0·32 (0·25 to 0·40) 0·50 (0·45 to 0·55) –5·05 (–5·45 to –4·68) –3·08 (–3·78 to –2·39) –3·87 (–4·28 to –3·46) Cyprus 2·92 (2·38 to 3·65) 2·80 (2·37 to 3·32) 1·44 (1·26 to 1·69) 0·54 (0·38 to 0·72) 4·78 (4·16 to 5·58) 0·02 (0·02 to 0·02) 0·03 (0·03 to 0·04) –5·88 (–6·60 to –5·17) –2·86 (–3·79 to –1·80) –4·07 (–4·67 to –3·46) Denmark 1·35 (1·12 to 1·62) 1·97 (1·63 to 2·39) 0·99 (0·85 to 1·14) 0·58 (0·42 to 0·79) 3·55 (3·02 to 4·18) 0·08 (0·07 to 0·10) 0·21 (0·18 to 0·25) –5·04 (–5·81 to –4·30) –2·97 (–4·09 to –1·85) –3·80 (–4·47 to –3·13) Finland 1·52 (1·27 to 1·86) 1·32 (1·05 to 1·69) 0·66 (0·53 to 0·83) 0·41 (0·28 to 0·59) 2·40 (1·89 to 3·03) 0·09 (0·07 to 0·11) 0·14 (0·11 to 0·18) –5·10 (–6·13 to –4·05) –3·71 (–5·42 to –2·04) –4·27 (–5·24 to –3·31) France 3·30 (2·67 to 4·07) 1·53 (1·16 to 2·02) 1·18 (0·94 to 1·44) 0·58 (0·41 to 0·82) 3·28 (2·59 to 4·15) 2·59 (2·10 to 3·20) 2·58 (2·04 to 3·25) –4·85 (–5·25 to –4·51) –3·40 (–4·99 to –1·86) –3·98 (–4·93 to –3·05) Germany 2·10 (1·79 to 2·50) 1·77 (1·46 to 2·20) 1·19 (1·02 to 1·38) 0·58 (0·42 to 0·78) 3·53 (3·01 to 4·22) 1·44 (1·23 to 1·72) 2·41 (2·05 to 2·88) –5·53 (–5·87 to –5·17) –2·71 (–3·82 to –1·52) –3·84 (–4·49 to –3·15) Greece 2·49 (2·09 to 2·97) 1·92 (1·74 to 2·13) 0·91 (0·81 to 1·01) 0·47 (0·34 to 0·63) 3·30 (3·03 to 3·61) 0·23 (0·19 to 0·27) 0·31 (0·28 to 0·34) –5·25 (–5·75 to –4·78) –4·21 (–4·81 to –3·58) –4·62 (–4·99 to –4·26)* Iceland 1·23 (1·01 to 1·53) 0·95 (0·81 to 1·13) 0·68 (0·56 to 0·80) 0·39 (0·27 to 0·54) 2·03 (1·72 to 2·38) 0·01 (<0·01 to 0·01) 0·01 (0·01 to 0·01) –5·03 (–6·17 to –3·76) –4·49 (–5·64 to –3·24) –4·71 (–5·39 to –4·01)* Ireland 2·87 (2·23 to 3·77) 1·83 (1·59 to 2·09) 1·13 (0·99 to 1·26) 0·56 (0·41 to 0·74) 3·51 (3·15 to 3·92) 0·20 (0·15 to 0·26) 0·24 (0·22 to 0·27) –3·23 (–3·92 to –2·50) –4·50 (–5·28 to –3·69) –3·99 (–4·49 to –3·53) Israel 2·55 (2·06 to 3·15) 1·85 (1·63 to 2·09) 1·24 (1·09 to 1·38) 0·75 (0·56 to 0·96) 3·84 (3·50 to 4·22) 0·43 (0·34 to 0·53) 0·64 (0·58 to 0·70) –5·08 (–5·64 to –4·52) –4·32 (–4·96 to –3·66) –4·62 (–5·04 to –4·23)* Italy 1·75 (1·44 to 2·16) 1·91 (1·54 to 2·39) 0·77 (0·64 to 0·92) 0·45 (0·31 to 0·60) 3·13 (2·55 to 3·83) 0·88 (0·72 to 1·08) 1·58 (1·29 to 1·93) –5·52 (–5·94 to –5·13) –3·74 (–5·09 to –2·40) –4·45 (–5·25 to –3·64)* Luxembourg 3·12 (2·59 to 3·84) 1·13 (0·97 to 1·33) 1·03 (0·88 to 1·21) 0·42 (0·30 to 0·57) 2·58 (2·23 to 2·99) 0·02 (0·02 to 0·02) 0·02 (0·01 to 0·02) –6·57 (–7·64 to –5·36) –4·04 (–5·03 to –2·98) –5·05 (–5·71 to –4·41)* Malta 3·05 (2·46 to 3·73) 4·16 (3·56 to 4·84) 1·46 (1·27 to 1·65) 0·65 (0·46 to 0·87) 6·25 (5·47 to 7·16) 0·01 (0·01 to 0·01) 0·02 (0·02 to 0·03) –3·04 (–4·09 to –1·92) –0·87 (–1·92 to 0·19) –1·74 (–2·31 to –1·12) Netherlands 2·24 (1·81 to 2·75) 2·18 (1·88 to 2·53) 1·00 (0·87 to 1·12) 0·73 (0·55 to 0·97) 3·91 (3·48 to 4·41) 0·40 (0·32 to 0·49) 0·69 (0·62 to 0·78) –2·99 (–3·47 to –2·48) –3·36 (–4·19 to –2·54) –3·21 (–3·70 to –2·72) Norway 2·09 (1·58 to 2·76) 1·34 (1·17 to 1·53) 0·86 (0·74 to 0·98) 0·51 (0·38 to 0·67) 2·71 (2·40 to 3·06) 0·13 (0·10 to 0·17) 0·17 (0·15 to 0·19) –5·94 (–6·69 to –5·14) –4·01 (–4·90 to –3·14) –4·78 (–5·30 to –4·25)* (Table 2 continues on next page)
(Continued from previous page) Portugal 2·09 (1·96 to 2·24) 1·39 (1·28 to 1·52) 0·97 (0·86 to 1·09) 0·60 (0·45 to 0·77) 2·97 (2·78 to 3·17) 0·17 (0·16 to 0·19) 0·25 (0·24 to 0·27) –6·84 (–7·12 to –6·56) –5·88 (–6·33 to –5·42) –6·27 (–6·54 to –6·00)* Spain 1·81 (1·50 to 2·21) 1·56 (1·35 to 1·80) 0·94 (0·82 to 1·07) 0·50 (0·37 to 0·66) 3·00 (2·65 to 3·40) 0·75 (0·62 to 0·91) 1·26 (1·11 to 1·42) –5·46 (–5·89 to –5·01) –3·99 (–4·86 to –3·14) –4·58 (–5·07 to –4·06)* Sweden 2·32 (1·75 to 3·06) 1·41 (1·23 to 1·65) 0·76 (0·66 to 0·88) 0·42 (0·30 to 0·57) 2·60 (2·26 to 2·99) 0·28 (0·21 to 0·36) 0·31 (0·28 to 0·34) –6·15 (–6·97 to –5·37) –2·65 (–3·66 to –1·60) –4·05 (–4·64 to –3·47) Switzerland 1·89 (1·64 to 2·18) 2·25 (1·86 to 2·74) 1·09 (0·96 to 1·25) 0·71 (0·51 to 0·92) 4·05 (3·45 to 4·75) 0·16 (0·14 to 0·19) 0·35 (0·29 to 0·41) –3·96 (–4·61 to –3·29) –2·47 (–3·56 to –1·38) –3·07 (–3·72 to –2·42) UK 4·08 (3·51 to 4·73) 2·56 (2·31 to 2·83) 1·46 (1·33 to 1·61) 0·68 (0·50 to 0·88) 4·69 (4·34 to 5·10) 3·33 (2·86 to 3·86) 3·81 (3·70 to 3·93) –3·85 (–4·18 to –3·51) –2·15 (–2·68 to –1·59) –2·83 (–3·17 to –2·49) England 4·09 (3·49 to 4·76) 2·57 (2·34 to 2·84) 1·46 (1·36 to 1·57) 0·69 (0·60 to 0·78) 4·71 (4·34 to 5·13) 2·87 (2·45 to 3·34) 3·28 (3·18 to 3·39) –3·87 (–4·19 to –3·54) –2·14 (–2·68 to –1·53) –2·83 (–3·16 to –2·48) Northern Ireland 4·10 (3·43 to 4·94) 3·21 (2·38 to 4·18) 1·37 (1·10 to 1·67) 0·76 (0·55 to 1·03) 5·33 (4·15 to 6·72) 0·10 (0·09 to 0·12) 0·13 (0·10 to 0·17) –3·64 (–5·05 to –2·33) –1·23 (–3·05 to 0·51) –2·20 (–3·26 to –1·20) Scotland 4·09 (3·51 to 4·68) 2·35 (1·86 to 2·88) 1·39 (1·17 to 1·62) 0·67 (0·47 to 0·91) 4·40 (3·67 to 5·21) 0·23 (0·19 to 0·26) 0·24 (0·21 to 0·29) –3·83 (–4·60 to –3·00) –2·64 (–3·94 to –1·38) –3·11 (–3·86 to –2·40) Wales 4·03 (3·46 to 4·72) 2·31 (2·07 to 2·60) 1·38 (1·24 to 1·53) 0·69 (0·51 to 0·91) 4·38 (4·02 to 4·80) 0·14 (0·12 to 0·16) 0·15 (0·14 to 0·16) –3·75 (–4·64 to –2·80) –2·21 (–2·97 to –1·43) –2·82 (–3·25 to –2·43) Southern Latin America 6·12 (5·10 to 7·48) 6·06 (5·69 to 6·47) 3·65 (3·33 to 3·97) 1·63 (1·23 to 2·10) 11·31 (10·75 to 11·93) 6·38 (5·31 to 7·81) 11·72 (11·31 to 12·15) –3·83 (–3·91 to –3·74) –2·85 (–3·20 to –2·49) –3·24 (–3·44 to –3·03) Argentina 5·38 (4·37 to 6·56) 6·80 (6·40 to 7·20) 3·97 (3·60 to 4·36) 1·85 (1·31 to 2·47) 12·57 (12·08 to 13·10) 4·07 (3·31 to 4·98) 9·47 (9·10 to 9·87) –3·56 (–3·66 to –3·44) –3·03 (–3·31 to –2·76) –3·24 (–3·40 to –3·08) Chile 8·81 (6·00 to 13·14) 3·94 (3·67 to 4·21) 2·63 (2·33 to 2·91) 1·06 (0·75 to 1·44) 7·61 (7·17 to 8·08) 2·08 (1·41 to 3·12) 1·78 (1·68 to 1·90) –5·64 (–5·85 to –5·44) –2·29 (–2·69 to –1·88) –3·63 (–3·88 to –3·39) Uruguay 4·64 (3·79 to 5·63) 4·89 (3·79 to 6·35) 3·59 (2·63 to 4·69) 1·13 (0·74 to 1·65) 9·58 (7·35 to 12·43) 0·23 (0·18 to 0·28) 0·47 (0·36 to 0·61) –3·68 (–4·28 to –3·05) –3·39 (–5·19 to –1·63) –3·50 (–4·55 to –2·49) Central Europe,
eastern Europe, and central Asia 4·91 (4·03 to 6·13) 7·19 (6·27 to 8·16) 4·13 (3·51 to 4·90) 2·65 (2·24 to 3·14) 13·91 (12·15 to 15·95) 27·60 (22·63 to 34·49) 77·90 (72·86 to 83·58) –1·48 (–1·96 to –0·96) –4·65 (–5·56 to –3·72) –3·38 (–3·94 to –2·84) Eastern Europe 3·98 (3·13 to 5·17) 4·41 (4·02 to 4·96) 2·56 (2·25 to 2·90) 1·76 (1·39 to 2·18) 8·70 (8·00 to 9·60) 10·09 (7·94 to 13·12) 21·95 (20·24 to 24·16) –0·62 (–1·28 to 0·09) –5·51 (–6·13 to –4·81) –3·56 (–3·92 to –3·15) Belarus 2·12 (1·78 to 2·57) 2·91 (2·11 to 4·00) 1·72 (1·32 to 2·28) 1·08 (0·72 to 1·54) 5·70 (4·34 to 7·65) 0·24 (0·20 to 0·29) 0·64 (0·48 to 0·85) –2·91 (–4·74 to –1·10) –6·65 (–8·52 to –4·59) –5·15 (–6·41 to –3·90)* Estonia 1·97 (1·91 to 2·03) 1·46 (1·07 to 2·01) 1·10 (0·86 to 1·40) 0·74 (0·51 to 1·02) 3·30 (2·53 to 4·26) 0·03 (0·03 to 0·03) 0·05 (0·04 to 0·06) –4·02 (–5·11 to –2·90) –8·42 (–10·34 to –6·58) –6·66 (–7·74 to –5·63)* Latvia 3·20 (2·87 to 3·62) 2·57 (1·64 to 3·80) 1·50 (1·09 to 2·08) 1·14 (0·76 to 1·65) 5·20 (3·60 to 7·29) 0·06 (0·06 to 0·07) 0·10 (0·07 to 0·15) –3·04 (–4·05 to –1·99) –6·24 (–8·75 to –3·90) –4·96 (–6·47 to –3·52)* (Table 2 continues on next page)
(Continued from previous page) Lithuania 2·59 (2·24 to 3·04) 1·80 (1·44 to 2·26) 1·40 (1·17 to 1·66) 0·87 (0·64 to 1·17) 4·07 (3·44 to 4·89) 0·08 (0·07 to 0·09) 0·12 (0·10 to 0·15) –2·33 (–3·01 to –1·64) –6·71 (–7·90 to –5·45) –4·95 (–5·66 to –4·21)* Moldova 4·15 (3·56 to 4·90) 5·43 (3·66 to 8·21) 3·24 (2·08 to 4·57) 2·05 (1·25 to 3·26) 10·68 (7·16 to 15·38) 0·18 (0·15 to 0·21) 0·46 (0·31 to 0·67) 0·54 (–1·72 to 3·11) –7·27 (–10·14 to –4·55) –4·15 (–5·85 to –2·49) Russia 4·09 (3·00 to 5·68) 4·43 (4·18 to 4·64) 2·56 (2·24 to 2·85) 1·78 (1·33 to 2·32) 8·75 (8·57 to 8·94) 7·48 (5·48 to 10·42) 15·92 (15·59 to 16·26) –0·67 (–0·82 to –0·51) –5·40 (–5·58 to –5·23) –3·51 (–3·59 to –3·42) Ukraine 4·16 (3·34 to 5·17) 4·89 (3·06 to 7·60) 2·83 (1·76 to 4·18) 1·91 (1·16 to 2·96) 9·60 (6·09 to 14·43) 2·02 (1·63 to 2·52) 4·66 (3·01 to 6·94) –0·01 (–2·76 to 2·84) –5·37 (–8·50 to –2·41) –3·22 (–5·14 to –1·50) Central Europe 3·05 (2·71 to 3·49) 3·03 (2·35 to 3·92) 1·94 (1·55 to 2·44) 0·92 (0·71 to 1·17) 5·88 (4·64 to 7·46) 3·50 (3·12 to 4·01) 6·78 (6·05 to 7·63) –4·79 (–5·08 to –4·47) –5·49 (–7·10 to –3·86) –5·21 (–6·15 to –4·25)* Albania 2·93 (2·41 to 3·56) 3·31 (2·28 to 5·02) 5·38 (3·60 to 7·48) 3·51 (2·34 to 5·13) 12·15 (8·48 to 17·15) 0·12 (0·10 to 0·14) 0·47 (0·33 to 0·66) –4·35 (–6·10 to –2·40) –5·26 (–7·85 to –2·74) –4·89 (–6·42 to –3·48)* Bosnia and Herzegovina 3·55 (3·03 to 4·24) 2·89 (2·42 to 3·42) 1·80 (1·52 to 2·10) 0·71 (0·52 to 0·96) 5·39 (4·64 to 6·24) 0·12 (0·10 to 0·14) 0·18 (0·16 to 0·21) –5·21 (–5·86 to –4·56) –4·67 (–5·76 to –3·60) –4·89 (–5·51 to –4·28)* Bulgaria 4·32 (3·65 to 5·09) 4·21 (2·95 to 5·78) 3·06 (2·09 to 4·36) 1·48 (0·99 to 2·16) 8·72 (6·22 to 12·09) 0·29 (0·25 to 0·35) 0·59 (0·42 to 0·82) –0·29 (–0·92 to 0·35) –4·71 (–7·07 to –2·60) –2·94 (–4·32 to –1·64) Croatia 1·68 (1·38 to 2·08) 2·70 (2·31 to 3·14) 1·07 (0·94 to 1·21) 0·64 (0·46 to 0·86) 4·40 (3·87 to 5·00) 0·07 (0·06 to 0·08) 0·18 (0·16 to 0·20) –3·36 (–4·01 to –2·66) –4·48 (–5·42 to –3·56) –4·03 (–4·55 to –3·50) Czech Republic 2·20 (2·18 to 2·21) 1·23 (1·04 to 1·45) 0·86 (0·72 to 1·01) 0·40 (0·29 to 0·54) 2·49 (2·12 to 2·93) 0·24 (0·23 to 0·24) 0·27 (0·23 to 0·31) –8·04 (–8·77 to –7·27) –5·10 (–6·30 to –3·92) –6·27 (–6·93 to –5·60)* Hungary 2·90 (2·30 to 3·61) 3·05 (2·05 to 4·39) 1·29 (1·00 to 1·70) 0·61 (0·38 to 0·88) 4·94 (3·51 to 6·87) 0·27 (0·21 to 0·33) 0·46 (0·32 to 0·63) –4·87 (–5·50 to –4·24) –4·97 (–7·28 to –2·70) –4·93 (–6·31 to –3·63)* Macedonia 7·88 (6·70 to 9·22) 5·82 (3·86 to 8·74) 2·69 (1·74 to 3·83) 1·09 (0·68 to 1·64) 9·57 (6·38 to 13·95) 0·19 (0·16 to 0·22) 0·22 (0·15 to 0·33) –8·13 (–8·97 to –7·31) –3·17 (–5·87 to –0·67) –5·15 (–6·81 to –3·61)* Montenegro 3·54 (2·84 to 4·50) 2·91 (1·99 to 4·10) 1·76 (1·35 to 2·27) 0·53 (0·34 to 0·77) 5·18 (3·78 to 7·01) 0·03 (0·02 to 0·03) 0·04 (0·03 to 0·05) 0·49 (–2·62 to 3·89) –9·02 (–11·20 to –6·90) –5·22 (–6·96 to –3·34)* Poland 2·35 (2·02 to 2·78) 2·69 (1·80 to 3·91) 1·23 (0·95 to 1·61) 0·59 (0·38 to 0·85) 4·50 (3·18 to 6·29) 0·91 (0·78 to 1·08) 1·75 (1·24 to 2·45) –6·40 (–6·73 to –6·06) –4·89 (–7·21 to –2·67) –5·49 (–6·86 to –4·17)* Romania 3·46 (2·81 to 4·34) 3·62 (2·71 to 4·65) 3·27 (2·40 to 4·53) 1·47 (0·99 to 2·07) 8·34 (6·31 to 10·95) 0·62 (0·50 to 0·78) 1·51 (1·15 to 1·99) –3·58 (–3·90 to –3·26) –6·79 (–8·61 to –5·01) –5·50 (–6·62 to –4·43)* Serbia 4·88 (4·02 to 6·01) 4·30 (3·87 to 4·77) 2·43 (2·09 to 2·80) 1·01 (0·73 to 1·38) 7·72 (6·98 to 8·54) 0·44 (0·36 to 0·55) 0·70 (0·63 to 0·77) –6·23 (–8·14 to –4·37) –3·40 (–4·35 to –2·46) –4·54 (–5·33 to –3·78)* Slovakia 2·85 (2·79 to 2·91) 3·09 (2·51 to 3·76) 2·02 (1·68 to 2·44) 0·88 (0·64 to 1·18) 5·99 (5·01 to 7·16) 0·16 (0·16 to 0·17) 0·34 (0·29 to 0·41) –3·80 (–4·57 to –2·96) –3·21 (–4·41 to –1·96) –3·45 (–4·19 to –2·69) Slovenia 2·57 (2·20 to 3·06) 1·40 (1·20 to 1·64) 0·79 (0·67 to 0·92) 0·46 (0·33 to 0·61) 2·64 (2·29 to 3·04) 0·06 (0·05 to 0·07) 0·06 (0·05 to 0·07) –6·23 (–7·19 to –5·20) –4·75 (–5·86 to –3·71) –5·35 (–5·96 to –4·74)* (Table 2 continues on next page)
(Continued from previous page) Central Asia 7·23 (5·95 to 8·98) 13·31 (11·00 to 15·87) 7·55 (5·89 to 9·63) 4·93 (3·92 to 6·13) 25·59 (21·16 to 31·10) 14·00 (11·50 to 17·42) 49·17 (44·30 to 54·66) –1·74 (–2·51 to –0·95) –4·49 (–5·80 to –3·22) –3·39 (–4·18 to –2·61) Armenia 6·35 (5·17 to 7·74) 7·82 (5·61 to 10·45) 4·07 (3·15 to 5·19) 3·13 (2·12 to 4·36) 14·95 (11·62 to 18·98) 0·25 (0·20 to 0·31) 0·59 (0·46 to 0·75) –4·17 (–5·67 to –2·62) –4·89 (–6·81 to –3·12) –4·60 (–5·68 to –3·58)* Azerbaijan 8·06 (6·47 to 10·22) 15·85 (12·79 to 19·17) 9·99 (6·96 to 13·98) 4·14 (2·78 to 6·00) 29·71 (23·10 to 37·70) 1·57 (1·26 to 2·00) 5·79 (4·50 to 7·35) –2·25 (–3·77 to –0·68) –5·18 (–6·99 to –3·42) –4·01 (–5·16 to –3·01) Georgia 4·99 (3·51 to 6·91) 9·57 (7·31 to 12·16) 4·60 (3·67 to 5·95) 3·31 (2·27 to 4·73) 17·39 (13·91 to 21·52) 0·27 (0·19 to 0·38) 0·95 (0·76 to 1·17) –1·33 (–2·67 to 0·10) –4·89 (–6·45 to –3·37) –3·47 (–4·49 to –2·48) Kazakhstan 6·38 (4·46 to 9·30) 9·18 (6·60 to 12·08) 4·50 (3·48 to 5·92) 3·74 (2·63 to 5·05) 17·33 (13·42 to 22·06) 2·42 (1·69 to 3·53) 6·54 (5·07 to 8·33) –0·89 (–2·52 to 0·73) –4·84 (–6·85 to –2·90) –3·26 (–4·30 to –2·21) Kyrgyzstan 8·12 (6·52 to 10·31) 17·00 (15·17 to 18·89) 7·71 (6·27 to 9·39) 4·50 (3·26 to 6·11) 28·96 (25·73 to 32·53) 1·26 (1·01 to 1·60) 4·45 (3·95 to 5·00) –2·71 (–3·34 to –2·05) –3·59 (–4·47 to –2·70) –3·24 (–3·76 to –2·71) Mongolia 5·74 (4·72 to 6·93) 14·34 (11·73 to 17·33) 8·25 (5·84 to 11·63) 5·75 (4·07 to 8·00) 28·09 (22·56 to 35·61) 0·40 (0·33 to 0·48) 1·94 (1·56 to 2·46) –4·06 (–5·23 to –2·81) –5·01 (–6·53 to –3·44) –4·63 (–5·56 to –3·71)* Tajikistan 8·37 (6·79 to 10·25) 15·39 (12·88 to 18·09) 11·45 (8·34 to 15·50) 6·34 (4·17 to 8·96) 32·84 (26·33 to 40·53) 2·16 (1·75 to 2·65) 8·34 (6·69 to 10·29) –2·59 (–3·90 to –1·25) –5·06 (–6·64 to –3·45) –4·07 (–5·03 to –3·12) Turkmenistan 8·88 (7·14 to 11·25) 19·18 (15·15 to 23·62) 13·00 (8·36 to 18·69) 7·94 (4·89 to 12·19) 39·61 (29·39 to 52·32) 1·00 (0·81 to 1·27) 4·43 (3·28 to 5·84) –1·96 (–4·61 to 0·56) –4·44 (–6·87 to –2·29) –3·45 (–4·78 to –2·21) Uzbekistan 6·94 (5·57 to 8·80) 12·78 (9·94 to 15·86) 6·51 (4·59 to 9·07) 5·10 (3·60 to 7·00) 24·20 (18·78 to 30·77) 4·66 (3·74 to 5·93) 16·15 (12·52 to 20·55) –1·45 (–3·20 to 0·34) –3·82 (–5·79 to –1·95) –2·87 (–3·92 to –1·81) Latin America and
Caribbean 6·87 (5·97 to 8·08) 9·28 (7·29 to 11·60) 5·87 (4·77 to 7·42) 3·27 (2·59 to 4·02) 18·31 (14·72 to 22·83) 67·81 (58·94 to 79·93) 179·94 (172·04 to 188·67) –4·73 (–5·39 to –4·04) –3·76 (–5·28 to –2·31) –4·15 (–5·04 to –3·30) Central Latin America 5·56 (4·81 to 6·51) 8·26 (6·37 to 10·56) 5·17 (4·24 to 6·60) 3·38 (2·70 to 4·17) 16·72 (13·36 to 20·93) 26·10 (22·56 to 30·60) 78·22 (73·59 to 83·46) –4·18 (–4·92 to –3·42) –3·47 (–5·00 to –1·98) –3·75 (–4·66 to –2·84) Colombia 9·52 (8·08 to 11·43) 7·11 (4·90 to 9·75) 5·22 (3·97 to 6·96) 3·55 (2·46 to 4·91) 15·81 (11·79 to 21·03) 7·18 (6·08 to 8·63) 11·88 (8·86 to 15·80) –2·96 (–4·06 to –1·89) –2·75 (–4·86 to –0·79) –2·83 (–4·05 to –1·67) Costa Rica 5·83 (5·03 to 6·77) 5·16 (3·79 to 7·12) 2·95 (2·05 to 3·97) 1·67 (1·09 to 2·40) 9·75 (7·13 to 13·22) 0·41 (0·35 to 0·48) 0·68 (0·50 to 0·93) –2·58 (–4·51 to –0·51) –3·15 (–5·55 to –0·70) –2·92 (–4·28 to –1·63) El Salvador 2·90 (2·40 to 3·55) 5·14 (3·60 to 7·67) 3·84 (2·54 to 5·24) 2·33 (1·54 to 3·36) 11·27 (7·99 to 15·71) 0·31 (0·25 to 0·38) 1·19 (0·85 to 1·66) –5·96 (–7·85 to –4·31) –6·33 (–8·71 to –4·01) –6·18 (–7·60 to –4·79)* Guatemala 6·08 (4·52 to 8·04) 8·96 (7·48 to 10·64) 9·62 (7·23 to 12·89) 7·62 (5·57 to 10·06) 25·97 (21·21 to 31·77) 2·68 (1·99 to 3·55) 11·28 (9·22 to 13·79) –4·55 (–5·24 to –3·81) –4·54 (–5·88 to –3·30) –4·55 (–5·39 to –3·73)* Honduras 8·40 (6·84 to 10·48) 11·56 (9·61 to 13·58) 6·02 (4·73 to 7·66) 4·77 (3·54 to 6·21) 22·20 (18·87 to 26·53) 1·43 (1·16 to 1·79) 3·76 (3·19 to 4·49) –4·08 (–4·73 to –3·39) –3·27 (–4·39 to –2·08) –3·60 (–4·28 to –2·90) Mexico 4·35 (3·76 to 5·09) 8·32 (5·93 to 11·22) 4·51 (3·49 to 6·00) 2·61 (1·81 to 3·55) 15·37 (11·72 to 20·04) 10·24 (8·86 to 11·99) 36·12 (33·37 to 39·10) –4·69 (–6·16 to –3·24) –3·73 (–5·60 to –1·82) –4·11 (–5·24 to –3·02) (Table 2 continues on next page)
(Continued from previous page) Nicaragua 5·34 (4·40 to 6·61) 7·71 (5·92 to 9·68) 5·09 (4·22 to 6·17) 2·63 (1·87 to 3·62) 15·36 (12·58 to 18·74) 0·65 (0·54 to 0·81) 1·87 (1·53 to 2·29) –5·67 (–6·44 to –5·00) –5·60 (–6·96 to –4·28) –5·63 (–6·44 to –4·82)* Panama 5·12 (4·27 to 6·09) 8·15 (5·63 to 11·06) 4·78 (3·49 to 6·67) 4·73 (3·39 to 6·32) 17·55 (13·19 to 23·18) 0·39 (0·32 to 0·46) 1·32 (0·99 to 1·74) –1·76 (–3·32 to –0·08) –1·78 (–3·80 to 0·29) –1·77 (–3·05 to –0·54) Venezuela 4·68 (3·85 to 5·79) 9·06 (8·25 to 9·88) 4·75 (4·17 to 5·30) 3·15 (2·35 to 4·07) 16·87 (15·77 to 18·09) 2·82 (2·32 to 3·49) 10·12 (9·46 to 10·85) –2·88 (–3·00 to –2·76) –1·49 (–1·95 to –1·03) –2·04 (–2·32 to –1·77) Andean Latin America 6·64 (5·77 to 7·73) 9·04 (7·85 to 10·31) 5·98 (5·05 to 7·03) 4·28 (3·54 to 5·19) 19·19 (16·94 to 21·57) 8·01 (6·96 to 9·34) 23·00 (20·71 to 25·26) –6·11 (–6·45 to –5·76) –5·17 (–5·99 to –4·36) –5·55 (–6·05 to –5·07)* Bolivia 10·61 (8·05 to 14·25) 15·36 (12·80 to 17·99) 8·81 (6·46 to 11·68) 5·46 (3·81 to 7·60) 29·37 (24·19 to 35·66) 2·72 (2·06 to 3·66) 7·42 (6·11 to 9·02) –4·88 (–5·43 to –4·37) –5·62 (–6·94 to –4·37) –5·32 (–6·11 to –4·56)* Ecuador 6·06 (5·36 to 6·83) 6·95 (5·68 to 8·28) 6·44 (5·16 to 7·95) 4·46 (3·30 to 5·84) 17·75 (15·24 to 20·70) 2·02 (1·78 to 2·27) 5·86 (5·03 to 6·84) –3·62 (–4·41 to –2·90) –4·25 (–5·24 to –3·26) –4·00 (–4·68 to –3·35) Peru 5·30 (4·39 to 6·36) 7·57 (6·09 to 9·24) 4·58 (3·79 to 5·51) 3·71 (2·72 to 4·90) 15·79 (13·50 to 18·77) 3·28 (2·71 to 3·93) 9·72 (8·30 to 11·55) –7·99 (–8·55 to –7·43) –5·29 (–6·38 to –4·17) –6·37 (–7·00 to –5·70)* Caribbean 16·16 (11·60 to 23·36) 15·21 (12·17 to 18·89) 10·62 (7·35 to 14·83) 6·36 (4·28 to 9·41) 31·87 (23·96 to 42·23) 12·84 (9·17 to 18·69) 24·98 (20·34 to 30·68) –3·75 (–4·51 to –3·00) –2·65 (–4·58 to –0·76) –3·09 (–4·23 to –1·98) Antigua and Barbuda 8·96 (6·41 to 12·78) 7·34 (4·86 to 11·09) 3·15 (2·15 to 4·32) 2·43 (1·57 to 3·47) 12·87 (8·84 to 18·41) 0·01 (0·01 to 0·02) 0·02 (0·01 to 0·03) –0·01 (–2·13 to 2·50) –2·54 (–4·97 to –0·27) –1·53 (–3·13 to 0·17) The Bahamas 12·81 (9·72 to 17·15) 11·67 (6·33 to 20·60) 2·58 (1·57 to 4·87) 2·02 (1·08 to 3·32) 16·21 (9·06 to 28·81) 0·08 (0·06 to 0·10) 0·09 (0·05 to 0·17) –5·73 (–10·16 to –1·30) –0·83 (–5·30 to 3·18) –2·79 (–5·41 to –0·15) Barbados 11·28 (7·45 to 17·35) 11·04 (5·94 to 18·79) 3·66 (2·17 to 6·52) 1·58 (0·91 to 2·46) 16·22 (9·12 to 27·31) 0·04 (0·03 to 0·06) 0·06 (0·03 to 0·09) –2·30 (–6·85 to 2·54) –1·71 (–6·40 to 2·77) –1·95 (–4·63 to 0·78) Belize 11·33 (8·11 to 16·16) 9·40 (5·50 to 15·24) 4·08 (2·73 to 7·02) 3·27 (2·06 to 4·91) 16·67 (10·54 to 26·60) 0·09 (0·07 to 0·13) 0·14 (0·09 to 0·22) –4·10 (–6·87 to –1·39) –2·93 (–6·26 to 0·40) –3·40 (–5·38 to –1·51) Bermuda 5·93 (4·49 to 7·77) 2·61 (1·61 to 4·04) 1·18 (0·83 to 1·63) 0·54 (0·34 to 0·82) 4·32 (2·84 to 6·43) <0·01 (<0·01 to 0·01) <0·01 (<0·01 to 0·01) –9·00 (–13·58 to –4·68) –0·33 (–3·78 to 3·67) –3·80 (–5·83 to –1·99) Cuba 10·70 (8·23 to 14·18) 3·22 (3·00 to 3·48) 1·80 (1·60 to 1·99) 1·08 (0·82 to 1·40) 6·08 (5·77 to 6·46) 1·24 (0·95 to 1·65) 0·70 (0·67 to 0·75) –4·88 (–5·11 to –4·63) –2·15 (–2·52 to –1·74) –3·24 (–3·45 to –3·01) Dominica 14·17 (10·14 to 20·21) 15·60 (9·98 to 21·99) 6·31 (3·50 to 11·09) 4·74 (2·92 to 7·59) 26·45 (17·11 to 39·73) 0·02 (0·01 to 0·02) 0·03 (0·02 to 0·05) –0·42 (–3·16 to 2·29) 0·62 (–2·47 to 3·51) 0·20 (–1·84 to 2·21) Dominican Republic 8·13 (6·08 to 10·79) 15·08 (12·43 to 18·02) 6·30 (4·75 to 8·36) 3·79 (2·74 to 5·15) 25·00 (20·52 to 30·44) 1·77 (1·32 to 2·35) 5·41 (4·44 to 6·58) –4·75 (–5·69 to –3·82) –2·62 (–4·07 to –1·20) –3·47 (–4·32 to –2·69) Grenada 10·06 (7·20 to 14·35) 9·26 (4·77 to 16·06) 3·49 (1·92 to 6·31) 3·24 (1·86 to 5·37) 15·92 (8·68 to 27·47) 0·02 (0·01 to 0·03) 0·03 (0·02 to 0·06) –2·97 (–8·39 to 3·01) –1·65 (–6·34 to 2·82) –2·18 (–5·10 to 0·70) Guyana 11·96 (8·80 to 16·58) 16·83 (13·60 to 20·47) 7·17 (4·90 to 10·38) 4·18 (2·85 to 6·00) 27·96 (22·01 to 35·41) 0·18 (0·13 to 0·25) 0·41 (0·32 to 0·52) –2·46 (–3·37 to –1·56) –2·50 (–4·17 to –0·95) –2·49 (–3·52 to –1·48) (Table 2 continues on next page)
(Continued from previous page) Haiti 28·33 (17·49 to 46·39) 23·56 (18·54 to 29·60) 22·45 (14·81 to 32·24) 13·50 (8·04 to 21·41) 58·37 (42·11 to 79·74) 7·69 (4·69 to 12·81) 15·37 (11·08 to 21·05) –4·37 (–5·47 to –3·30) –3·30 (–5·53 to –1·14) –3·73 (–5·05 to –2·46) Jamaica 13·16 (10·34 to 16·59) 10·77 (6·38 to 16·32) 4·00 (2·68 to 6·63) 3·46 (2·24 to 5·07) 18·13 (11·58 to 27·58) 0·64 (0·50 to 0·81) 0·88 (0·56 to 1·33) –2·24 (–6·28 to 1·67) –1·29 (–4·85 to 2·15) –1·67 (–3·72 to 0·28) Puerto Rico 6·03 (4·45 to 7·99) 4·68 (4·09 to 5·32) 1·50 (1·31 to 1·74) 0·85 (0·62 to 1·13) 7·02 (6·24 to 7·92) 0·26 (0·19 to 0·35) 0·31 (0·27 to 0·34) –2·83 (–3·25 to –2·38) –3·35 (–4·18 to –2·55) –3·14 (–3·62 to –2·66) Saint Lucia 12·14 (8·86 to 16·91) 10·17 (4·97 to 17·64) 4·22 (2·20 to 8·30) 3·36 (1·85 to 5·59) 17·66 (9·22 to 31·46) 0·03 (0·02 to 0·05) 0·05 (0·03 to 0·09) –4·45 (–9·88 to 1·13) –0·85 (–6·00 to 3·70) –2·29 (–5·21 to 0·55) Saint Vincent and the Grenadines 12·02 (9·34 to 15·71) 13·81 (8·40 to 20·51) 4·94 (3·06 to 8·70) 3·29 (2·11 to 5·10) 21·92 (13·83 to 33·62) 0·02 (0·02 to 0·03) 0·04 (0·02 to 0·06) –2·22 (–5·16 to 1·07) –2·48 (–5·60 to 0·70) –2·38 (–4·54 to –0·22) Suriname 14·53 (11·02 to 19·50) 18·25 (15·00 to 22·15) 8·43 (6·10 to 11·96) 4·73 (3·10 to 6·92) 31·12 (24·92 to 39·54) 0·14 (0·11 to 0·19) 0·30 (0·24 to 0·39) –1·34 (–2·51 to –0·14) –2·40 (–3·62 to –1·07) –1·97 (–2·93 to –1·01) Trinidad and Tobago 9·98 (7·81 to 12·72) 13·21 (7·77 to 20·01) 4·01 (2·68 to 6·80) 2·10 (1·32 to 3·31) 19·23 (11·91 to 29·98) 0·19 (0·15 to 0·24) 0·37 (0·23 to 0·57) –0·24 (–2·12 to 1·75) –2·39 (–5·68 to 0·64) –1·53 (–3·61 to 0·30) Virgin Islands 7·21 (5·16 to 10·25) 5·41 (4·46 to 6·46) 2·14 (1·68 to 2·71) 1·17 (0·82 to 1·64) 8·70 (7·20 to 10·53) 0·01 (0·01 to 0·01) 0·01 (0·01 to 0·02) –2·59 (–3·63 to –1·52) –2·27 (–3·56 to –1·03) –2·40 (–3·25 to –1·54) Tropical Latin America 6·56 (5·88 to 7·35) 9·41 (7·10 to 12·00) 5·69 (4·64 to 7·26) 1·97 (1·36 to 2·74) 16·99 (13·44 to 21·40) 20·86 (18·66 to 23·38) 53·74 (50·08 to 57·67) –5·02 (–6·62 to –3·43) –4·03 (–5·90 to –2·28) –4·43 (–5·45 to –3·44)* Brazil 6·63 (5·91 to 7·41) 9·38 (7·08 to 11·98) 5·72 (4·67 to 7·29) 1·93 (1·30 to 2·72) 16·94 (13·40 to 21·36) 20·12 (17·94 to 22·53) 51·23 (47·60 to 55·14) –5·12 (–6·80 to –3·46) –4·08 (–5·94 to –2·28) –4·50 (–5·51 to –3·50)* Paraguay 5·24 (4·26 to 6·56) 10·04 (7·68 to 12·67) 4·97 (3·90 to 6·47) 3·00 (2·14 to 4·23) 17·91 (14·27 to 22·43) 0·74 (0·60 to 0·93) 2·51 (2·00 to 3·15) –1·46 (–2·85 to –0·07) –3·00 (–4·66 to –1·32) –2·39 (–3·36 to –1·42) Southeast Asia, east
Asia, and Oceania 7·41 (6·00 to 9·13) 8·16 (6·84 to 10·12) 4·78 (3·89 to 5·76) 3·52 (2·79 to 4·38) 16·37 (13·68 to 19·63) 221·16 (178·89 to 273·10) 486·21 (457·30 to 515·88) –3·59 (–5·07 to –2·00) –6·26 (–7·58 to –4·95) –5·19 (–6·11 to –4·27)* East Asia 6·84 (4·86 to 9·44) 6·12 (4·23 to 9·02) 3·52 (2·42 to 4·67) 2·80 (1·81 to 4·09) 12·40 (8·78 to 17·24) 118·87 (84·29 to 164·36) 214·53 (197·97 to 232·25) –3·34 (–5·98 to –0·59) –7·75 (–10·35 to –5·33) –5·99 (–7·59 to –4·44)* China 6·87 (4·84 to 9·56) 6·07 (4·10 to 9·06) 3·50 (2·38 to 4·71) 2·80 (1·77 to 4·11) 12·32 (8·60 to 17·18) 115·38 (81·11 to 160·95) 206·24 (189·46 to 222·99) –3·95 (–6·57 to –1·21) –7·45 (–10·11 to –4·90) –6·05 (–7·75 to –4·41)* North Korea 6·30 (3·92 to 10·25) 10·33 (4·48 to 18·43) 5·46 (2·48 to 11·99) 3·54 (1·77 to 6·44) 19·22 (8·96 to 36·30) 2·29 (1·42 to 3·73) 6·91 (3·22 to 13·04) 9·89 (–3·24 to 20·62) –13·77 (–21·61 to –3·87) –4·30 (–8·41 to –0·10) Taiwan (province of China) 5·62 (4·22 to 7·38) 2·99 (1·79 to 4·62) 1·65 (1·09 to 2·64) 1·94 (1·26 to 3·01) 6·56 (4·24 to 10·28) 1·21 (0·91 to 1·59) 1·38 (0·89 to 2·17) –0·23 (–0·73 to 0·30) –1·75 (–4·62 to 1·23) –1·14 (–2·90 to 0·63) Southeast Asia 8·05 (6·56 to 9·87) 10·94 (9·76 to 12·15) 6·30 (5·36 to 7·35) 4·41 (3·70 to 5·23) 21·51 (19·24 to 24·07) 98·07 (79·77 to 120·44) 260·36 (239·97 to 283·16) –4·47 (–4·89 to –4·07) –4·87 (–5·69 to –4·13) –4·71 (–5·15 to –4·26)* Cambodia 11·21 (8·84 to 14·08) 15·85 (14·10 to 17·65) 11·33 (9·06 to 13·95) 4·48 (3·13 to 5·99) 31·36 (27·22 to 36·01) 4·20 (3·31 to 5·29) 11·60 (10·07 to 13·32) –1·92 (–2·51 to –1·33) –7·54 (–8·56 to –6·59) –5·30 (–5·89 to –4·75)* (Table 2 continues on next page)
(Continued from previous page) Indonesia 8·50 (6·83 to 10·42) 12·45 (10·69 to 14·23) 6·88 (5·48 to 8·56) 4·52 (3·32 to 5·99) 23·68 (20·44 to 27·48) 43·17 (34·64 to 53·05) 119·59 (103·20 to 138·79) –5·22 (–5·66 to –4·78) –4·99 (–6·01 to –4·00) –5·08 (–5·68 to –4·49)* Laos 21·20 (13·88 to 32·89) 27·46 (22·71 to 33·46) 24·22 (17·33 to 33·52) 9·65 (5·68 to 14·98) 60·18 (45·77 to 77·70) 3·88 (2·52 to 6·09) 10·74 (8·17 to 13·89) –2·57 (–3·70 to –1·50) –5·77 (–7·75 to –4·00) –4·49 (–5·67 to –3·38)* Malaysia 4·15 (3·43 to 4·98) 3·06 (2·48 to 3·71) 1·97 (1·58 to 2·43) 1·48 (1·07 to 1·97) 6·50 (5·51 to 7·69) 2·12 (1·75 to 2·55) 3·27 (2·77 to 3·87) –5·94 (–6·24 to –5·65) –2·37 (–3·49 to –1·26) –3·80 (–4·46 to –3·15) Maldives 5·13 (3·98 to 6·53) 5·89 (4·75 to 7·54) 3·42 (2·77 to 4·13) 3·15 (2·29 to 4·14) 12·41 (10·34 to 15·16) 0·04 (0·03 to 0·05) 0·09 (0·08 to 0·11) –6·27 (–7·05 to –5·50) –7·07 (–8·25 to –5·84) –6·75 (–7·51 to –5·92)* Mauritius 8·34 (6·59 to 10·78) 7·93 (7·04 to 8·95) 3·25 (2·89 to 3·62) 2·28 (1·69 to 3·00) 13·41 (12·26 to 14·71) 0·12 (0·09 to 0·15) 0·19 (0·17 to 0·21) –2·26 (–2·75 to –1·77) –1·91 (–2·54 to –1·27) –2·05 (–2·43 to –1·66) Myanmar 8·59 (6·40 to 11·28) 16·37 (13·10 to 20·28) 10·21 (6·90 to 15·21) 6·12 (3·98 to 9·15) 32·37 (24·80 to 43·01) 8·17 (6·08 to 10·77) 30·72 (23·58 to 40·78) –3·40 (–5·74 to –1·13) –5·90 (–8·02 to –3·64) –4·90 (–6·17 to –3·64)* Philippines 8·37 (6·53 to 10·60) 11·01 (9·58 to 12·56) 6·12 (4·96 to 7·50) 6·23 (4·71 to 7·91) 23·19 (20·52 to 26·26) 19·83 (15·44 to 25·16) 54·21 (47·98 to 61·42) –4·26 (–4·78 to –3·73) –3·01 (–3·88 to –2·16) –3·51 (–4·03 to –2·98) Sri Lanka 4·01 (2·58 to 6·32) 4·42 (3·32 to 5·69) 1·64 (1·20 to 2·30) 2·02 (1·39 to 2·85) 8·07 (6·17 to 10·49) 1·30 (0·84 to 2·05) 2·64 (2·02 to 3·43) –9·15 (–9·60 to –8·73) –4·72 (–6·51 to –2·98) –6·50 (–7·60 to –5·48)* Seychelles 8·17 (6·20 to 10·97) 5·29 (4·24 to 6·75) 2·87 (2·16 to 3·55) 2·53 (1·78 to 3·45) 10·65 (8·58 to 13·19) 0·01 (0·01 to 0·02) 0·02 (0·01 to 0·02) –2·73 (–3·91 to –1·55) –1·54 (–3·08 to 0·01) –2·02 (–2·95 to –1·10) Thailand 3·43 (2·61 to 4·46) 3·35 (2·61 to 4·23) 1·30 (1·03 to 1·61) 1·00 (0·72 to 1·36) 5·64 (4·54 to 6·98) 2·46 (1·87 to 3·20) 4·08 (3·29 to 5·05) –6·11 (–7·20 to –4·90) –6·54 (–8·04 to –4·95) –6·37 (–7·34 to –5·38)* Timor-Leste 17·30 (12·21 to 24·10) 16·37 (11·50 to 22·15) 15·87 (8·35 to 26·63) 6·90 (3·85 to 12·62) 38·66 (23·92 to 59·18) 0·77 (0·54 to 1·08) 1·69 (1·04 to 2·59) –3·37 (–4·80 to –1·88) –6·86 (–10·08 to –3·94) –5·46 (–7·39 to –3·72)* Vietnam 7·46 (5·00 to 11·29) 6·98 (5·72 to 8·70) 3·71 (3·09 to 4·46) 2·79 (1·95 to 3·83) 13·43 (11·49 to 15·94) 11·89 (7·95 to 18·06) 21·23 (18·16 to 25·21) –5·36 (–6·10 to –4·67) –4·87 (–5·86 to –3·81) –5·07 (–5·71 to –4·37)* Oceania 14·42 (10·10 to 20·93) 13·71 (9·62 to 18·81) 16·65 (8·69 to 28·09) 9·53 (5·16 to 17·79) 39·38 (24·09 to 61·81) 4·21 (2·94 to 6·15) 11·32 (7·38 to 17·00) –1·53 (–4·15 to 0·91) –3·21 (–6·26 to –0·48) –2·54 (–4·57 to –0·62) American Samoa 4·86 (3·93 to 6·12) 3·07 (2·36 to 3·82) 2·50 (1·91 to 3·25) 1·54 (1·02 to 2·19) 7·09 (5·70 to 8·80) 0·01 (0·01 to 0·02) 0·02 (0·01 to 0·02) –2·79 (–3·99 to –1·57) –4·45 (–6·02 to –2·97) –3·79 (–4·77 to –2·84) Federated States of Micronesia 6·07 (4·18 to 8·96) 4·92 (3·23 to 7·77) 4·10 (2·61 to 5·77) 2·52 (1·47 to 3·92) 11·49 (7·70 to 16·79) 0·02 (0·01 to 0·02) 0·03 (0·02 to 0·04) –5·38 (–9·24 to –1·69) –4·86 (–7·83 to –1·82) –5·07 (–6·96 to –3·27)* Fiji 7·83 (6·49 to 9·39) 12·16 (7·94 to 16·89) 13·80 (7·22 to 24·50) 4·74 (2·64 to 8·51) 30·40 (18·20 to 48·60) 0·14 (0·11 to 0·17) 0·54 (0·32 to 0·86) 0·71 (–3·13 to 4·28) 0·35 (–3·47 to 4·01) 0·50 (–1·91 to 3·04) Guam 12·07 (9·86 to 14·66) 8·47 (6·17 to 10·97) 5·95 (4·56 to 7·95) 3·14 (2·04 to 4·69) 17·47 (13·61 to 22·34) 0·04 (0·03 to 0·04) 0·05 (0·04 to 0·06) –1·40 (–2·80 to –0·01) 2·67 (0·77 to 4·56) 1·04 (0·03 to 2·05) Kiribati 12·67 (10·26 to 15·94) 15·16 (9·64 to 22·07) 16·38 (7·10 to 30·58) 8·04 (3·79 to 16·38) 39·08 (21·28 to 67·13) 0·04 (0·03 to 0·05) 0·12 (0·07 to 0·21) –2·65 (–5·26 to 0·35) –3·36 (–7·69 to 0·53) –3·08 (–5·57 to –0·83) (Table 2 continues on next page)