Abstract: This study compares the profitability of investment recommendations of analysts listed in four different star rankings: Institutional Investor magazine, StarMine's "Top Earnings Estimators" and "Top Stock Pickers" and The Wall Street Journal. However, we pursue the common goal of providing evidence on whether profitable investment strategies, assuming no transaction costs, could be based on the use of analyst recommendations. We only consider companies covered by star analysts in the year after or year before and identify all other analysts who cover the same companies (non-star group) during the same time period (year before or year after).
Comparing the long portfolios of the top-ranked analysts, we find that the number one ranked analyst by The Wall Street Journal had higher returns than the group of Non-Star analysts and that the difference in returns was statistically significant. Our results show that star analysts, who are ranked in terms of the accuracy of their earnings forecasts and the profitability of their recommendations, both in the StarMine methodology. Top Earnings Estimates" show more consistent performance from rating year to subsequent year than star analysts, who are ranked exclusively on the basis of the prior performance of their recommendations (stars ranked by The Wall Street Journal and StarMine's "Top Stock Picker").
Our contribution is in the comparison of four different star rankings with a focus on the profitability of investment recommendations using a recent dataset with a unique (hand-collected) list of star analysts. Emery and Li (2009) find that, for the period after they become stars, star analysts' forecast accuracy of earnings per share (EPS) does not differ from that of their non-star peers; the recommendations of I/I stars are not statistically better than those of non-stars, while the recommendations of WSJ stars are significantly weaker. Emery and Li (2009) find that, after becoming stars, WSJ star analysts issue recommendations that underperform the group of non-stars.
Furthermore, Kerl and Ohlert (2015) focus only on the accuracy of EPS and TP and the factors affecting such accuracy and do not compare the performance of recommendations given by star analysts with that of non-stars.
3 Results: risk-adjusted portfolio returns
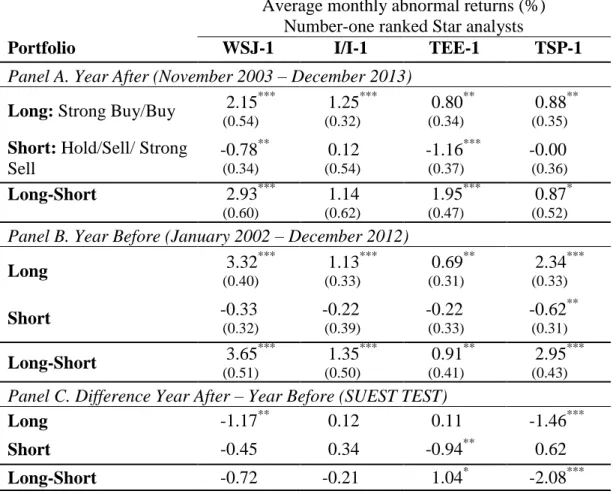
I/I', 'TSP', 'TEE' and 'WSJ' in the year later (Panel A) and the year before (Panel B) and the difference in returns between the year later and the year before (Panel C). The highest return among the Short portfolios in the following year was generated by the TEE-1 group, i.e. -1.16 percent, and the lowest return by I/I-1, i.e. 0.12 percent (statistically insignificant). Among the long portfolios, in the year after the election, the Long portfolio of the most successful analysts WSJ-1 generated the highest excess return, i.e. +2.15 percent, while the lowest excess return was generated by TEE-1, i.e. 0.80 percent.
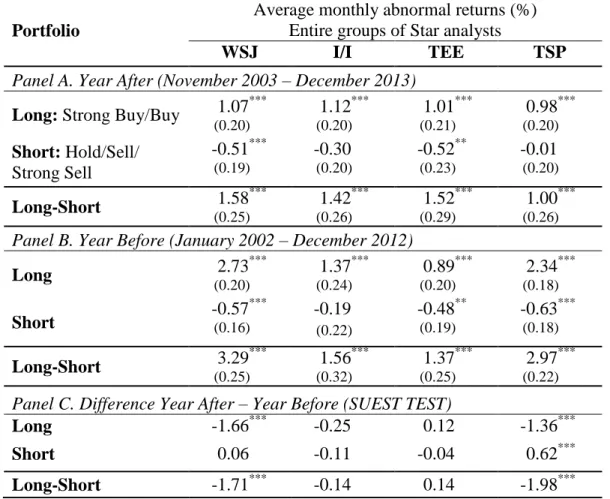
In Table VIII we report the alpha differentials obtained by comparing the abnormal returns between groups of Stars in the Year After and Year Before for Long (Panels A and B) and Short (Panels C and D) portfolios. Comparing the returns of the Long portfolios of all the groups of Stars with those of Non-Stars in the following year (first column in Panel A of Table VIII), we find that the returns of TEE and TSP Stars did not differ significantly from that of the group of non-stars, while WSJ and I/I stars significantly outperformed non-stars. However, in the previous year (panel B), the results are similar: WSJ, I/I and TSP Stars outperform non-stars, while the returns of TEE stars are not significantly different from those of non-stars.
Similar results are found for the returns of the number one ranked stars: in the previous year the WSJ-1 and TSP-1 stars significantly outperformed the non-stars, but the returns of the I/I-1 and TEE-1 Stars were not significantly. The difference in the returns of the long portfolios among entire groups of Star analysts shows that while WSJ Stars significantly outperformed I/I, TEE, and TSP Stars in the previous year (Panel B), the differences in returns among all groups in the year after are negligible. In the previous year (panel B), there were statistically significant differences in returns among number 1 ranked stars (except that the returns for the group of I/I-1 were not significantly different from those of TEE-1).
Analyzing Panels C and D of Table VIII for the Short portfolios, we find that the differences between the excess returns of all the groups of Stars and those of Non-Stars were insignificant in the subsequent year, except for WSJ Stars and Number One . classified TEE-1 Stars. In the previous year, WSJ Stars, TEE Stars and TSP Stars significantly outperformed the group of non-stars. However, the differences in returns between most of the Short portfolios in the year after are insignificant, except that WSJ and TEE-1 significantly outperform some other groups of Stars.
In the all-Star group, I/I and TSP Stars had the highest number of months when their long portfolios outperformed the long portfolios of other Star groups. However, we observed significantly positive returns for WSJ and WSJ-1 Stars, which outperformed non-stars in the year following selection, although there is a decline in performance compared to the evaluation year. In contrast, the returns for I/I and TEE Stars in the Year After differ insignificantly from those of the Year Before.
However, our study shows that the performance of analysts in the year before election to the I/I star list differs from the performance of the Non-Star group, while after the I/I star list. We interpret this fact to mean that it is difficult to be ranked among the stars without being better than the non-stars the year before.
4 Conclusion
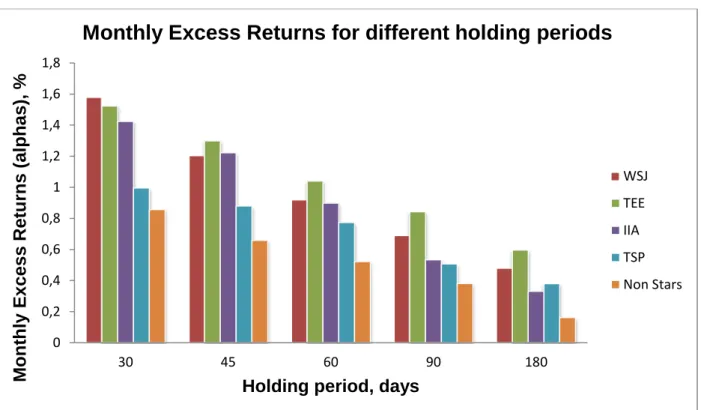
Our main analysis checks for differences in star ranking performance across different ratings. In this we use a method used by other researchers (Barber et al., 2006; Fang and Yasuda, 2013) by holding stocks for 30 calendar days in the portfolio. All four overall (Long-Short) Stars portfolios outperform the Long-Short portfolio of Non-Stars.
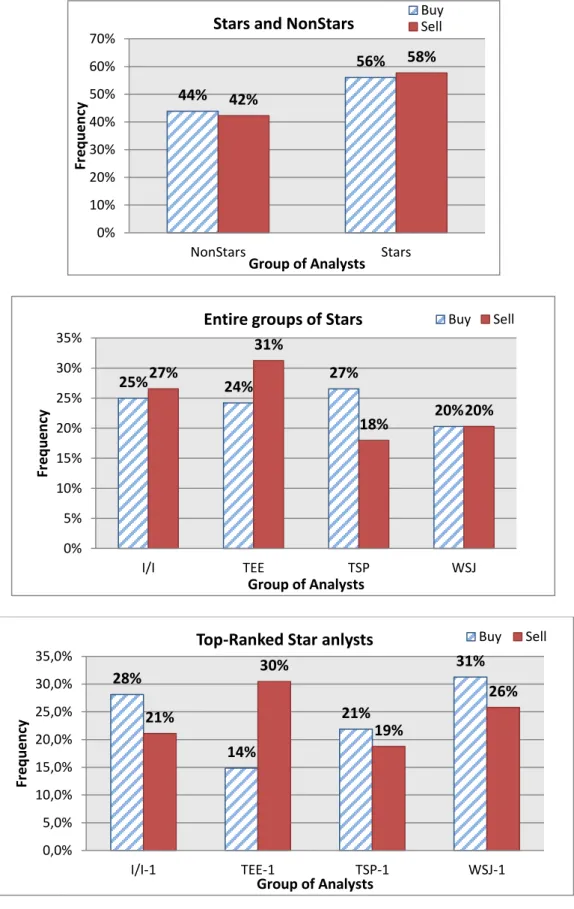
The WSJ and TSP have the highest percentages of the same analysts appearing in both rankings in the same year (with an average of 31 percent of analysts), while the WSJ and I/I have the lowest percentages of interdependence (9 percent average) . . The performance of the WSJ, I/I and TSP analysts decline in the year following star election, while TEE analysts show an increase in their investment value. Their recommendations outperform Non-Stars and other groups ranked only by the past profitability of their recommendations, with the exception of analysts ranked by "The Wall Street Journal".
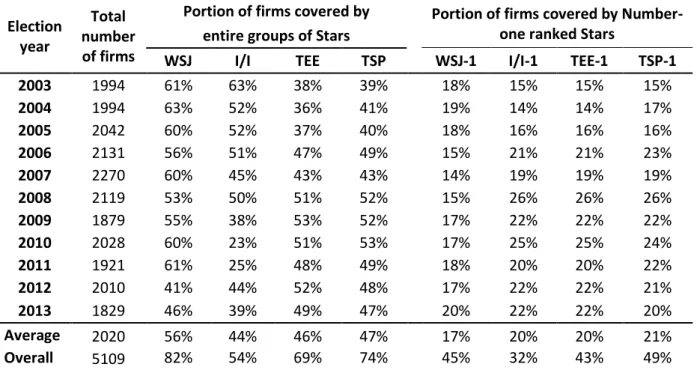
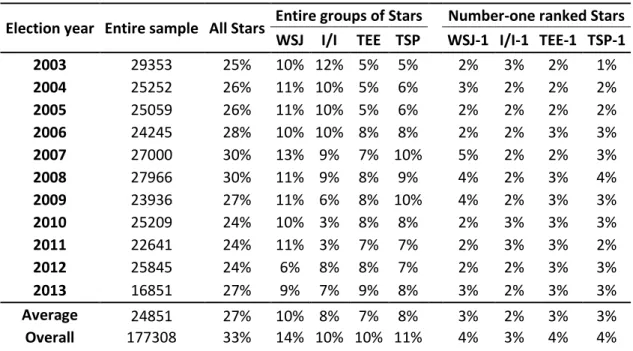
In our study, we provided empirical evidence on which sell-side analyst estimates a potential investor should rely on, namely “The Wall Street Journal” and “Top Earnings Estimators” by StarMine. Furthermore, our results suggest that stock-picking ability reflects a set of skills that can be captured by mixed valuation methods, such as surveys or other methods that simultaneously consider recommendations and earnings forecasts. The number of companies and the percentage of companies in the sample covered by each group, calculated on the basis of the election year. The first-ranked I/I analysts cover half of the companies in the entire I/I Stars group (which includes the 3 other positions in the ranking).
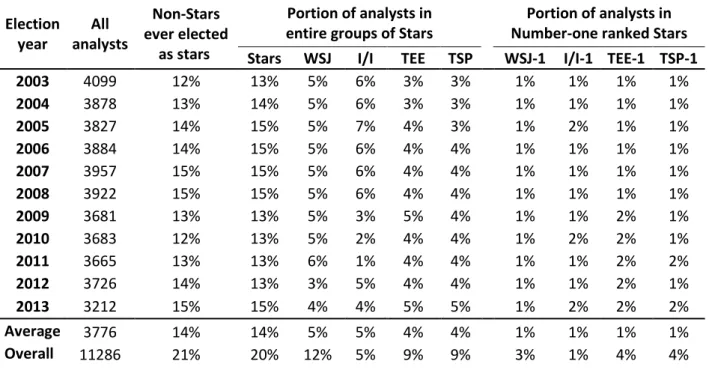
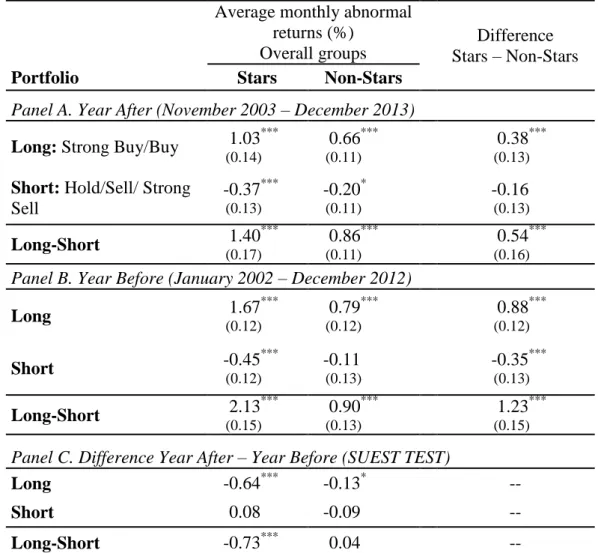
Number of analysts and the percentage of each group represented in the sample by election year. Average percentage of interdependence between rankings, average number of analysts in given groups, and the share of the same analysts in each ranking. All figures are obtained as intercepts from the regressions of the time series of monthly returns from two sample periods: the year before (January 2002 - December 2012) and the year after (November 2003 - December 2013) on four standard risk factors (Carhart's four-factor model).
Star analyst buy and sell recommendations have higher abnormal returns than Non-Stars recommendations in the year following the election and in the evaluation year. The highest one-year abnormal returns were generated by TEE recommendations, while the lowest were observed for I/I and TSP. Portfolios are built according to recommendations: when a new recommendation is published, $1 is invested in the recommended stock until the end of the trading day (or the next trading day if the recommendation is issued after the close of trading or published on a non-trading day), and the stock is held for the following 30 calendar days or until the same analyst changes his recommendation or withdraws coverage; in which case the stock is withdrawn by the end of that trading day.
Statistically insignificant abnormal returns were observed for WSJ-1's Short portfolio, TSP-1's Long portfolio in the year after selection, and TEE-1's Long-Short portfolio during the evaluation year. Alpha differences calculated as the difference in the extra return of the horizontal group minus the extra return for a vertical group of stars.