Information Requirements
Supporting Operational Decisions in
a Smart Factory
Master thesis
30 credits, Advanced level
Product and Process Development Production and Logistics
Julia Ekstrand & Jack Hellberg
2018
Report code: PPU503 Commissioned by: RISE Tutor (RISE): Jawad Elomari
Tutor (University): Erik Flores García Examiner: Antii Salonen
ABSTRACT
Today, companies are facing increasing global competition. Market borders are deleted, and the demand and supply of products are greater than ever. Being an actor on the global market brings new opportunities, but it also triggers manufacturing companies to change, to stay competitive and meet rapidly increasing requirements. Industry 4.0 aims to solve these issues with the concept of a Smart Factory. Information is the heart of a Smart Factory, and it has the potential to improve people’s ability to make higher quality operational decisions to increase production efficiency. Making operational decisions on inadequate or inaccurate information leads to increased operational costs, problems in production scheduling and inefficient production system development. To turn traditional factories into smart factories, information requirements for operational decisions in a Smart Factory needs to be characterised and concretised.
Purpose: The purpose of this thesis is to analyse information requirements for operational decisions in smart factories. To be able to fulfil the purpose of the study, four research questions have been stated:
RQ 1: What characterises information for operational decisions in a Smart Factory? RQ 2: Why are information requirements for operational
decisions in a Smart Factory necessary?
RQ 3: What information contributes to operational decisions in a Smart Factory? RQ 4: How can information requirements support operational decisions in a Smart
Factory?
Methodology: To fulfil the purpose, a case study was performed at the case company in collaboration with Research Institutes of Sweden (RISE). The case study consisted of observations, interviews, and other types of data collection. A literature review was based on a study of information in smart factories, with the focus on facilitating operational decisions. The empirical findings and the literature review were analysed to highlight similarities and differences to answer the research questions.
Findings: The literature review together with the case study, contributed to a list of information requirements for operational decisions in a Smart Factory. The main contribution was presented in a graph, showing how the case company compares to the information requirements of a Smart Factory. The graph will point companies in a direction towards the requirements of a Smart Factory.
Recommendations: Future research regarding weighing of information requirements is required.
Keywords: Information Requirements, Industry 4.0, Operational Decisions, Production System Development, Smart Factory
ACKNOWLEDGEMENTS
This master thesis consists of 30 credits and is written as a final examination in the MSc program within Product and Process Development at Malardalens University in Eskilstuna. We would like to express our gratitude to the case company and RISE for giving us the opportunity to make this thesis project. Thanks to our case company supervisor, who was our contact person at the case company and thanks to all interviewees who helped us to gather vital information. Thanks to Jawad Elomari at RISE for being our supervisor and for his insightful discussions regarding simulation models and data. We would also like to give special thanks to our academic supervisor Erik Flores. Erik has provided us with clear goals, guidance, and has throughout the thesis project given us motivation and support, which have resulted in significant improvements in the quality of our research. Lastly, thanks to our families and friends who have supported us during the thesis project.
Eskilstuna, May 2018
Contents
1. INTRODUCTION ... 1
1.1 BACKGROUND ... 1
1.2 PROBLEM FORMULATION ... 2
1.3 AIM AND RESEARCH QUESTIONS ... 2
1.4 SCOPE AND LIMITATIONS ... 3
2 RESEARCH METHOD ... 4 2.1 RESEARCH PROCESS ... 4 2.1.1 Case study ... 5 2.2 DATA COLLECTION ... 5 2.2.1 Literature review ... 6 2.2.2 Interview ... 7
2.2.3 Additional data sources ... 8
2.3 DATA ANALYSIS ... 9
2.4 VALIDITY AND RELIABILITY ... 10
3 FRAME OF REFERENCE ... 12
3.1 THE SMART FACTORY AND THE IMPORTANCE OF INFORMATION ... 12
3.2 INFORMATION AND OPERATIONAL DECISIONS ... 15
3.3 INFORMATION FOR PRODUCTION SYSTEM DEVELOPMENT ... 19
4 EMPIRICAL FINDINGS ... 22
4.1 CASE COMPANY AND CASE STUDY DESCRIPTION ... 22
4.1.1 PADME-project problem formulation: ... 22
4.2 INFORMATION FOR PRODUCTION SYSTEM DEVELOPMENT ... 23
4.3 INFORMATION AND OPERATIONAL DECISIONS ... 30
4.4 THE SMART FACTORY AND THE FUTURE OF THE CASE COMPANY ... 31
5 ANALYSIS ... 33
5.1 CHARACTERISTICS OF OPERATIONAL INFORMATION IN A SMART FACTORY ... 33
5.2 WHY INFORMATION REQUIREMENTS SUPPORTING OPERATIONAL DECISIONS ARE NECESSARY FOR A SMART FACTORY ... 36
5.3 INFORMATION CONTRIBUTING TO OPERATIONAL DECISIONS IN A SMART FACTORY ... 39
5.4 HOW INFORMATION REQUIREMENTS SUPPORT OPERATIONAL DECISIONS IN A SMART FACTORY ... 43
6 CONCLUSIONS AND RECOMMENDATIONS ... 45
7 REFERENCES ... 47
8 APPENDICES ... 54
List of Figures
Figure 1 - Thesis Scope ... 3Figure 2 - Research process ... 4
Figure 3 - Interview funnel approach based on Kylén (2004) (edited) ... 7
Figure 4 - Physical and virtual information ... 12
Figure 5 - Smart Factory information categories (Zhang & Tao, 2017) ... 14
Figure 6 - Decision pyramid (Nielsen, 2003) ... 16
Figure 7 - Operational activities steps ... 16
Figure 8 - Six phases of decision making (Wilks, 2001) ... 17
Figure 9 - Decision triggers ... 18
Figure 10 - Data and information used to identify bottleneck (Nagi, et al., 2017) ... 20
Figure 12 - PADME-project visualising CPAS as a stepping stone towards a Smart Factory .. 23
Figure 13 - Pareto chart over categorised disturbance data from excel ... 29
Figure 14 - Analysis of variance over categorised disturbance data from excel ... 29
Figure 15 - List of operational information requirements in a Smart Factory (Case company) 32 Figure 16 - Scope of the research questions ... 33
Figure 17 - Operational information requirements for a Smart Factory ... 42
Figure 18 - Operational information requirements in a Smart Factory graph (Case company) . 44
List of Tables
Table 1 - Data collection ... 6Table 2 - Alarm triggers ... 13
Table 3 - Mapping/routing excel document ... 24
Table 4 - Information requirements from RISE ... 25
Table 5 - Disturbance data from disturbance database ... 27
Table 6 - Disturbance from excel document (unsorted) ... 28
Table 7 - Categorised disturbance data from excel ... 28
List of Figures in Appendices
Appendix 1 - List of operational information requirements (Case company) ... 54Appendix 2 - List of operational information requirements (generic) ... 55
Appendix 3 - Interview questions used at the case company ... 56
Appendix 4 - Cycle times collected from AVIX videos, four products ... 57
ABBREVIATIONS
CPAS Collaborative process automation system
CT Cycle time
DT Downtime
ERP Enterprise resource planning
IoT Internet of things
IoT- MS Internet of things into manufacturing systems
KPI Key performance indicators
KPPA Key production performance analysis
MDT Mean down time
MES Manufacturing execution system
MTTF Mean time to failure
OEE Overall equipment effectiveness
PADME Process automation for discrete manufacturing excellence
PSD Production system development
RFID Radio frequency identification
RIDPS Real-time information-driven production scheduling
RISE Research institutes of Sweden
TBDT Time between downtime
1 1. INTRODUCTION
This chapter presents the background to the thesis research area, the problem formulation, the research aim among with research questions, and the scope of the thesis.
1.1 Background
Today, companies are facing increasing global competition. Market borders are deleted, and the demand and supply of products are greater than ever (Hozdić, 2015). Being an actor on the global market brings new opportunities, but it also triggers manufacturing companies to change to stay competitive and meet rapidly increasing requirements (Emmanouilidis, et al., 2012; Hozdić, 2015). Customers do not only want a product at the right price, but they also want a high-quality, customised product, delivered on time. This results in increased product diversity and increased product complexity (Lucke, et al., 2008; Riedel, et al., 2013). Consequently, manufacturing companies now must manage low inventories, fluctuating demand, and increased standardization of manufacturing processes (Kern, et al., 2012; Mejjaouli & Babiceanu, 2014). These conditions are challenging for traditional manufacturing companies. In combination with the development of modern technologies, a new era of production is on the rise – one that is built on information, communication, and digitalisation (Hozdić, 2015). This new era has received increased attention, not only from manufacturing companies, but also from governments, who have realised the importance of this matter to maintain manufacturing competitiveness. For example “Europe 2020,” (Commission, 2016) “Production 2030,” (Produktion2030, 2018) and “Made-in-China 2025” (Chinadaily, 2015). In the year 2011, German government presented a concept called “Industry 4.0,” also known as the fourth industrial revolution. Industry 4.0 is a new flexible interpretation of manufacturing, where the physical and virtual world coexist to support people and machines to perform their tasks in an optimal way (Anderl, 2015). Industry 4.0 aims to solve the issues mentioned above with the concept of a Smart Factory (Hozdić, 2015). The Smart Factory is a leap forward from traditional automation, to a connected and flexible system – one that can utilise a constant stream of data and information from production systems. Smart factories can with the help of algorithms process the data stream, share information, and learn and adapt to changing demands (Hozdić, 2015; Lee, 2015). Information is the heart of a Smart Factory, and both humans and machines will require information from the production system to make operational decisions (Anderl, 2015; Radziwon, et al., 2014). Smart factories require accurate and up to date information to function (Lee, 2015; Radziwon, et al., 2014; Yoon, et al., 2012). Several studies highlight the importance of information for production systems (Bruch, 2012; Frishammar, 2005) and the benefits of viewing information as a strategic resource (Frishammar & Ylinenpää, 2007; Zahay, et al., 2004). To run smart factories, manufacturers need to collect an increased amount of information, which, in turn, will require new approaches (Yin, et al., 2017).
A report from Teknisk Framsyn (2003) predicted that information and knowledge will be a crucial factor in future production systems. Information helps manufacturers to base operational decisions on something other than gut feelings or guesses, which makes information a highly valuable resource (Brynjolfsson, et al., 2011; Davenport, 2010). For example, the ability for a cross-functional team to identify and solve a problem links to manufacturing company’s ability to share information (Frishammar & Hörte, 2005; Turkulainen, 2008). Wilks (2001) argues that information has the potential to improve people’s ability to make higher quality decisions. Despite this, manufacturing companies struggle to manage the information they possess, to turn information into knowledge and knowledge into action (Salles, 2007). Instead of collecting various data and then attempt to find a use for it, Wang et al. (2015) propose first to consider
2 what information that is required to improve efficiency in the production. It is crucial that the collected information is valid and reliable to ensure that right operational decisions are made. Making operational decisions based on inadequate and/or outdated information leads to less efficient decision-making processes, inefficient production system development, and problems in planning and production (Lucke, et al., 2008; Zhang, et al., 2014). Besides, Zhang et al. (2014) states that accurate, and up-to-date information is the key to eliminating bottlenecks in production. Industry 4.0 aims to convert traditional manufacturing facilities into smart factories; however, it is a vision of the future. The road towards smart factories is expected to be both evolutionary and challenging (Lee, 2015).
1.2 Problem formulation
Today, manufacturing companies are facing challenges to manage information in production systems. Problems arise when operational decisions must be made, which leaves manufacturers struggling to determine what information to use, how to collect it, how to use it and when to use it (Salles, 2007). Furthermore, Bruch & Bellgran (2013) argues that there is a lack of studies focusing on information management when developing production systems. Besides, the information obtained from production shop floor is often lagging, incomplete and does not provide accurate or up to date information to allow successful operational decisions (Leng, et al., 2015). Making operational decisions on inadequate or inaccurate information leads to increased operational costs, problems in production scheduling (Leng, et al., 2015) and inefficient production system development (Lucke, et al., 2008). Manufacturing companies have made progress over the years, e.g., by integrating Enterprise Resource Planning (ERP) and Manufacturing Execution System (MES) to increase the information flow. However, these business systems are no longer adequate, and the systems seldom contain all the information necessary to support operational decisions (Skoogh, et al., 2012). More importantly, the lack of information for operational decisions limits manufacturing companies from achieving the concept of a Smart Factory, which relies on information to function (Radziwon, et al., 2014). Therefore, additional research regarding information requirements for operational decisions is needed for smart factories to go from concept to reality. To turn traditional factories into smart factories, information requirements for operational decisions in a Smart Factory needs to be characterised and concretised. This would enable smart factories to function as intended, become truly smart, and make operational decisions without human interaction. The following section presents the research questions, which aims to investigate this issue.
1.3 Aim and research questions
The purpose of this thesis is to analyse information requirements for operational decisions in smart factories.
Following research questions were used to fulfil the purpose:
RQ 1: What characterises information for operational decisions in a Smart Factory? RQ 2: Why are information requirements for operational
decisions in a Smart Factory necessary?
RQ 3: What information contributes to operational decisions in a Smart Factory? RQ 4: How can information requirements support operational decisions in a Smart
3 1.4 Scope and limitations
The core of this thesis is information requirements that facilitate operational decisions in smart factories. This thesis will present a case study together with a literature review. The case study will complement the literature review by identifying similarities and differences between the case company and the literature reviewed. The literature review will focus on information in production systems, information in smart factories, and information for operational decisions. With “information,” this thesis focusses on metrics like; cycle time (CT), disturbances, assembly station information, takt time, and other information used to reduce lead times or increase throughput in discrete manufacturing. With operational decisions, the thesis specifically studies decisions that relate to the daily operations in production. The Smart Factory concept is limited to how information is used for operational decisions, and therefore exclusively focus on decisions ultimately leading to increased throughput or reduced CTs in production. In this thesis, the term “operational information,” is used to signify the information required to carry out operational decisions. In this thesis, uncertainty is the lack of information for an operational decision. This thesis is based on a study at a manufacturing company in Sweden at a low volume high mix (LVHM) assembly line of customer ordered industry products. This thesis is a part of the research project “Process Automation for Discrete Manufacturing Excellence,” (PADME) which includes Toyota, Scania, Westermo, Level 21, SICS, MDH, and ABB Corporate Research as partners. Although, the PADME-project is active from May 2017 – May 2019, this thesis is conducted in 20 weeks. During this period, this thesis is limited to identify and collect information that could be used to reduce CTs or increase production throughput. A simulation expert from “Research Institutes of Sweden,” (RISE) provided the list of information and data to be collected on the shop-floor. Tables presented in the thesis has been edited due to sensitive information. Figure 1 shows the area to be studied, i.e., the scope of the thesis.
4
2 RESEARCH METHOD
This section begins by presentation the research process and how the thesis was carried out, followed by data collection and analysis. The chapter ends by discussing the quality of the research.
2.1 Research Process
The thesis was initiated with reading the PADME-project outline document. The document contained information regarding the project idea, aim and potential, background and state of the art, impact, implementation, project participants, roles and management and budget. The PADME-project was structured in work package areas, and the thesis researchers were included in work package 2, which contained several deliverables. When the work package had been studied, a meeting was planned between the thesis researchers’ along with a simulation expert from RISE, also working in work package two. With information from the PADME-project, different keywords were extracted to form the foundation of the thesis content. These terms were studied, altered, combined, replaced, back and forward until three keywords remained. These keywords were; “Smart Factory,” “Information,” and “Operational decisions” (See Figure 2).
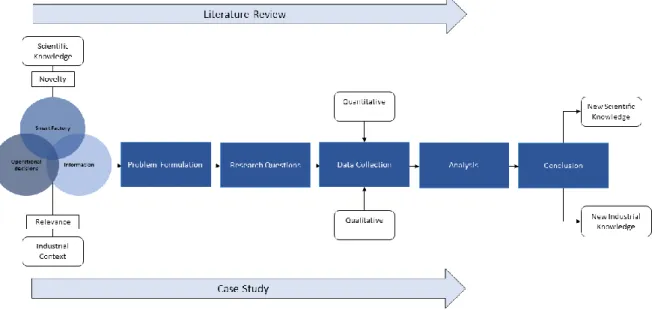
Figure 2 - Research process
The three keywords were chosen with consideration to the; project outline, PADME-project work package objective, Production2030 program, and with regards to previous research studies. To ensure novelty, scientific knowledge was provided through a literature review, and to ensure that the thesis was of relevance, the thesis was put into industrial context with the case company. When novelty and relevance were assured, the problem was formulated based on the three terms mentioned above. The research purpose and research questions were then formed out of the problem formulation. The research questions were designed to fulfil the research aim. To answer the research questions, hence the aim of the thesis, data collection was a necessity. The data collection consisted of case study and a literature review, containing both qualitative and quantitative data which was subsequently analysed to answer the research questions. A combination of the literature review and the case study provided different information parameters for a Smart Factory to function as intended and support operational decisions. That material was used to create a list of information requirements, along with a graph, created with the purpose to
5 guide the case company and other companies towards becoming a Smart Factory. Finally, the presented conclusions contributed with new industrial knowledge to the case company and with new scientific knowledge.
2.1.1 Case study
A case study method was chosen as research method since the research questions were “what?,” “why?,” and “how?”- questions (Yin, 2009). The thesis researchers wanted to study the relationship between information and operational decisions within the case company, which required close connection to the analysis object so that the thesis researchers could study the events as they occurred (Ejvegård, 2003). Saunders et al. (2012) and Patel & Davidson (2011) also presents case studies as an appropriate method when examining a smaller population and when the study regards changes or process. This thesis is based on a single case study, which opens an opportunity for in-depth observation (Voss, et al., 2002). However, the detailed scope could affect the ability to generalise. More case studies of similar nature pointing in the same direction could open the possibility for generalisations (Ejvegård, 2003).
The case company was chosen as a case company since they are the coordinators of the PADME-project, hence, have invested in becoming a Smart Factory. The case company also has a pronounced interest in information leading to right operational decisions resulting in increased throughput. The case company deals with information in the production but wants to improve this area. The case company manufactures industry products, which is closely related to automation and future production, and that was another reason for choosing the company. The thesis researchers studied how the case company are working with operational decisions leading to increased throughput, and how, and what information that goes into that process.
2.2 Data collection
Data collection was required for three primary purposes: to answer the thesis research questions, to gather inputs needed for a simulation model, and to provide insight to the thesis researchers regarding the case company. The data collection added strength to the findings as the various components of data are interlaced to support a greater understanding of the case (Baxter & Jack, 2008).
Data can be of primary or secondary nature and be collected with different techniques. The techniques should be chosen to fulfil the research aim best, hence answer the research questions (Patel & Davidson, 2011). Primary data characterises as new, original, first ever collected data (Kothari, 2004; Saunders et al., 2012). The same authors states that secondary data, is data that has previously been collected and processed by someone else. Secondary data needs to be used with caution and be critically reviewed and analysed with questions like when, and with what purpose the text was published (Kothari, 2004; Patel & Davidson, 2011). Depending on whether the data is of primary or secondary nature, the data collection methods are different (Kothari, 2004). Primary data could be collected through observations, interviews, schemes, and questionnaires. Secondary data could be collected through publications, journals, books, reports, doctoral dissertations, and statistical documents (Kothari, 2004). Both primary and secondary data has been collected in the thesis. Data from interviews, conversations, e-mails, and observations were primary data since it was new data with originality. Secondary data was collected in the form of excel sheets, videos, disturbance data history from the case company, and through a literature review. When secondary data was collected, the origin of the data was critically reviewed and compared with other sources.
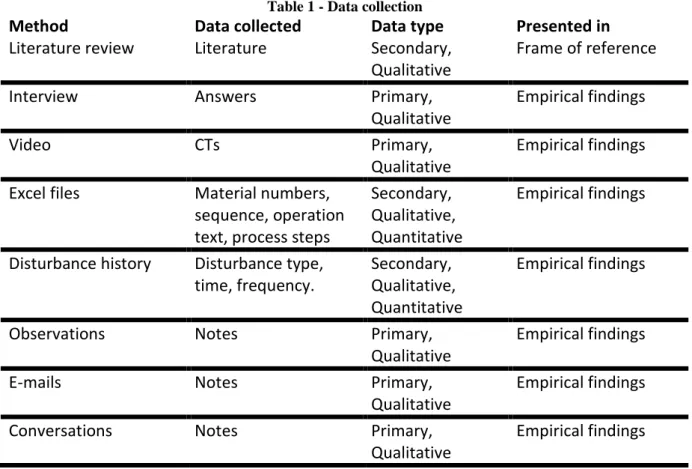
6 Patel and Davidson (2011) propose two types of methods for research studies, qualitative and quantitative. Quantitative research results concerning numbers, amounts, and occasions and is preferably used when making sense of numerical data. Qualitative research, on the other hand, is trying to describe how, what, and why things occur, based on context. This method is appropriate when the research is about interpreting and understanding behaviours that are expressed in words. In the thesis, a combination of both methods was used, however with the focus on qualitative research. Most data collected were qualitative such as interviews, videos, observations, and some data were quantitative data such as excel-sheets containing material information, sequence order, station numbers, etc. However, some data sources provided both quantitative and qualitative data. The disturbance data included both quantitative information such as stop time and staff hours and qualitative information, such as text describing the disturbance issue. The final analysis is therefore based on a combination of both methods. Table 1 summarises the data collection in the thesis, followed by a description of each method.
Table 1 - Data collection
Method Data collected Data type Presented in
Literature review Literature Secondary, Qualitative
Frame of reference
Interview Answers Primary,
Qualitative
Empirical findings
Video CTs Primary,
Qualitative
Empirical findings Excel files Material numbers,
sequence, operation text, process steps
Secondary, Qualitative, Quantitative
Empirical findings
Disturbance history Disturbance type, time, frequency.
Secondary, Qualitative, Quantitative
Empirical findings
Observations Notes Primary,
Qualitative
Empirical findings
E-mails Notes Primary,
Qualitative
Empirical findings
Conversations Notes Primary,
Qualitative
Empirical findings
2.2.1 Literature review
A literature review was carried out to gain insight into the research area, identify gaps in the literature, and to be able to strengthen findings from the empirical study. To identify and characterise information requirements for operational decisions in smart factories, a literature review was necessary. The method was used to create an understanding of what previous studies have found within the research area, and to analyse that information with the empirical findings from the case study. Kothari, (2004) states that the purpose of a literature review is to determine the connection between the research problem and the body of knowledge in the area. It should also broaden the researcher’s knowledge, improve clearness to the research problem, improve research methodology and to contextualise the findings. Since Industry 4.0 and smart factories
7 are new and developing concepts, each search was limited to articles published within the last ten years and with “full text available.” However, snowballing caused a few references older than ten years old. The literature used in the literature review were scientific publications and books from different databases and Swedish libraries. Scientific publications were peer-reviewed articles found in following databases; Discovery, DiVA, Emerald Insight, IEEE Xplore, Scopus, and the academic search engine Google Scholar. Also, several journals were approached directly. The journals used were; International Journal of Operations & Production Management, and International Journal of Production Research. The keywords used when searching for literature was; “Information requirements,” “Information,” “Real-time information,” “Real-time data,” “Smart factories,” “Smart factory,” “Operational decisions,” “Production system development,” “Industry 4.0,” “Industrie 4.0,” “CT reduction,” and “Bottleneck elimination.” The keywords were used in different combinations and phrases, with synonyms, put AND or OR between keywords and using parenthesis in the searches.
2.2.2 Interview
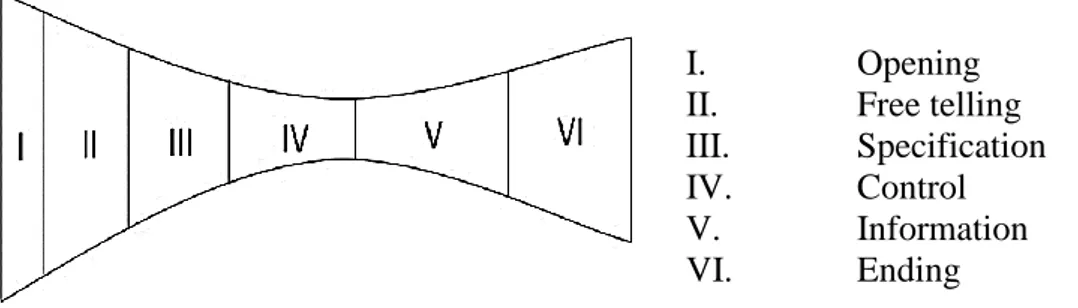
Interviews were chosen instead of surveys to ensure that a number of answers were collected and to allow the interviewers to ask follow-up questions to the interviewees (Clifford, et al., 2016; Kitchin, et al., 1999). It was also chosen to allow the interviewees to answer the questions in their own words. In a structured interview, several set questions are asked where the interviewers make sure that each question is answered. In an open interview, the interviewers seek answers to specific question areas (Kylén, 2004). A combination of these two approaches, enabled the interviewees the opportunity to speak freely where after the thesis researchers manage the conversation, so that right questions were answered correctly (Kylén, 2004). The thesis researchers together with the case company PADME representative (hereafter mentioned as case company representative) handpicked a total of six interviewees. Personnel was chosen with respect to position, knowledge, and experience, to get a broad perspective on the demarcated research area. An operator was selected as an interviewee, since the operators make some of the operational decisions. A production developer, the assembly line manager and a project leader within production development was interviewed due to their knowledge within production and production system development. To get a more holistic overview, the global production engineer, i.e., the case company representative, and the PADME-project manager (also IT manager of the company) was interviewed. The thesis used question areas related to the topic, where each area contained a set of questions for the interviewees to answer. The interview areas were; introduction, production system development (PSD), information, operational decisions, and smart factories. For the full list of interview questions, see Appendix 3. The interview was constructed using the funnel approach, shown in Figure 3. The funnel approach is one way to conduct interviews and splits up the interview into six stages (Kylén, 2004).
I. Opening
II. Free telling III. Specification IV. Control
V. Information
VI. Ending
8 In the first section called “Opening,” the thesis researchers presented themselves and gave information regarding the content of the interview and how it was arranged. The thesis researchers asked the interviewee if an audio recording was allowed and started the recording if it was possible. The aim of the introduction was also to provide comfort to the interviewee. In the next section called “Free telling,” the thesis researchers asked open questions related to the topic, which allowed the research object to answering freely. In the third part, called “Specification”, more specific questions were asked to the interviewee to get more concrete answers from the interviewee. In the next part, “Control,” the thesis researchers wanted to control the information provided from the interviewee. The thesis researchers asked for more precise answers regarding concrete events from the interviewee. In the section “Information,” the thesis researchers made a quick summarise from the interview, but also provide more information regarding what the interview answers will do for the thesis. In the final section, “Ending,” the thesis researchers thanked the interviewees for their time and asked each person if they liked the interview and if future follow-up questions were allowed. The interview consisted of a total of 20 questions, allocated to the mentioned question areas. Each interview was carried out with both thesis researchers and notes were taken during the interviews. Each interview was constructed to take about one hour to allow the interviewees to answering the questions thoroughly, and to get the chance to highlight other matters that the interviewee find of importance.
2.2.3 Additional data sources
Videos with footage of the assembly line was gathered from the case company computer network folders and then transferred to the thesis researcher’s computers. The thesis researchers collected a total of 28 videos over products being assembled in the final assembly line. The videos were captured at the beginning of 2018.
Different excel documents were collected in the thesis project. The first excel file to be collected, contained data regarding material numbers, article numbers, and sequences, which was quantitative data. The file also included operation text, which described each operation in a text, which was qualitative data. The file also presented products together with its process steps, including the final assembly line. This information was used to construct the production process flowchart, mentioned in section 2.1.2.
The disturbance database was sorted to include disturbances in the assembly area, the year 2017, and year 2018. The disturbance data was a mix of quantitative and qualitative data, where following data was quantitative; department, station ID, category 1, category 2, date, duration of disturbance. Category 1 displayed what type of disturbance that occurred (e.g., waiting on material or station) and category 2 presented where the disturbance occurred (e.g., final assembly). The qualitative data in the file was a description of each disturbance, given by operators, and operator initials. The data from 2018 was chosen to provide as updated disturbance data as possible. However, the assembly area implemented takt time in March 2018, which affected the types of disturbances recorded in the data. Therefore, disturbance data from the year 2017 was chosen to provide disturbance data over a whole year. However, the -area in the factory was significantly changed during late 2017 into the beginning of 2018. This affected the ability to withdraw meaningful information from the disturbance data. A third type of document was collected, which was disturbance data after the implementation of takt in the assembly area. This excel-document contained both quantitative and qualitative data, like the data from the disturbance database. However, one difference was that “category 1,” and “category 2,” was replaced with a department or a person responsible for addressing the disturbance. This made the
9 analysis of the data from that file more challenging since the disturbance cause was harder to identify. Further analysis of this document is described in section 2.3.
Observations were made in the case company factory in the “-area,” which is the area around, and within the final assembly line. However, the primary observation time was spent at the final assembly line. Observations were carried out to understand the flow of material, products, and information in the factory. Conversations were collected at the case company factory, by dialogs with the case company representative, line manager, and other case company staff. E-mails and telephone conversations were collected sporadically throughout the whole thesis project.
2.3 Data analysis
Analysing data is, according to Eisenhardt, (1989) the heart of theory from case studies. There are five techniques for analysis that are described by Yin (2009). These are; finding patterns, linking data to propositions, explanation building, time-series analysis, logic models, and cross-case synthesis. In the literature review, following analysis techniques were used: scientific papers were compared, patterns were identified, shared and differing opinions were highlighted (Yin, 2009). During this process, the thesis research questions were always studied as a parallel procedure to remind the thesis researchers only to include literature that was relevant to the thesis. The literature review search results were browsed by first reading each the title of each hit. If the title of the literature showed relation to the topic of the thesis, the literature was approached, and the abstract was read. The used books were selected by browsing the table of contents of each book touching the topic and by keywords identify relevant books and chapters. If the abstract showed relation to the desired topic, the whole paper was downloaded and saved to the reference management software “Mendeley.” In the software, following categories were created: Information requirements, Input data, Operational decisions, Production system development, and Smart Factory. Scientific papers were sorted into these categories. The papers in each category were read, and the relevant information was highlighted. The optimal paper would include all keywords; smart factories, operational decisions, and information requirements. However, few papers were found that covered all the topics.
The information from the interviews carried out at the case company was first transcribed by listening to the recordings. When the transcription was complete for all interviews, relevant keywords where highlighted in the text, along with similarities and differences in the different answers were stated. The interview answers were used throughout the empirical findings to form a picture of how operational decisions and information is currently handled at the case company. When the interviews were conducted, they were all analysed and compared to the information found in the literature. When all information was collected through interviews, observations, videos, disturbance data history, conversations, videos, and factory visits, it was analysed together with the information collected from the literature review to highlight differences and similarities.
During data collection, several observations in the factory were carried out, and notes were taken during these visits. Notes included information regarding the flow of material, information, and disturbances. These notes were used to develop an understanding of the case company and how they are dealing with operational decisions and information, but also to get insight into the case company’s future production. The notes were integrated with the rest of the empirical findings. In each excel sheet provided by the case company, the thesis researchers highlighted the relevant information and data and removed the unnecessary information and data. This allowed the thesis
10 researchers to focus on the necessary information and data. Each excel documents was clarified by the case company representative or the case company assembly line manager, to avoid any misinterpreting of the files. When studying the disturbance data from the disturbance data history, the goal was to categorise the disturbance type and relate that to the frequency and duration of the disturbance. This required “clean and structured data,” to be able to connect a disturbance type to duration and from there put a cost on the disturbance. Since the -area had undergone developments since 2017, the data from 2017 was irrelevant to use since the disturbances have changed since then. The stored disturbance data in the disturbance database from 2018 was also tricky to use, since the assembly area implemented takt in March 2018, which also led to other disturbances. Another source of disturbance data was collected in the form of an excel file. The excel file was provided to the thesis researchers from the line manager, which contained disturbance from after takt was implemented to the assembly area. The excel file was first analysed by viewing the headings of each column and deleting irrelevant content. The objective was to categorise the disturbances, which required analysis to find out what type of disturbances that was registered. The thesis researchers browsed through the 249-registered disturbance and looked for frequently used terms. Afterward, the thesis researchers used the filter function in excel, and searched for following terms (originally in Swedish); “Wait”, “Missing,” Training,” “Sequence,” “Balance,” “Oil,” “Wrong,” “Leakage,” “Foundry.” From those terms, following categories were created; “Misconfigured,” Sequencing / Balancing,” Staff training,” “Missing resource,” “Oil,” “Leakage,” and “Other.” 210 of the 249 registered disturbances was categorised, with the remainders put in the category “Other.”
In the video data collection, each video represented one product in one assembly station. Four products were selected that went through seven assembly stations. The thesis researchers studied each footage and estimated CTs for each workstation and product. Some videos contained interference, in the form of operators searching for material or tools. Disturbance times were removed from the total CT for each product. From the videos, CTs, inter-arrival times, and transport times between stations were extracted. The thesis researchers created a separate excel document with all the CTs for each workstation and product, together with the inter-arrival times, transport times and the total lead time for the assembly line. The excel file along with the flowchart was sent to the simulation expert so that the process of creating a simulation model could begin. Each video was analysed two times, to ensure that the CTs were correctly calculated. 2.4 Validity and reliability
Validity relates to the researcher’s ability to study and measure what is set out to be studied and measured. To avoid misunderstandings, and delineate the scope of the work, all keywords covered in the thesis has been defined. According to Ejvegård (2003), this is a method that facilitates clear measures and methods. The thesis researchers had continuous meetings with a simulation expert from RISE regarding discussions about the collected data at the case company and its reliability and accuracy. The thesis researchers also had regular meetings with an academic supervisor to review the gathered data and to improve research quality. The thesis researchers used four tests to strengthen research quality, based on Yin (2009): construct validity, internal validity, external validity, and reliability. Due to the nature of the research questions, the thesis researchers focused on the first and the third and fourth tests, construct validity, external validity, and reliability. The first test, construct validity was carried out during the data collection phase and through multiple sources of evidence which ensured data quality. The thesis used following sources of evidence:
11 • Numerous factory observations
• Disturbance data
• Conversations with case company employees and simulation expert
The second phase, called internal validity, refers to data analysis and highlight patterns between multiple sources of the collected data (Mathison, 1998). By comparing interview answers from the case company personnel, similarities and differences could be highlighted. Theoretical findings were compared to each other to highlight shared or opposing statements and opinions. The third phase, called external validity, compares the patterns in the empirically collected data with related theoretical findings. Flick (2011) states that external validity is achieved when the outcome can be generalised so that it can be used by other people or in different situations. This was done by comparing all empirical findings to the frame of reference, with the aim of answer the research questions. The research questions were generally formulated, and information gathered from the literature review applies to a different situation. Therefore, this study does not only apply to the case company; it includes an overall study of the project objectives which can be used in many different situations. However, the result is based on one case study, hence does not fully meet up to the requirements of generalising the findings (Eisenhardt, 1989).
The fourth test relates to reliability, which is the authenticity and usability of measurement and study (Ejvegård, 2003) and is referring to repeating steps in the empirical process and in detail document the process to add transparency (Yin, 2009). All steps taken during the project was covered and documented in the thesis to add research transparency and create an understanding of what and how events were performed. The literature used in the thesis was presented in a reference list, and the interview questions were shown in Appendix 3. The simulation expert and the thesis researchers had continuous discussions on the data and information used in the thesis. The case company representative was consistently updated on the thesis process and its content. This thesis was presented to the case company, which allowed for comments and questions.
12 3 FRAME OF REFERENCE
The outcome of the literature review is presented in this section. The first section introduces the importance of information in a Smart Factory. Thereafter, operational decisions and information are presented, followed by information used for production system development.
3.1 The Smart Factory and the importance of information
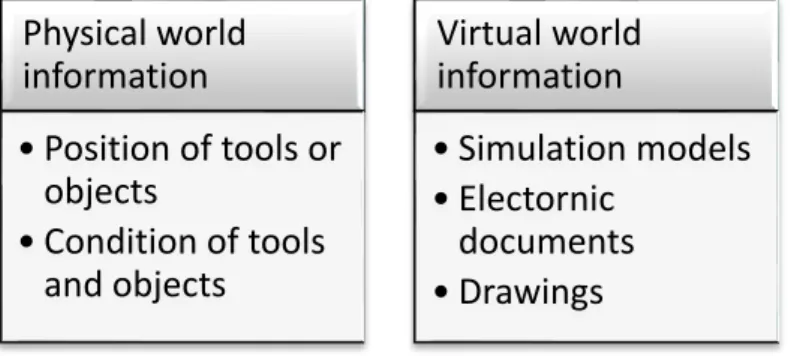
Information in a Smart Factory will be collected from the physical and the virtual world. In the physical world, information could be positions or conditions of tools or objects such as temperature, strain, pressure, and vibration. In the virtual world, information could be drawings, simulation models in form of digital twins, or other electronic documents (see Figure 4) (Anderl, 2015; Lee, et al., 2014; Lucke, et al., 2008).
Simulation models will assume an increasing role in a Smart Factory for operational decisions regarding ramp up phases and production statuses (Weyer, et al., 2016). A Smart Factory will allow real-time optimisation, real-time monitoring, real-time key production performance analysis (KPPA), and real-time information-driven production scheduling (RIDPS). Real-time monitoring enables traceability and visibility in production and plays a critical role in shop-floor performance improvements. Real-time KPPA uses preventive information to identify disturbances and provide managers with real-time production status, to enable optimal operational decisions to eliminate disturbances. RIDPS aims to enable real-time production scheduling by creating the production schedule as a continuous process as the production runs (Zhang & Tao, 2017). To capture and manage that information, a Smart Factory integrates Internet of Things (IoT) into manufacturing systems (MS). IoT in MS (IoT-MS) further uses radio frequency identification (RFID), different sensors (e.g., temperature and force- sensors), digital callipers, and integrates these technologies into the MS (Zhang & Tao, 2017).
Different parameters will be used to enable real-time optimisation and monitoring in the production, such as environmental (e.g., humidity, pressure, temperature, etc.), movement (e.g., velocity, acceleration, and shock), and real-time information regarding the status of the production. These three parameters will provide managers and supervisors with information which will set the foundation for right operational decisions (Chien, et al., 2017; Gonçalves, et al., 2014; Lucke, et al., 2008). Real-time information is: information flowing in real-time, deriving from integrated processes in the production (Hozdić, 2015). A closely related term is “real-time data,” which Shariatzadeh et al., (2016) refers to as data read directly from a sensor. It is important to use real-time information as it is presented, for instance, as a new temperature comes, the old temperature is no longer valid.
Physical world information • Position of tools or objects • Condition of tools and objects Virtual world information • Simulation models • Electornic documents • Drawings
13 Staff should be notified when parameter shows critical values (Shariatzadeh, et al., 2016). The same author presents a list of events that should trigger such alarms (see Table 2).
Table 2 - Alarm triggers Alarm triggers Task overdue
Pending tasks for a long time Task/process out of budget
Supplier out (cannot deliver anymore) New high priority message
Alerts from smart sensors High temperature
High disturbance
Transportation time too long Location incorrect
Transport stopped for 48 h
Real-time information is required to increase the production efficiency. However, in traditional production shop floors, information collected is often manually collected, lagging, and inaccurate. This leads to difficulties identifying abnormal events in production in a timely matter. When the abnormal event has occurred, its effects have already spread through the production system, causing disturbances (Zhang & Tao, 2017). In smart factories, machines can with the help of information, make their own decisions without human interaction; however, more complicated decisions will require human interaction (Wang, et al., 2015). Machines will be able to make more codifiable, and tedious tasks while humans deal with more superior functions, for instance, when dealing with empathy (Dory & Waldbuesser, 2015). Davenport & Kirby (2015) highlights the importance of convincing managers to recognise machines as partners when solving problems.
With digital systems and decision support systems, meaningful information will be presented visually on dashboards to help managers to make operational decisions (Chien, et al., 2017; Shamsuzzoha, et al., 2017). Operational decisions could be used for quality control of products, production scheduling and equipment service in a Smart Factory (Chen, et al., 2017). All information including staff information, operational information, instruction information will be presented visually and digitally in a Smart Factory (Yingfeng & Pingyu, 2008). A Smart Factory will submit information with accurate operation time in the production by calculating the difference between start and finish time of each operation. That information will significantly influence the delivery time of products (Zhong, et al., 2012). Furthermore, every item in the Smart Factory will have a number and a planned production time linked to the object itself. In the production process, information regarding each item’s current process number and position will be displayed, and quality-related data will be collected from machines. The real-time data of operators, material, trolley, item WIP will also be available in a Smart Factory (Kuhlang, et al., 2011). The quality of workpieces and machines will be presented to management, by utilising digital callipers (Khoo, 2010; Zhang & Tao, 2017; Zhang, et al., 2010). For minor components, information about its consumption will be presented. This information is crucial for refilling of material, to reduce the risk of material shortage. Operators can record additional data, such as
14 machine breakdowns (Zhong, et al., 2012). In assembly lines, material from sub-assemblies will be registered to find out missing or misassembled sub-parts. Automated guided vehicles can also communicate with machines (Wang, et al., 2017). The Processing time of each operation and CT of each machine is necessary to improve efficiency. This helps with bottleneck identification and unbalancing issues of processes. Furthermore, real-time data collection from shop-floors will result in information facilitating the elimination of bottlenecks in production (Wang, et al., 2015; Zhang & Tao, 2017).
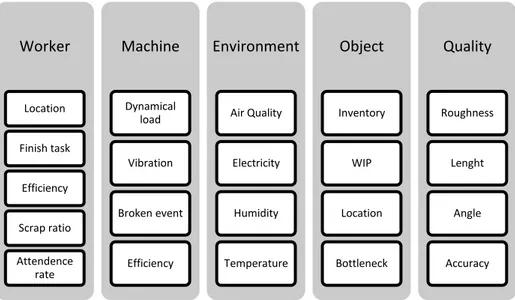
In smart factories, real-time information will be processed, shared, and exchanged throughout the production system. Multiple sensors with different formats will be used to capture this information. This information will then require further processing to transform the information in a standardised scheme to make it available to the whole Smart Factory (Anaya, et al., 2010). However, the first step in sensor implementation is setting information requirements of the manufacturing system. Then sensor types should be selected according to the information requirements (Zhang & Tao, 2017). The same authors present five different categories of information that managers are interested in, in a Smart Factory (see Figure 5). Information related to machine, environment, worker, object, and quality.
Another area that the Smart Factory will affect is maintenance. Maintenance in a Smart Factory will be “active maintenance,” and be based on big data to provide necessary proactive maintenance service. Big data refers to large amounts of data that companies collect and store. The data could be regarding its operations, customers, sales, etc. (Wang, et al., 2017). The benefits of active maintenance are following; reduced machine downtime, optimised resource utilization, increased production throughput, and reduced maintenance costs (Chen, et al., 2017). Wan et al. (2017) implemented active preventive maintenance using big data. The implementation consisted of; collecting the right data through wi-fi, analyse that data offline to increase analysis speed, and display analysis results on a screen for the manager in charge. For active preventive maintenance, all required data needs to be collected. This data includes alarms, device logs, and device statuses.
A Smart Factory should also be able to connect to the company’s customers. Information about capacity, planning data and production costs should be shared between partners (Dory & Waldbuesser, 2015). Information from different business and information systems needs to be merged for a Smart Factory to function (Li, 2016).
Worker Location Finish task Efficiency Scrap ratio Attendence rate Machine Dynamical load Vibration Broken event Efficiency Environment Air Quality Electricity Humidity Temperature Object Inventory WIP Location Bottleneck Quality Roughness Lenght Angle Accuracy
15 Several case studies have been carried out in attempt to create smart factories. Visualising and tracking real-time WIP throughout production plants have shown significant impact on daily operations, production planning, inventory levels and operators. The real-time WIP information includes; visibility, traceability, material delivery, consumption, resource statuses, machine utilisation, WIP inventory level (buffers), all within the production site. Information for critical components was operator ID, and machine ID recorded together with a start and finish time stamp. An operator will be detected by the RFID reader installed at each workstation in the Smart Factory (Yingfeng & Pingyu, 2008). Operators will be able to record defects and machine breakdowns. All this information was possible to collect with RFID-technology (Zhong, et al., 2012).
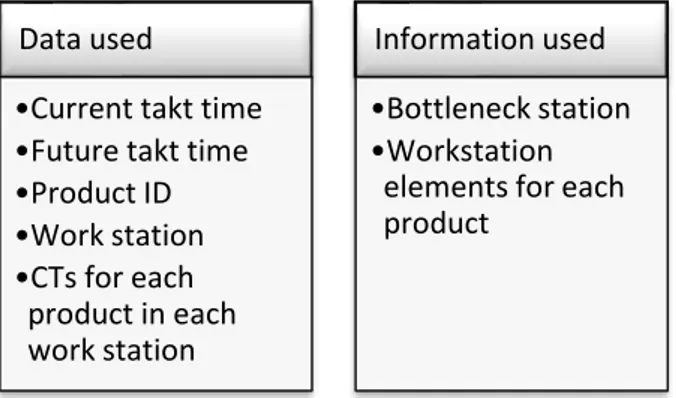
In a study made by Chien et al. (2017), the thesis researchers implemented a daily planning and scheduling system, as a stepping stone towards becoming a Smart Factory. This system included; a daily release plan (daily input), WIP status in each machine in the production, and data from MES. The data from MES included following information; takt time for each product, transport times, and the manufacturing process of each product. This information was updated daily. Some of this information was graphically presented to help managers to understand situations quickly, and managers were able to make operational decisions with the help of the system.
Gröger et al. (2016) presents a study with a focus on digital dashboards, containing information about the products being produced, process steps a worker needs to execute, and an overview of the whole production process with all its steps, showing current disturbances. Furthermore, work instructions were shown text, pictures, and videos to enable a fast introduction to new staff. The staff would also add their suggestions for improvements in this category, with memos, photos, audio recordings or videos.
3.2 Information and Operational Decisions
Information is a fundamental part that underlies the foundation of operational decisions (Frishammar, 2003). Therefore, it is of interest to study what type of information that can facilitate operational decision making. To understand what kind of information that is required to carry out an operational decision, each term needs to be clarified.
There is a substantial difference between information and data, yet the terms are mistakenly used interchangeably. Galliers (1987) defined information as following:
“Collection of data, which, when presented in a particular manner and at an appropriate time, improves the knowledge of the person receiving it in such a way that he/she is better able to undertake a particular activity or make a particular decision” (Galliers, 1987, p. 4)
Davenport & Prusak (1998, p. 3) gives another definition of information:
“Information is meant to change the way the receiver perceives something, to have an impact on his/ her judgement and behaviour and it is an improvised form of data with relevance and purpose”
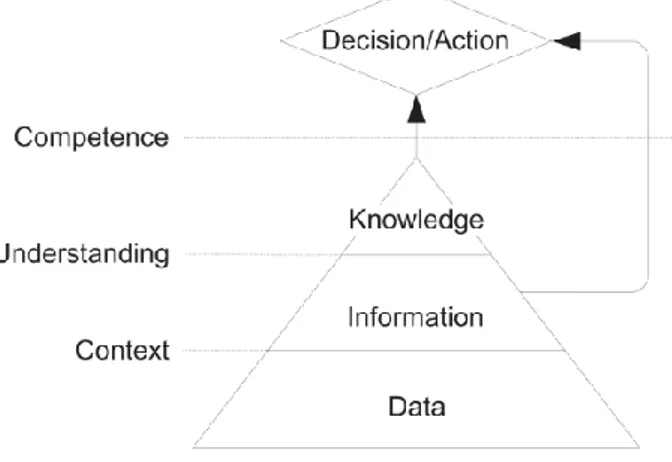
Kent (1978) and Schenck & Wilson (1994) uses a similar interpretation of the term but also add that information is knowledge of ideas, facts and/ or processes. Nielsen (2003) however, means that knowledge is something broader, more profound, and richer than information.
16 Data, on the other hand, is defined as signs or symbols that, based on the rules of interpretation, can represent information (Kjellberg, 1982; Schenck & Wilson, 1994) They also agree on that the data itself has little or no meaning.
This thesis will use Galliers (1987) definition of information since it relates to the information that the thesis researchers are studying. Galliers (1987) states “in a particular manner”, “at an appropriate time,” and that it improves the decision-makers ability to decide. These statements are related to the way a Smart Factory aims to present information.
It is important to mention the quality of information. Too much information could result in an inefficient receiver since the receiver first must distinguish which information is relevant and not (Butcher, 1998). It is also crucial that the sender and the user use the same interpretation of information, to avoid misunderstandings (Kent, 1978; Schenck & Wilson, 1994). Figure 6 presents how the above terms all are connected to each other (Nielsen, 2003).
Information plays a critical role when making decisions since its ability to influence the decision maker and, in turn, also affect personnel, structure, and processes in an organisation (Ross, 1996; Frishammar, 2003; Mätäsniemi, 2008). Operational decisions are short-term decisions with a focus on daily activities. In production, these types of decisions are usually carried out to improve the products flow through the production (Ganeshan & Harrison, 2002). It is important to clarify that not making decision, is a decision itself (Mätäsniemi, 2008). Mätäsniemi, (2008) presents eight steps that represent operational activities in Figure 7.
Figure 7 - Operational activities steps
Be aware of the need for taking an action Understand the present state of operations Be conscious of potential actions Understand the extent of each action Be able to evaluate consequences with respect to operational objectives and constraints Be able to choose the best action based on the knowledges above Implement the action Manage the implementatio n and detect future needs for actions
17 Wilks (2001) presents a decision-making process in six phases (see Figure 8). The first phase is when the need for a decision is recognised. In this phase, right information is crucial, since the decision maker otherwise might miss the problem or solve the wrong problem. The second phase is when the objective is identified and defined. Search for reasonable alternatives is the third phase, it implies the importance of generating several options to increase the chance of making the right decision. Information plays a vital role in this phase since it supports the generation of relevant alternatives.
Figure 8 - Six phases of decision making (Wilks, 2001)
Too much information could have a negative impact on the search for reasonable results since it confuses the decision-maker, leading to non-optimal alternatives. When the alternatives have been presented, it must be evaluated. If data appears as irrelevant, there is an imminent risk that it will be overlooked. When each alternative has been evaluated, the best alternative must be selected. All information presented has an impact on the final selection, it is therefore critical that the information provided, live up to the attributes of meaningful information, that is, accurate, verified, complete, up-to-date, and relevant to avoid making wrong decisions. Further, when the selected alternative is to be implemented, data must be shared with appropriate people. A decision will have little or no value if the people involved are unable to fulfil the improvement. By considering the above attributes and the six phases presented above, improvements in quality information and decision-making (Wilks, 2001).
Sometimes decision making is rational; this means that the decision maker can rank each decision from best to the worst alternative. However, in most cases, human decision making has shown to be the opposite, especially when the alternatives involve multiple objectives or if there is any uncertainty linked with the alternative (Mätäsniemi, 2008).
Duncan (1972), Kaye (1995) and Frishammar, (2003) defined the purpose of information as a tool used to remove or reduce uncertainty. Frishammar, (2003) claims that uncertainty could be defined as the difference between processed information and required information:
(I) 𝑈𝑛𝑐𝑒𝑟𝑡𝑎𝑖𝑛𝑡𝑦 = 𝐼𝑛𝑓𝑜𝑟𝑚𝑎𝑡𝑖𝑜𝑛 𝑟𝑒𝑞𝑢𝑖𝑟𝑒𝑑 − 𝐼𝑛𝑓𝑜𝑟𝑚𝑎𝑡𝑖𝑜𝑛 𝑝𝑟𝑜𝑐𝑒𝑠𝑠𝑒𝑑
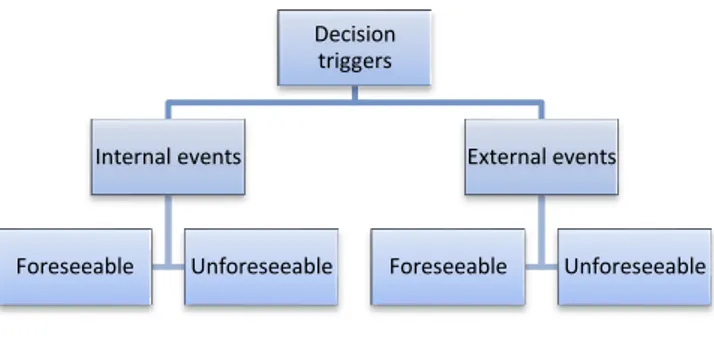
Information required relates to the necessary information to make a successful decision and information processed is the used information when a decision is made (Frishammar, 2003). Equivocality is a term that is often mentioned together with uncertainty, which refers to the allowance of several different meanings of a word or a phrase. Increased project complexity typically brings increased uncertainty and equivocality. Companies need to refine their development processes to enhance integration and knowledge sharing (Koufteros, et al., 2005). To be able to understand what information that facilitates decision making it is of importance to look at operational decision triggers. One trigger mentioned by Mätäsniemi (2008) is new available information. New available information should always be taken into consideration when making decisions since it might reduce the uncertainty of a prediction. Mätäsniemi (2008) presents two main categories of triggers, internal and external events. Each category further contains foreseeable and unforeseeable events (see Figure 9). Production scheduling planned availability of raw materials and changes in utility are examples of foreseeable events.
Recognition of the need for a decision Identification of objectives Search for reasonable alternatives Evaluation of alternatives Selection of the
18 Operational decisions regarding such events should be decided in advance so that proper arrangements can be made before the event occurs. These decisions are relatively easy to cope with since the trigger already has been identified. Events such as changes in customer deliveries or unforeseen changes in utility cost are more challenging to deal with. These events are examples of the unforeseeable external events. Foreseeable internal events are events such as maintenance and changed batch sizes. Since they are internal, they often arise when other operational decisions are made. Unforeseeable internal events are on the other hand events such as equipment failure or defect issues. These events are difficult to predict in advance and often results in prohibitive costs. In these situations, it is more important to find a way to get a warning in advance than it is to detect the event when it happens. The lack of connectivity on shop floors results in delayed or unavailable information, which enhances the difficulty of decision making. However, information and information collection are under transformation and has grown exponentially during the last decades. Nowadays, it is not only of interest to collect information, but companies are also interested in how to collect and measure processes and products (Mätäsniemi, 2008).
When influencing decision-makers with information, it is of importance to consider the attributes that give the data in the information its meaning, since organisations only are capable of handling fractions of the information presented. The information provided to decision-makers are then filtered throughout the decision process by using several methods. In this process there is a chance that relevant information will be overlooked, resulting in decision-makers basing their decisions on inaccurate information or solving the wrong problem (Wilks, 2001; Sawyerr, et al. 2000). Long (1989) and Wilks (2001) describes meaningful data as; accurate, verifiable, complete, and relevant. Wilks (2001) also stresses the substantial difference between collecting data and providing meaningful information since its often overlooked in companies, resulting in less efficient decisions and improvements. This is strengthened by Sawyerr et al. (2000) who found a positive relationship between relevant information, accessibility, and frequency of usage. Therefore, it is of importance to consider both the decision process and the characteristics that turn data into meaningful information.
Factories experience changes, for example from a machine breakdown or an order fluctuation in the market. These deviations are hard to consider, which results in incorrect decisions being made (Westkämper, et al., 2005). However, it is getting more common that companies use probabilistic information to get a sense of when these events might occur. An issue with this is to decide whether that information is strong enough to trigger a decision or if additional information is needed. Often it is less costly to take actions in vain than not acting and let the event occur. Therefore, decisions about counteractions should be made with rather uncertain information (Mätäsniemi, 2008).
Figure 9 - Decision triggers
Decision triggers Internal events Foreseeable Unforeseeable External events Foreseeable Unforeseeable
19 Currently, most operational decisions in manufacturing companies are based on the experience of managers. Current production systems are facing issues in knowing how to analyse and contextualise the collected data to help decision-makers make better decisions (Lee, et al., 2013). The problem lies not in collecting the data itself, but in the data analysis and without the analysis, the data cannot provide meaningful information, which provides a scientific basis for decision-making (Chen, et al., 2017).
3.3 Information for production system development
Information should be viewed as a strategic resource when developing production systems (Bellgran & Säfsten, 2009). According to Kehoe et al. (1992), information is the most important asset a manufacturing company can have. Viewing information as a resource can increase the understanding of information in the PSD-process (Frishammar, 2005; Mata et al., 1995; Zahay et al., 2004). One of the most critical challenges manufacturing companies experience is the ability to introduce new products, manufacture them, and deliver them on time. This challenge relates to identifying required information and data for optimal operational effectiveness, and calculate correct time estimates for production of products (Jung, et al., 2017).
Today, companies use ERP and MES, which enables control of processes both inside and outside factories. However, these systems are no longer enough to handle the complex manufacturing sequences that are necessary to meet today’s market (Zhong, et al., 2012; Lucke, et al., 2008). Even with substantial investments in business systems, like ERP, the shop-floor production process handling in ERP is insufficient (Leng, et al., 2015). The information in ERP and MES are often lagging and incomplete, which directly result in problems within planning and production. This also leads to decision-makers making decisions based on something other than information (Kielstra, 2007). Information is necessary to ensure a constant resource load to the production. This information typically comes from ERP, MES, and other subsystems, where MES usually plans and controls the manufacturing level, and ERP controls the synchronisation of planning entities. A malfunction in any of these systems may trigger a difference between the real and the digital saved data, which leads to planning difficulties and a non-optimal production workload (Zhong, et al., 2012; Lucke, et al., 2008). Some machines can record process information as well, which is referred to as isolated information. However, this information is seldom used by anyone (Wang, et al., 2015). ERP needs real-time and accurate shop-floor information and data to generate right operational decisions (Jung, et al., 2017).
When it comes to operational decisions leading to increased throughput or decreased CTs in production, bottleneck elimination is one commonly used approach. A bottleneck in a production system is the process with the longest average active processing time. It is the process which interrupts other processes and dictates the overall system throughput (Roser, et al., 2001). In a case study, the aim was to apply bottleneck analysis together with discrete event simulation. The simulation model used following inputs:
• Disturbance data, such as mean time to failure (MTTF), and mean downtime (MDT) • CTs for each workstation
The simulation model used in the study provided fast identification of primary bottleneck with reasonable accuracy (Faget, et al., 2006).