M¨
alardalen University
School of Innovation, Design and Engineering
V¨
aster˚
as, Sweden
Thesis for the Degree of Bachelor of Science in Computer Science
15.0 credits
EFFICIENT FBD TEST GENERATION
THROUGH PROGRAM SLICING
Christian Hurtig
chg13006@student.mdh.se
Examiner: Adnan Causevic
M¨
alardalen University, V¨
aster˚
as, Sweden
Supervisor: Eduard Paul Enoiu
M¨
alardalen University, V¨
aster˚
as, Sweden
M¨alardalen University Bachelor Thesis
Abstract
Program slicing has been used as a way to improve the efficiency of debugging and program analysis. Nowadays, automated test generation is being used to create tests automatically by analysing the program structure and suggesting necessary tests. This kind of techniques are prone to efficiency problems when applied to large programs containing many lines of code. This is especially true for software in industrial practice, such as the ones running on Programmable logic controllers (PLC) that are used in a wide variety of tasks from toys to avionics and rail transport. Function Block Diagram (FBD) is a language used for programming PLCs that has gained lots of attention in industrial practice due to its graphical nature. These FBD programs are often used in real time and safety critical systems, and these systems require extensive testing in order to prove that they pass safety requirements of their respective domains.
In order to improve the efficiency of applying automated test generation on FBD programs we propose two FBD program slicing algorithms based on the structure of these diagrams and how they are programmed. These FBD program slicing algorithms are applied on several industrial programs for PLCs in order to evaluate their feasibility and what effect slicing has on test generation. Six FBD programs were selected out of 189 provided by Bombardier Transportation Sweden AB. The six programs were sliced according to these FBD slicing algorithms and then evaluated in terms of efficiency and applicability.
Our results suggest that slicing can be used to reduce the needed generation time and memory usage required for automated test generation. However, our observations show that slicing can also increase the number of test cases generated and how this test cases are merged into one test suite for the entire program.
Table of Contents
1 Introduction 6 1.1 Problem formulation . . . 6 1.2 Research method . . . 7 1.3 Contribution . . . 7 1.4 Overview . . . 7 2 Background 9 2.1 PLC Software . . . 92.2 Automated Test Generation . . . 10
2.3 Program slicing . . . 10
3 Related work 13 4 Method for slicing FBD programs 14 4.1 Slicing algorithms . . . 14
5 Design 17 5.1 Overview and evaluation . . . 17
5.2 Selecting programs . . . 18
5.3 Slicing of FBD programs . . . 18
5.4 Test case generation using CompleteTest . . . 19
6 Results 20 6.1 Slice evaluation . . . 20 7 Discussion 23 8 Conclusion 24 8.1 Future work . . . 24 Bibliography 25 Appendix A Figures 27 Appendix B Tables 63
List of Tables
2.1 Computation of the relevant set. . . 11 5.1 Program categories based on information provided by three industrial engineers:
small, medium and large programs [1]. . . 18 6.1 Number of slices created by the slicing algorithms . . . 20 6.2 Data collected required by each slice algorithm compared to original program. . . . 21 6.3 Average results per program by algorithm . . . 21 6.4 Test cases of output slice 1 and 2 of program 1 . . . 22 B.1 Test case generation . . . 63
List of Figures
1.1 Research method . . . 7
2.1 FBD program . . . 9
2.2 PLC . . . 10
5.1 Methodology . . . 17
5.2 MITRAC CC SAFE TOOL IDE . . . 19
5.3 CompleteTest test cases . . . 19
A.1 Program 1 . . . 28
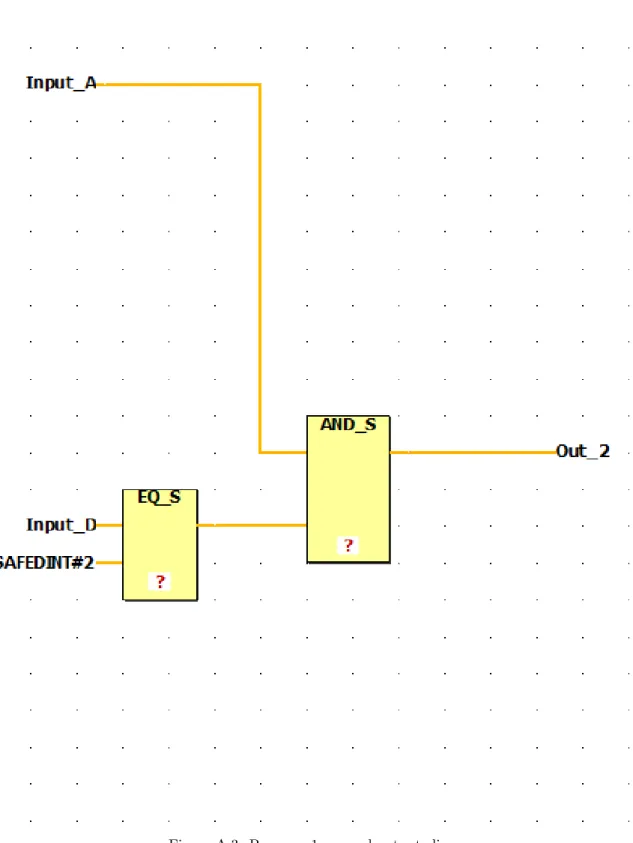
A.2 Program 1: first output slice . . . 29
A.3 Program 1: second output slice . . . 30
A.4 Program 1: third output slice . . . 31
A.5 Program 2 . . . 32
A.6 Program 2: first output slice . . . 33
A.7 Program 2: second output slice . . . 34
A.8 Program 2: first newline slice . . . 35
A.9 Program 2: second newline slice . . . 36
A.10 Program 2: third newline slice . . . 37
A.11 Program 3 . . . 38
A.12 Program 3: first output slice . . . 38
A.13 Program 3: second output slice . . . 39
A.14 Program 4 . . . 40
A.15 Program 4: first output slice . . . 41
A.16 Program 4: second output slice . . . 42
A.17 Program 4: third output slice . . . 43
A.18 Program 4: forth output slice . . . 44
A.19 Program 4: fifth output slice . . . 45
A.20 Program 4: first newline slice . . . 46
A.21 Program 4: second newline slice . . . 47
A.22 Program 4: third newline slice . . . 48
A.23 Program 4: forth newline slice . . . 49
A.24 Program 4: fifth newline slice . . . 50
A.25 Program 5 . . . 51
A.26 Program 5: first newline slice . . . 52
A.27 Program 5: second newline slice . . . 53
A.28 Program 6 . . . 54
A.29 Program 6: first output slice . . . 55
A.30 Program 6: second output slice . . . 56
A.31 Program 6: third output slice . . . 57
A.32 Program 6: first newline slice . . . 58
A.33 Program 6: second newline slice . . . 59
A.34 Program 6: third newline slice . . . 60
M¨alardalen University Bachelor Thesis
Chapter 1
Introduction
Software testing [2] is a large and resource intensive activity in the overall software engineering process. Historically, the process of identifying and correcting defects during the software develop-ment process is estimated to be over half of the whole developdevelop-ment costs [3]. Usually, the longer a defect remains undetected, the more it will cost to find and fix it. This is one of the reasons why improving the testing process has been investigated in research as way to gain better software quality. An efficient and accurate way of automating the testing process has being increasingly important, especially for safety-critical systems like railway and aviation domains.
Program slicing [4] is a decomposition technique used to simplify programs by focusing on a subset of its instructions while maintaining the functionality of the point in the program that is of interest. It has been used in a wide variety of areas of software engineering such as debugging, parallelization, testing and software maintenance in order to reduce errors and improve understanding.
1.1
Problem formulation
Automated test generation [5] has been proposed with some promising results as a way to reduce the effort of creating tests during software development. CompleteTest is a tool that automatically generates test cases based on FBD programs, used in safety-critical applications for industrial control software. This tool supports several coverage criteria including branch coverage. Like any other search-based algorithms, test case generation can be significantly slower in terms of generation time for industrially-sized programs. In some of the cases, test generation suffers from the well know problem of state space explosion. Since slicing [4] has been used in many areas to improve the efficiency of program analysis, our goal in this paper is to investigate the effects of slicing on FBD programs and how to improve test cases generation in terms of efficiency. To apply this on realistic programs we use CompleteTest for test generation of industrial FBD programs.
In this thesis we investigate the following research questions:
• Can FBD program slicing improve the efficiency in terms of generation time and memory required by automated test generation?
• Does the FBD program structure limits program slicing applicability and the way in which the diagrams can be sliced?
In order to answer these questions, we propose propose two FBD program slicing algorithms. We based these algorithms on previous research done on general-purpose program slicing and the investigation of six FBD programs provided by Bombardier Transportation Sweden AB. The slicing algorithms are evaluated by analysing and comparing test case generation efficiency for both the non-sliced and the sliced programs.
M¨alardalen University Bachelor Thesis
1.2
Research method
The implementation and validation will be achieved through a case study with the purpose of improving the performance of model-based test case generations for PLCs. According to Runeson et. al. [6] a case study in software engineering is an empirical research method that aims of investigating a software engineering method or a phenomenon in a real-life context using multiple sources of evidence. In this thesis we examine multiple industrial programs from a company and a tool for test generation. This is an exploratory study investigating how to improve test case generation by program slicing using a quantitative data collection for evaluation.
Figure 1.1: Research process
Development of our slicing algorithm will follow the research process described by Marinescu [7], shown in figure1.1. To address the problem formulation in section1.1we begin a literature review to study state-of-the-art in program slicing and how this can be applied to FBD programs. Based on the literature study we propose a slicing method and implement it by formalizing the steps of the proposed algorithm. Lastly, we validate the proposed algorithm by applying it to PLC programs used in industry in the form of a case study and compare the slices to the naive solution.
1.3
Contribution
This thesis provide the following contributions • Two slicing algorithms for FBD programs.
• The evaluation of the slices produced by the proposed slicing algorithms when applied to industrial programs for PLCs.
The proposed slicing algorithms are based on a graph model similar to the diagrams described by FBD graphical language and will likely also be applicable to PLC programs used by other manufacturers and developers if these programs can be translated into the same graph model, though testing this is outside of the scope of this thesis.
1.4
Overview
Chapter 2 provides an overview of PLC software, automated test generation and program slicing. Chapter 3 presents some related work on program slicing. Chapter 4 describes our method for slicing FBD programs. Chapter 5 details how the results were obtained and evaluated. In Chapter
M¨alardalen University Bachelor Thesis
6 we present our results. Chapter 7 shows a discussion of the results of this thesis. Chapter 8 presents our conclusions and we suggest some future work.
Chapter 2
Background
2.1
PLC Software
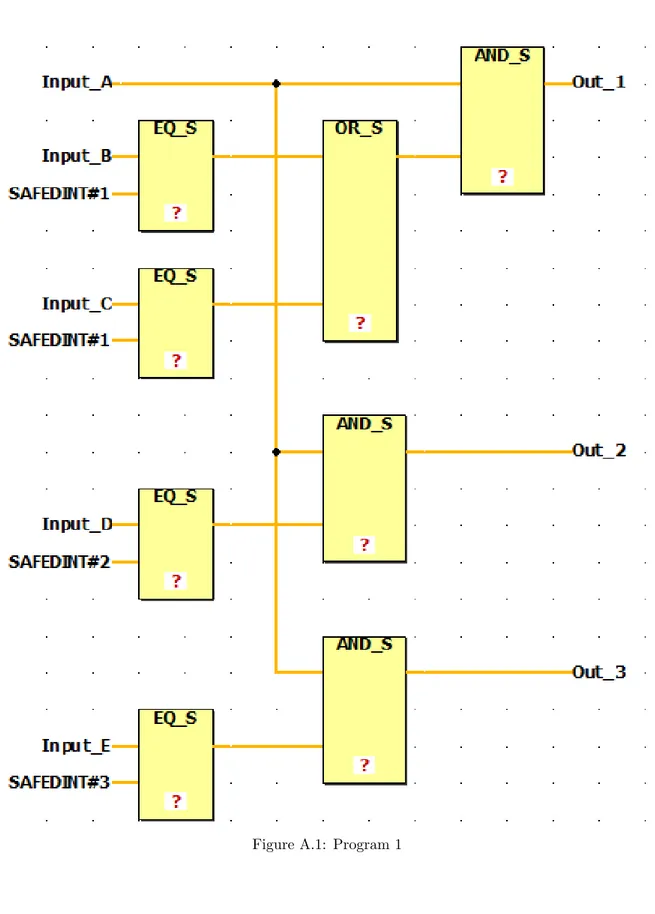
Programmable Logic Controllers (PLC) are used in a wide variety of tasks from toys to avionics and rail transport. The relative simplicity and tightly controlled cycle time makes these devices suitable for real time and safety critical systems. The International Electrotechnical Commission (IEC) has defined several programming languages for developing software for PLC computers. One of these is the graphical language Function Block Diagram (FBD). Figure2.1 shows an example of what a FBD program might look like.
Figure 2.1: An example FBD program.
FBD is used to describe how blocks are connected to form a control software system. The blocks are divided into two groups: (i) functions, which given one input always produce the same output, and (ii) function blocks, which have an internal memory for storing information about block’s current and previous states. The blocks are executed in the order they are positioned in the diagrams, from top to bottom and from left to right. In the example program shown in Figure2.1 the left most AND block would be the first block selected for execution. Even if the AND block on the right side of the diagram it is placed higher in the diagram, that block requires values produced during the execution of another block, so it cannot be executed first. From the perspective of an FBD program a cycle starts with selecting a block for execution; the block loads values from the input signals, performs its computations and writes the result to the outputs. The next block is selected according to the execution order and this happens once every cycle. Even while there are some example programs containing feedback loops and blocks that select one input over another, there are no explicit program control flow, like while loops and if statements such as found in C that can cause a block to be executed more than once during the same cycle.
A PLC system, shown in Figure2.2works as follows: First, the input values are read, either from memory or from a sensor, the program is executed and then the output is updated and passed on to another system, for example another PLC or another piece of hardware. All the four PLC
M¨alardalen University Bachelor Thesis
Figure 2.2: The PLC cycle scan.
programming languages defined by the IEC are strongly typed languages in which three data types are available: boolean, integer and real. Real values can be used but their processing takes longer than for the other types which might cause problems with the cycle time [8]. The testing of FBD programs is mostly done manually or through simulation. Because of this the testing process can become more complicated, depending on the size and complexity of the diagram and its compo-nents. Mader [8] and Tourlas [9] identified some issues with the IEC 1131-3 standard. In order for the standard to be adopted by as many manufacturers as possible, some problems would need to be addressed: the languages have semantic ambiguities and their implementation might differ across different manufacturers, which makes formal treatment of the languages difficult.
2.2
Automated Test Generation
Test generation is the process of creating input data for testing software applications or software components [10]. The data can be created specifically for testing using program specifications or it can be automatically generated based on the actual software. The goal of generating tests is to cause errors or to achieve some type of coverage criteria. There are several well researched methods of generating test data that were proposed in the last couple of years. One way, proposed by King [11] is based on symbolic execution. In symbolic execution, inputs are assigned a symbolic value as opposed to a concrete one. The operations in the code are executed on the symbol instead of a normal value and execution forks, taking each branch whenever possible. Execution ends when the program terminates normally or when an exception is thrown. The formula created by the symbols path through the program can then be solved to find a value that chooses the same branches as the symbol did. We mention here some examples of test generation tools that can create test inputs for Android software by Choudhary et al. and EvoSuite by Fraser et al. [12] for Java programs.
2.3
Program slicing
Weiser [13] describes a technique called program slicing used for extracting statements related to some specific behaviour in order to produce a smaller program still capable of the same behaviour. Slices are created based on a slicing criterion, meaning that for a statement s and variable v, the slice of a program P with respect to the slicing criterion <s, v>is a subset of P that includes the statements required to capture the behaviour of v at s. Since a program can be considered a subset of itself, at least one slice will always exist for any criterion.
This has been shown to be useful in many areas, e.g integration, testing and parallelization. Pro-gram slicing is also a common way for experienced proPro-grammers to manually debug code. The programmer is informed that something is wrong at a certain row, maybe by a debugging tool, and they move backwards through the statements until they find the cause of the bug. Slicing is usually done by first converting the program into an intermediate model, usually a graph, in order to focus on the parts of the code that is important for slicing, such as assignments and references to variables and program flow statements. Weiser uses a flow graph to model the program P that
M¨alardalen University Bachelor Thesis
is to be sliced, the graph describes the programs flow dependence or data dependence. Data de-pendence is defined as follows: A node j is data dependent on a node k if, (i) a variable x is defined at k, (ii) x is referenced at j and (iii) there exists a path from k to j where x is not redefined at any node along that path[14]. The flow graph is a structure G = (N,E,n0), where N is the set of
nodes and each node is associated with a statement from P, E is a set of edges which is a subset of NxN and n0 is the initial node. There is a path from n0to every other node in N. To find relevant
statements, each node is associated with two sets, the set of variables whose values are referenced at N called REF(n) and the set of variables whose values are defined at N called DEF(n).
Table 2.1: Computation of the relevant set. n statement REF(n) DEF(n) relevant(n) 1 b = 4 b 2 a = 3 a b 3 c = 1 c a,b 4 a = 1 + 1 a a,b a,b 5 a = a + b a,b b a,b 6 print a a a
Straight-line programs contain only assignment statements, and as such are easy to slice. Binkley and Gallagher [15] describe a simplified algorithm for acquiring the relevant sets for the criterion <n, v>:
1. The relevant set is the empty set. 2. Insert v into the relevant set.
3. The relevant set for m, the immediate predecessor of n, is
(relevant(n) − DEF (m)) ∪ (REF (m) if relevant(n) ∩ DEF (m) 6= ∅) 4. Work backwards, repeating step 3 until m = n0.
If a statement changes the elements in the relevant set then that statement is part of the slice. If an element is found in both DEF and relevant then the relevant set changes, otherwise the set is passed to the next iteration. Table2.1shows an example of this algorithm computing the relevant set of a straight line program with the criterion <6, a>. Statement 3 does not change the set of relevant variables so it is not part of the slice but statement 4 is included because it first removes then adds the same relevant variable a.
If the program that is to be sliced contains control statements, like the if or while keywords, the model needs to be expanded to account for control dependencies because the conditions of control statements might directly or indirectly affect the variables of the slicing criterion. The control dependence can be derived by a relationship called post-dominance. Ferrante et. al [16] describes the following algorithm determining control dependence: A node i is post-dominated by another node j if all paths from i to an accepting state passes through j. j is control dependent on i if and only if (i) there exists a path P from i to j where every node along P is post-dominated by j and (ii) i is not post-dominated by j.
1 i n t i = 0 ; 2 i n t x = 1 ; 3 w h i l e ( i > 5 ) { 4 x = x ∗ x 5 i = i + 1 6 } 7 p r i n t ( x ) ;
M¨alardalen University Bachelor Thesis
To account for control dependence, Binkley and Gallagher’s algorithm needs a set Control for each node or statement. In Listing2.1Control(4) and Control(5) is {3} and the Control set for top level statements is the empty set. The relevant sets for nodes that have two successors is the union of the successors relevant sets. This means that the referenced variable x at line 4 is control dependent on the variable i at line 3 so i should be part of the slice with the criterion <7, x>[17].
The slicing technique described by Weiser is now known as executable, backwards static slicing, meaning that each slice forms an executable program where the slices are created by examining statements before the chosen slice criterion. The behaviour is static meaning that it is generic slice which execution does not change based on the input. Horwitz later introduced forward slicing in [18], technique that can be used to find parts of a program which could be affected by changing or adding a particular statement. Korel and Laski defines dynamic slicing in [19]. These slices preserve the program’s behaviour for a specific input which influences conditions in branch statements. This makes it possible to reduce the size of the slices. In the same paper, dynamic handling of arrays is also investigated. Previously, an array was treated as a single variable but if we specify the input it becomes easier to consider the influence that each array element has on the behaviour of the slicing criterion.
Chapter 3
Related work
Enoiu et al. [20] proposed the use of CompleteTest for test generation based on FBD programs that is using the Uppaal model checker [21] to automatically generate test cases capable of achieving high structural coverage and ensure that they are in compliance with industry safety-certification requirements. The FBD programs are translated into timed automata, a model introduced in 1990 by Alur and Dill [22]. A timed automata is a finite-state automaton extended with timers that can trigger transitions from one state to another when it reaches a pre-determined value. The timed automata is passed to Uppaal along with a coverage criterion property expressed in modal logic. The set of modal logic formulas functions is expressed as a check list, allowing Uppaal to keep track of specific states relevant to coverage criteria. Several coverage criteria are supported (e.g., decision coverage, also known as branch coverage).
The model checker used by CompleteTest terminates its execution when one of two conditions are met: the desired test cases have been found or the program runs out of memory and no solution is found.
Several tools use program slicing in their process related to software testing and to make code easier to understand. SANTE [23] is used for C program debugging which creates a slice for every possible statement that can cause a runtime error. The slices are then used to generate test cases that will cause suspected statements to fail. They claim that slicing caused their test generation algorithm to finish almost 50 percent faster, from 25 seconds down to 13 seconds, with the slicing process taking less than one second to complete. Sward and Chamillard [24] created an Ada slicer which is used as part of the process to convert legacy programs from imperative code into objects. Their report contains many practical examples of how they dealt with slicing the control flow statements of Ada. They use a technique called Parameter-Based Object Identification on these slices to create classes.
To the best of our knowledge, no approach has been proposed for slicing FBD programs and to improve the efficiency of test generation for this kind of programs.
Chapter 4
Method for slicing FBD
programs
In this thesis we propose a method for slicing FBD programs and conduct a case study in order to measure the method’s efficiency for the purpose of generating tests. We want to evaluate the method for slicing FBD programs and investigate what effects this method has on the test cases generated by the CompleteTest tool. Improving the time it takes to generate test cases would improve its usability and application in practice.
4.1
Slicing algorithms
To create slicing algorithms for FBD programs we will analyse the data dependence and control dependence of these kind of programs similarly to what Reicherdt and Glesner[14] proposed when they used for slicing MATLAB Simulink models.
Data dependence In an FBD program, a block j is data dependent on another block k if there is a path from k to j and that path starts as an output of k and ends as an input of j. Internal input and output variables that have the same name are referred to as ”newline” variables in this thesis. Newline variables are used as an alternative way of connecting groups of blocks together -this is done by either copying the output of a group of blocks that is used as inputs for several different blocks or to improve visibility of the diagrams. Newline variables are considered data dependent on variables with the same name despite not having a visible connection.
1 i n t i = 0 ; 2 i n t x = 1 ; 3 v a r s e l e c t ( b o o l arg , v a r x , v a r y ) { 4 i f ( a r g ) { 5 r e t u r n x 6 } 7 e l s e { 8 r e t u r n y 9 } 10 }
Listing 4.1: Pseudocode describing functionality of the select block
Control dependence None of the FBD programs we had access to appear to have blocks that alters what path the signal takes through the blocks or in what order they are executed. There are blocks with similar functionality as control statements have in a C-like programming language: like
M¨alardalen University Bachelor Thesis
the select block described in listing4.1which behaves similarly to an if statement. These blocks should however not be considered as branches for the purpose of control dependence. Blocks in an FBD program are indivisible, so they cannot be sliced to exclude any of the branch paths. The slices are static because the test generation process supplies the programs with the values of their inputs, this means that the branching cannot be pre-empted and the blocks cannot be removed.
We model the structure of FBD programs using a graph. The nodes of the graph are either input, output variables or blocks. Block nodes also contains any hidden internal variables that is needed to preserve the state of the block between cycles. If two blocks are connected in the program then there is a path between the nodes representing the same two blocks in the graph.
1 Given a l i s t o f o u t p u t s c a l l e d O, c r e a t e a l i s t o f S l i c e s S 2 3 For e a c h Output , c a l l e d On { 4 C r e a t e a new s l i c e , t h e s e t o f n o d e s c a l l e d Sn ; 5 C r e a t e a l i s t o f n o d e s N ; 6 Add On t o N 7 8 f o r e a c h node Nn i n N { 9 i f (Nn can ’ t be f o u n d i n Sn ) { 10 Add t h e node Nn t o t h e s l i c e Sn 11 Add a l l i m m e d i a t e p r e d e c e s s o r s o f Nn t o N 12 } 13 } 14 Add t h e s l i c e Sn t o S 15 } 16 Remove s l i c e s w i t h o u t d e c i s i o n s .
Listing 4.2: Output slicing algorithm
Output slicing The first algorithm 4.2 creates slices by using output variables as the slicing criterion. In the code, lists are denoted by capital letters and an element removed from a list is denoted by a capital letter followed by an n. A slice is created for each output in the program. The slices contain the nodes that can be reached working backwards from the selected output. Since the purpose of generating the test cases is to show how branch coverage can be achieved any slices without a decision can be ignored. Outputs from the removed slices can assume any value because they are not used in any computations.
1 Given a l i s t o f o u t p u t s and i n t e r n a l v a r i a b l e s c a l l e d O, c r e a t e a l i s t o f S l i c e s S 2 3 f o r e a c h Output i n O c a l l e d On { 4 C r e a t e a new s l i c e , which i s t h e s e t o f n o d e s c a l l e d Sn ; 5 c r e a t e a l i s t o f n o d e s N ; 6 add a l l i m m e d i a t e p r e d e c e s s o r s o f On t o N 7 8 f o r e a c h node Nn i n N { 9 i f (Nn can n o t be f o u n d i n Sn ) {
10 Add t h e node Nn t o t h e s l i c e Sn a l o n g w i t h any c o n n e c t e d n e w l i n e v a r i a b l e s 11 Remove a l l o f t h e i n t e r n a l v a r i a b l e s t h a t was j u s t added t o t h e s l i c e from O 12 Add a l l i m m e d i a t e p r e d e c e s s o r s o f Nn t h a t do n o t have t h e same name a s Nn
13 }
14 }
15 Add t h e s l i c e Sn t o S 16 }
17 Remove s l i c e s w i t h o u t d e c i s i o n s .
18 I f two s l i c e s c o n t a i n t h e same b l o c k s when i g n o r i n g t y p e c a s t i n g b l o c k s , 19 add t h e o u t p u t v a r i a b l e s o f t h e s m a l l e r s l i c e t o t h e l a r g e r s l i c e and 20 remove t h e s e c o n d s l i c e .
M¨alardalen University Bachelor Thesis
Newline slicing The second algorithm shown in 4.3 works with lists similarly to the first one. Internal output variables are used as the slicing criterion in addition to the outputs. Newline vari-ables act as a boundary for the slicing algorithm which creates more, smaller slices than the output slicing algorithm. In the end, the slices that contain the same blocks are combined with a union operation in order to reduce the chance of passing two identical slices to the model checker.
Chapter 5
Design
In this section we describe the case study design regarding the evaluation of FBD program slicing for test case generation.
5.1
Overview and evaluation
Figure 5.1: Method for evaluating programs and their slices.
In order to evaluate the slicing algorithms, we use the method shown in Figure5.1. Each of the selected FBD programs are sliced using the two previously described algorithms to create sub-programs, also referred to as slices. The original program and the slices are used as input to the CompleteTest software which generate the test cases needed to show that for the provided programs, a certain test input sequence can achieve branch coverage. In addition to these test cases, CompleteTest can provide information on how long the search for test cases took and how much memory was needed for searching in terms of states explored. After the program and its slices have been processed, the time and memory consumed by CompleteTest on these slices is compared to the use of CompleteTest on the original program. We measure also the achieved coverage criteria.
M¨alardalen University Bachelor Thesis
5.2
Selecting programs
We began by selecting a few representative FBD programs to be used for slicing. The selected programs should be of different sizes, with regards to the number of input variables and blocks, in order to evaluate slicing on diverse type of programs. The programs used for slicing in this thesis are part of a train control management system developed by Bombardier Transportation Sweden AB. They provided access to a repository of 189 PLC programs written in a FBD language defined by IEC 61131-3. In her thesis, Ericsson [1] describes interviews conducted with three engineers from Bombardier Transportation who were part of the team that developed this system. The engineers are asked to define three size categories for PLC programs: small, medium and large. Based on these categories, the engineers were then asked to estimate the input variable interval for each category. The result is shown in table5.1.
Small PLC Program Medium PLC Program Large PLC Program Engineer 1 1-5 inputs 5-10 inputs 10-30 inputs
Engineer 2 1-7 inputs 7-10 inputs 10-20 inputs Engineer 3 1-5 inputs 5-10 inputs 10-20 inputs Average 1-6 inputs 6-10 inputs 10-23 inputs
Table 5.1: Program categories based on information provided by three industrial engineers: small, medium and large programs [1].
Based on this data, we selected two programs from each program category. The model checker can produce test cases for each of the selected programs that results in total branch coverage. All programs are sliced with both algorithms and presented in this thesis, except for programs 1, 3 and 5 because one of the algorithms produces slices that are identical to the original program.
5.3
Slicing of FBD programs
All 12 program slices are created using MITRAC CC SAFE TOOL IDE, which is used internally at Bombardier to compile FBD programs. The original programs are loaded and then manually altered. Which blocks are part of the slice is determined by either the Output or the Newline slicing algorithm and the superfluous blocks are removed. When slicing using the Newline algorithm, the meta type tag of variables that are used as input or output is changed from internal to input or output depending on where they are used in the diagram. Every slice compiled correctly and without warnings. Figure5.2shows the FBD IDE while editing (a) diagram part and (b) variables part of program 1.
M¨alardalen University Bachelor Thesis
(a) Diagram window (b) Variables window
Figure 5.2: MITRAC CC SAFE TOOL IDE
5.4
Test case generation using CompleteTest
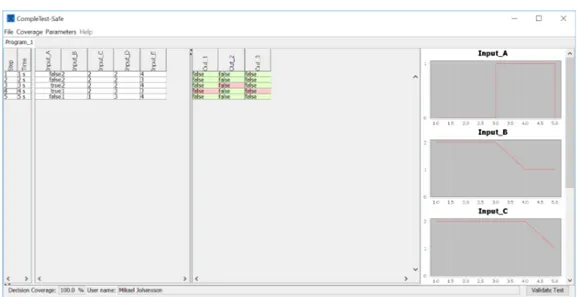
Figure 5.3: Test cases for program 1 in CompleteTest
CompleteTest presents the generated test cases in a table, as seen in figure5.3. The table has sep-arated sections, one for input variables and the other for output variables. Each column represents a variable, also called a signal and each row represents a test case. On the input side, the cells are filled with values generated by the test case search and on the output side the user can select the expected value based on the requirements. Incorrectly selected output values are marked with red and correct ones are marked in green.
Chapter 6
Results
In this chapter we present the results of the evaluation in terms of efficiency and applicability. By efficiency we refer to the time and memory required by the test case generation process. By applicability we refer to the logical coverage achieved by the slices,
6.1
Slice evaluation
We note here that all diagrams showing the original programs and their slices can be found in appendixA.
Table 6.1: Number of slices created by the slicing algorithms
Program name Number of slices Total number of inputs Program 1: Output slices 3 7 Program 1: Newline slices 3 7 Program 2: Output slices 2 10 Program 2: Newline slices 3 13 Program 3: Output slices 2 12 Program 3: Newline slices 2 12 Program 4: Output slices 5 16 Program 4: Newline slices 5 12 Program 5: Output slices 1 16 Program 5: Newline slices 2 17 Program 6: Output slices 3 51 Program 6: Newline slices 5 24
In Table6.1 we show the number of slices created by the two algorithms for all programs. The second column shows the sum of the number of input variables for the specified program and slice type. For example, the output slicing algorithm creates three slices when used on program 1 and together these slices contain 7 input variables. Depending on the layout of the programs, an algorithm might create slices based on the same program that share some input variables and blocks, this will cause some blocks to be evaluated several times. The output algorithm creates fewer slices than the newline algorithm but they are more likely to overlap. For example, the output slices of the first program share only a single variable and no blocks while the fifth output slice for the forth program is almost identical to the original program. The newline algorithm creates more slices and test cases but the slices are less likely to overlap, as with the newline slices of program 5 (A.25). Slicing with the output algorithm causes additional input variables through overlap while the newline algorithm causes additional input variables both by overlapping nodes and by converting internal variables that function like an input.
M¨alardalen University Bachelor Thesis
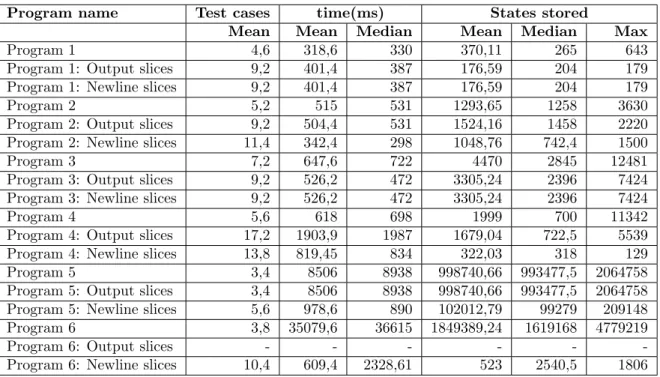
Table 6.2: Data collected required by each slice algorithm compared to original program. Program name Test cases time(ms) States stored
Mean Mean Median Mean Median Max Program 1 4,6 318,6 330 370,11 265 643 Program 1: Output slices 9,2 401,4 387 176,59 204 179 Program 1: Newline slices 9,2 401,4 387 176,59 204 179 Program 2 5,2 515 531 1293,65 1258 3630 Program 2: Output slices 9,2 504,4 531 1524,16 1458 2220 Program 2: Newline slices 11,4 342,4 298 1048,76 742,4 1500 Program 3 7,2 647,6 722 4470 2845 12481 Program 3: Output slices 9,2 526,2 472 3305,24 2396 7424 Program 3: Newline slices 9,2 526,2 472 3305,24 2396 7424 Program 4 5,6 618 698 1999 700 11342 Program 4: Output slices 17,2 1903,9 1987 1679,04 722,5 5539 Program 4: Newline slices 13,8 819,45 834 322,03 318 129 Program 5 3,4 8506 8938 998740,66 993477,5 2064758 Program 5: Output slices 3,4 8506 8938 998740,66 993477,5 2064758 Program 5: Newline slices 5,6 978,6 890 102012,79 99279 209148 Program 6 3,8 35079,6 36615 1849389,24 1619168 4779219 Program 6: Output slices - - - -Program 6: Newline slices 10,4 609,4 2328,61 523 2540,5 1806
Table 6.2 shows the data collected in terms of number of test cases generated, time to generate test cases and the number of states stored by the model checker during the search. The mean and median columns show the sum of these values for the slices, while the max states column is the maximum number of states used while processing all the slices. States stored is used as the unit of measurement for memory consumption for these experiments because it is the most accurate way of measuring memory available through Verifyta, which is the API of the Uppaal model checker used by CompleteTest. The actual memory usage of each state depends on the size of the model. Since the slices are based on the original program, a model of any individual slice uses at most the same amount of memory as a model of its original program. The data of each individual experiment presented here can be found in AppendixB.
As we can see in Table6.2, the number of test cases generated by all slices of a program are higher than the number of test cases generated by the original program. This is to be expected since the point of generating test cases based on the entire original program is to minimize the number of test cases. This problem might be alleviated by combining some of the test cases generated by these slices. Slicing reduces the processing time and concurrent memory usage of the model checker and the difference increases with number of inputs and program complexity.
Table 6.3: Average results per program by algorithm Algorithm Slices Test cases Time(ms) States stored Output 2,6 11,2 833,97 1671,26 Newline 3,25 10,9 522,36 1213,15
Figure6.3shows the average number of slices, test cases, time and states stored for all the programs, after slicing, based on what algorithm was used to create the slice. The sixth program was omitted since all of its output slices could not be evaluated, which, together with the small sample size, caused it to have a big impact on the average value. On average the newline algorithm creates more slices, this generally causes the test case generation of the slices to use less time and memory. Program 4 has a large impact on the average amount of resources required to generate test cases by the output algorithm because its layout makes the last slice require all the blocks of the original program.
M¨alardalen University Bachelor Thesis
It is possible to combine some test cases produced by slices of the same program and thereby reduce the number of extra test cases caused by slicing. Table6.4shows the test cases generated by the first and second output slice of program 1.
Table 6.4: Test cases of output slice 1 and 2 of program 1
# Input A Input B Input C Input D Output 1 Output 2 1 FALSE 1 1 FALSE 2 FALSE 1 2 FALSE 3 TRUE 1 2 TRUE 4 TRUE 2 1 TRUE 5 TRUE 2 2 FALSE 6 FALSE 2 FALSE 7 FALSE 3 FALSE 8 TRUE 2 TRUE
The first five rows show the output of the first slice and the three last rows show the output of the second slice. Rows 1 & 6, 2 & 7 and 3 & 8 can be combined since doing so would cause no logical contradiction. In an ideal scenario where two slices share no input variable it would always be possible to reduce the number of test cases in this way. In this case, the sum of all test cases produced by slices of a program would be the same as the number of test cases generated by the original program. This way of combining test cases is only possible when the order of the test cases does not matter, which they will if the program contains any blocks with internal memory. The fifth newline slice of program 6A.31is the only slice that does not achieve full coverage. The model checker shows that one the AND blocks never produces a true value. The model checker shows that all of the blocks predecessors produce both true and false values. The inputs are guaranteed to assume the full range of possible values before the test case generation halts, since memory is not a problem in this case. The simplicity of the diagram makes it easy to describe the output of the slice as a formula:
¬(A ∧ B) ∧ C ∧ B, (6.1) where A and B are every input variable of Input An and Input Bn respectively, which are connected to the OR blocks at the top of the diagram and C is the input variable Input C. If we can show that this formula can be both true or false for some value, this means that the block should be able to achieve full branch coverage, as long as the formula is correct:
¬(F ∧ T ) ∧ T ∧ T (6.2) For (A, B, C) = (F, T, T) the formula is true.
¬(T ∧ T ) ∧ T ∧ T (6.3) For (A, B, C) = (T, T, T) the formula is false. It is unclear why the model checker concludes that the slice cannot achieve full branch coverage. We investigated this issue and found a mistake in the transformation from FBD to timed automata that caused this issue.
Chapter 7
Discussion
This thesis has provided insights and experience into how slicing can be used to improve the performance of test case generation from finite-state models. The results could be useful for both engineers during testing and further research of test generation and the slicing of PLC programs described by a graphical language such as FBD. The slicing of the programs reduces the time and memory it takes to generate the test cases but increases the number of test cases which need to be executed by engineers. The increase in test cases might be desirable when time and memory are not a priority, for example when automatically checking several programs against their requirements. On the other hand slicing might give an engineer a faster response when interacting with the system under test. Output slicing might also create a more natural way of testing large programs, where changes in input influence the signal of a single output variable as opposed to configuring every single input variable and measuring all outputs for each test case.
Because of the limited scope of this thesis with regard to the number of sliced programs and how they were selected, it is difficult to say if slicing would improve the efficiency of test case generation for all FBD programs in general. We used the number of input variables as a way of determining how much time and memory the test generation procedure consumes. There are however programs in the pool of 189 provided by Bombardier Transportation with a number of input variables greater than or equal to the largest program selected as part of the experiments conducted in this paper. Since we have not investigated these programs it is difficult to say how big of an impact the number of input variables has on the resources required to conduct the test case generation.
The newline algorithm does not create slices that go back to the entry point of the original program. This results in loss of data and can potentially create test cases that are not applicable to the original program. Data of boolean value lost in this way can be recreated with relative ease, however the same cannot be said for integer or real values or the internal states of function blocks.
Chapter 8
Conclusion
CompleteTest is a tool that uses model checking to generate tests for FBD programs. For some of the large and more complex programs, automated test generation is expensive in terms of time and memory consumed while generating tests. In this thesis we proposed two slicing algorithms to help alleviate these problems. Our results show that program slicing can be used to improve test generation time and reduce the memory consumed for automated test generation at the cost of increasing the number of test cases generated. The benefit of the proposed slicing algorithms is limited by the structure of the program, as seen in the fifth output slice of program 4. The number of blocks with internal memory found in a program limits how that program can be sliced.
8.1
Future work
We believe that a more dynamic slicing method would be a significantly more efficient way of reducing the resources required for generating test cases with CompleteTest. It would likely be beneficial to conduct a study on the most complex FBD programs provided by Bombardier Trans-portation to investigate which parts of them take the longest to evaluate and to find out what, if anything, they have in common.
Using slicing to generate test cases in parallel is another avenue of future research, especially in situations where time is valued over memory. The slices are all executable independently of each other and would ideally not require any shared memory.
Bibliography
[1] S. Ericsson, “Combinatorial modelling and testing of plc software us-ing acts,” Bachelor Thesis, M¨alardalen University, January 2017, http://www.idt.mdh.se/examensarbete/index.php?choice=show&id=1929.
[2] P. Ammann and J. Offutt, Introduction to software testing. Cambridge University Press, 2016.
[3] G. Tassey, “The economic impacts of inadequate infrastructure for software testing, rti project number 7007.011,” 05 2002.
[4] F. Tip, A survey of program slicing techniques. Centrum voor Wiskunde en Informatica, 1994.
[5] A. Orso and G. Rothermel, “Software testing: a research travelogue (2000–2014),” in Proceed-ings of the on Future of Software Engineering. ACM, 2014, pp. 117–132.
[6] P. Runeson, M. H¨ost, A. Rainer, and B. Regnell, Case Study Research in Software Engineering. Hoboken, New Jersey: Wiley, 2012.
[7] R. Marinescu, “Model-driven analysis and verification of automotive embedded systems,” PhD dissertation, M¨alardalens h¨ogskola, Akademin f¨or innovation, design och teknik, Inbyggda system., October 2016.
[8] A. Mader, “A classification of plc models and applications,” in Discrete Event Systems, ser. The Springer International Series in Engineering and Computer Science, S. G. Boel R., Ed. Springer, Boston, MA, 2000, vol. 569, pp. 239–246, doi: 10.1007/978-1-4615-4493-7 24. [9] K. Tourlas, “An assessment of the iec 1131-3 standard on languages for programmable
con-trollers,” in Computer Safety, Reliability and Security, The 16th International Conference on, P. Daniel, Ed. Springer, London, 1997, doi: 10.1007/978-1-4471-0997-6 17.
[10] A. Orso and G. Rothermel, “Software testing: A research travelogue (2000–2014),” in Pro-ceedings of the on Future of Software Engineering, ser. FOSE 2014. New York, NY, USA: ACM, 2014, pp. 117–132, doi: 10.1145/2593882.2593885.
[11] J. C. King, “Symbolic execution and program testing,” Commun. ACM, vol. 19, no. 7, pp. 385–394, Jul. 1976, doi: 10.1145/360248.360252.
[12] G. Fraser and A. Arcuri, “Evosuite: Automatic test suite generation for object-oriented soft-ware,” in Proceedings of the 19th ACM SIGSOFT Symposium and the 13th European Con-ference on Foundations of Software Engineering, ser. ESEC/FSE ’11. New York, NY, USA: ACM, 2011, pp. 416–419, doi: 10.1145/2025113.2025179.
[13] M. Weiser, “Program slicing,” in Software engineering, ICSE Proceedings of the 5th interna-tional conference on. IEEE Press Piscataway, NJ, USA, 1981, pp. 439–449.
[14] R. Reicherdt and S. Glesner, “Slicing matlab simulink models,” in Proceedings of the 34th International Conference on Software Engineering, ser. ICSE ’12. Piscataway, NJ, USA: IEEE Press, 2012, pp. 551–561.
M¨alardalen University Bachelor Thesis
[15] D. W.Binkley and K. B. Gallagher, “Program slicing,” ser. Advances in Computers, M. V. Zelkowitz, Ed. Academic Press, New York, 1996, vol. 43, pp. 1–50, doi: 10.1016/S0065-2458(08)60641-5.
[16] J. Ferrante, K. J. Ottenstein, and J. D. Warren, “The program dependence graph and its use in optimization,” ACM Transactions on Programming Languages and Systems, vol. Volume 9, no. 3, pp. 319–349, July 1987, doi 10.1145/24039.24041.
[17] F. Tip, “A survey of program slicing techniques.” Centre for Mathematics and Computer Science (CWI), Amsterdam, The Netherlands, The Netherlands, Tech. Rep., 1994.
[18] S. B. Horwitz, T. Reps, and D. Binkley, “Interprocedural slicing using dependence graphs,” in Programming language design and implementation PLDI Proceedings of the ACM SIGPLAN conference on. ACM New York, NY, USA, 1988, pp. 35–46, doi: 10.1145/960116.53994. [19] B. Korel and J. Laski, “Dynamic program slicing,” Information Processing Letters, vol. 29,
pp. 155–163, October 1988, doi 10.1016/0020-0190(88)90054-3.
[20] E. P. Enoiu, A. ˇCauˇsevi´c, T. J. Ostrand, E. J. Weyuker, D. Sundmark, and P. Petters-son, “Automated test generation using model checking: an industrial evaluation,” Software Tools for Technology Transfer, International Journal on, vol. 18, p. 335–353, June 2016, doi: 10.1007/s10009-014-0355-9.
[21] K. G. Larsen, P. Pettersson, and W. Yi, “Uppaal in a nutshell,” Software Tools for Technology Transfer, International Journal on, vol. 1, p. 134–152, December 1997, doi: 10.1007/s100090050010.
[22] R. Alur and D. Dill, “Automata for modeling real-time systems,” ser. Lecture Notes in Com-puter Science, M. S. Paterson, Ed. Springer, Berlin, Heidelberg, 1990, vol. 443, pp. 322–335, doi: 10.1007/BFb0032042.
[23] O. Chebaro, N. Kosmatov, A. Giorgetti, and J. Julliand, “The sante tool: Value analysis, pro-gram slicing and test generation for c propro-gram debugging,” in Tests and Proofs, International Conference on. Springer, Berlin, Heidelberg, 2011, pp. 78–83, doi: 10.1007/978-3-642-21768-5 7.
[24] R. E. Sward and A. T. Chamillard, “Adaslicer: an ada program slicer,” in Ada: the engineer-ing of correct and reliable software for real-time & distributed systems usengineer-ing ada and related technologies, Proceedings of the 2003 annual ACM SIGAda international conference on. ACM New York, NY, USA, 2003, pp. 10–16, doi: 10.1145/992211.958423.
Appendix A
M¨alardalen University Bachelor Thesis
M¨alardalen University Bachelor Thesis
M¨alardalen University Bachelor Thesis
M¨alardalen University Bachelor Thesis
M¨alardalen University Bachelor Thesis
M¨alardalen University Bachelor Thesis
M¨alardalen University Bachelor Thesis
M¨alardalen University Bachelor Thesis
M¨alardalen University Bachelor Thesis
M¨alardalen University Bachelor Thesis
M¨alardalen University Bachelor Thesis
Figure A.11: Program 3
M¨alardalen University Bachelor Thesis
M¨alardalen University Bachelor Thesis
M¨alardalen University Bachelor Thesis
M¨alardalen University Bachelor Thesis
M¨alardalen University Bachelor Thesis
M¨alardalen University Bachelor Thesis
M¨alardalen University Bachelor Thesis
M¨alardalen University Bachelor Thesis
M¨alardalen University Bachelor Thesis
M¨alardalen University Bachelor Thesis
M¨alardalen University Bachelor Thesis
M¨alardalen University Bachelor Thesis
M¨alardalen University Bachelor Thesis
M¨alardalen University Bachelor Thesis
M¨alardalen University Bachelor Thesis
M¨alardalen University Bachelor Thesis
M¨alardalen University Bachelor Thesis
M¨alardalen University Bachelor Thesis
M¨alardalen University Bachelor Thesis
M¨alardalen University Bachelor Thesis
M¨alardalen University Bachelor Thesis
M¨alardalen University Bachelor Thesis
M¨alardalen University Bachelor Thesis
M¨alardalen University Bachelor Thesis
Appendix B
Tables
Table B.1: Test case generation
Program name Test cases generated Time(ms) Program 1 5 512 5 169 5 403 5 179 3 330 Average 4.6 318.6 Program 1: Output slice 1 5 268
3 82
4 271
3 61
5 239
Average 4 184.2 Program 1: Output slice 2 3 70
3 172
3 60
2 180
2 42
Average 2.6 104.8 Program 1: Output slice 3 3 78
2 38 2 198 3 68 3 180 Average 2.6 112.4 Program 2 5 469 5 449 5 532 6 531 5 594 Average 5.2 515
M¨alardalen University Bachelor Thesis
Table B.1 – continued from previous page
Program name Test cases generated Time(ms) Program 2: Output slice 1 5 428
5 205
4 351
4 145
4 353
Average 4.4 296.4 Program 2: Output slice 2 5 216
4 127
5 352
5 180
5 165
Average 4.8 208 Program 2: Newline slice 1 3 83
4 49
4 57
3 44
4 57
Average 3.6 58 Program 2: Newline slice 2 5 154
3 127
3 88
5 123
4 115
Average 4 121.4 Program 2: Newline slice 3 4 156
4 118 4 104 3 321 4 116 Average 3.8 163 Program 3: 7 897 7 722 7 445 8 758 7 416 Average 7,2 647,6 Program 3: Output slice 1 4 250
6 366
4 385
6 288
Average 5,4 366,4 Program 3: Output slice 2 2 106
4 275
4 88
3 249
4 81
Average 3,4 159,8 Continued on next page
M¨alardalen University Bachelor Thesis
Table B.1 – continued from previous page
Program name Test cases generated Time(ms) Program 4 5 698 7 724 4 335 5 561 7 772 Average 5,6 618 Program 4: Output slice 1 3 397
3 215
3 387
3 215
3 368
Average 3 316,4 Program 4: Output slice 2 3 406
4 422
3 424
2 202
3 196
Average 3 363,5 Program 4: Output slice 3 3 364
4 391
3 216
3 399
3 219
Average 3,2 317,8 Program 4: Output slice 4 3 412
3 208
3 236
2 236
3 243
Average 2,8 267 Program 4: Output slice 5 7 777
4 810
5 479
6 517
4 613
Average 5,2 639,2 Program 4: Newline slice 1 3 80
2 78
3 201
3 56
3 187
Average 2,8 120,4 Program 4: Newline slice 2 2 400
3 47
4 235
3 59
3 209
Average 3 190
M¨alardalen University Bachelor Thesis
Table B.1 – continued from previous page
Program name Test cases generated Time(ms) Program 4: Newline slice 3 3 90
2 200
3 60
3 189
3 67
Average 2,8 121,2 Program 4: Newline slice 4 3 71
3 40
3 204
4 61
3 194
Average 3,2 114 Program 4: Newline slice 5 2 185
2 56 2 181 2 175 Average 2 149,25 Program 5 3 8613 4 8938 3 11056 4 9504 3 4419 Average 3,4 8506 Program 5: Newline slice 1 3 1384
3 405
3 700
3 1286
3 343
Average 3 823,6 Program 5: Newline slice 2 3 229
2 70 3 227 2 59 3 190 Average 2,6 155 Program 6 4 36615 3 17052 5 53884 4 24545 3 43302 Average 3,8 35079,6 Program 6: Newline slice 1 2 389
2 77
2 69
2 271
2 114
Average 2 184
M¨alardalen University Bachelor Thesis
Table B.1 – continued from previous page
Program name Test cases generated Time(ms) Program 6: Newline slice 2 2 153
2 70
2 216
2 86
2 226
Average 2 150,2 Program 6: Newline slice 3 2 45
2 44
3 218
2 58
3 52
Average 2,4 83,4 Program 6: Newline slice 4 2 56
2 36
2 154
2 47
2 84
Average 2 75,4 Program 6: Newline slice 5 2 148
2 73
2 155
2 38
2 168