A method for estimation of average engine fuel maps : power measurements at drive wheels
102
0
0
Full text
(2)
(3) Preface The Swedish National Road and Transport Research Institute (VTI) has on commission of the Swedish Road Administration (SRA) performed a study about fuel consumption simulations based on so called engine maps. Contact person at SRA has been Håkan Johansson. Persons at VTI involved in the study: • Ulf Hammarström, project leader and documentation • Rune Karlsson, matrix based engine map generation and transmission losses • Mohammad-Reza Yahya, statistical analyses. Annelie Carlson has reviewed the documentation and made proposals for alterations. Linköping mars 2010. Ulf Hammarström. VTI notat 7A-2010 Dnr: 2005/0449-24.
(4) Quality review Internal peer review was performed on 9 March 2010 by Annelie Carlson, VTI. Ulf Hammarström has made alterations to the final manuscript of the report. The research director of the project manager Maud Göthe-Lundgren, VTI, examined and approved the report for publication on 12 March 2010.. Kvalitetsgranskning Intern peer review har genomförts 2010-03-09 av Annelie Carlson, VTI. Ulf Hammarström har genomfört justeringar av slutligt rapportmanus. Projektledarens närmaste chef Maud Göthe-Lundgren, VTI, har därefter granskat och godkänt publikationen för publicering 2010-03-12.. VTI notat 7A-2010.
(5) Table of contents Summary ............................................................................................................ 5 Sammanfattning ................................................................................................. 7 1. Introduction .............................................................................................. 9. 2. Objective................................................................................................ 10. 3 3.1. Simulation models using engine maps as input ..................................... 11 VETO, an example of a mechanistic engine map based model............. 11. 4 4.1 4.2 4.3 4.4. Rototest data ......................................................................................... 15 The Rototest hydraulic brake ................................................................. 15 Data variables........................................................................................ 15 Data material ......................................................................................... 18 Correlation analysis ............................................................................... 21. 5. Problem ................................................................................................. 24. 6 6.1 6.2 6.3 6.4 6.5 6.6 6.7. Method................................................................................................... 30 The form of engine maps for simulation................................................. 30 Transmission losses .............................................................................. 32 Engine friction ........................................................................................ 37 Engine displacement ............................................................................. 39 Parameter estimation in engine map functions ...................................... 40 Engine map crankshaft torque limits...................................................... 42 Statistical analyses ................................................................................ 44. 7 7.1 7.2 7.3. Results................................................................................................... 45 Engine map estimations......................................................................... 45 Max torque function ............................................................................... 49 Demonstration of model use .................................................................. 52. 8 8.1 8.2 8.3 8.4. Discussion ............................................................................................. 58 Uncertainties in the estimation of transmission losses........................... 58 Uncertainties in engine internal friction .................................................. 59 The form of the indicated torque function............................................... 59 The form of the normalized fuel consumption function .......................... 60. 9. Conclusions ........................................................................................... 63. References ....................................................................................................... 64 List of variables ................................................................................................ 65. VTI notat 7A-2010.
(6) Table of Appendices Appendix 1. Measurement point distributions on gear positions. Appendix 2. Correlation analysis. Appendix 3. Transmission losses. Appendix 4. Statistics for 80 and 100% engine load. Appendix 5. Estimated engine map parameters when transmission losses and engine friction are known. Appendix 6. Estimation of engine map parameters in parallel to transmission and engine friction losses. Appendix 7. Max torque function. Appendix 7.1 Engine speed at max power Appendix 7.2 Normalized max torque as a function of engine speed. VTI notat 7A-2010.
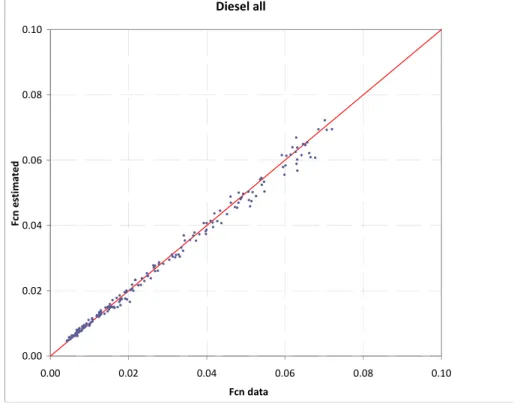
(7) A method for estimation of average engine fuel maps – power measurements at drive wheels by Ulf Hammarström, Rune Karlsson and Mohammad-Reza Yahya VTI (Swedish National Road and Transport Research Institute) SE-581 95 Linköping Sweden. Summary There is need for engine maps in order to simulate fuel consumption for road vehicles after mechanistic principles. In an engine map, fuel consumption (g/kWh or g/s) is expressed as a function of engine speed and engine torque. In general, there is a considerable lack in engine map data. The main purpose of this study is to develop a tool for assigning any segment of the car fleet a representative engine map. Two methods have been developed: a “matrix” method based on interpolation of measured values to a uniform grid of values and a “function” method based on regressions. The function alternative is in focus in this documentation. The estimated functions have a high degree of explanation (>0,97). On commission of the Swedish Road Administration, Rototest AB has measured stationary fuel consumption and exhaust emissions for more than 400 cars of different year models. If this data set could be used in mechanistic simulation models one could expect increased representativity in different applications. Advantages with the Rototest method, where the engine at measurements is mounted in the vehicle, could be increased representativity and lower costs compared to motor test bench, which is the traditional method for engine map measurements. One problem with the Rototest data set is that engine torque or power, which is needed in an engine map, is not available, only the output power from the final gear box. In order to estimate crankshaft torque, transmission losses need to be estimated. For each tested car there are at least measurements for 19 combinations of engine torque and speed: • 5 at 80% engine load • 5 at 100% engine load • 9 at constant speeds from 50 km/h and up to max vehicle speed. The data set includes both measured data from Rototest and data from the manufacturer. Manufacturer data includes max power and max torque, out from the engine, in parallel to engine speed. The difference in power from these two sources for the same engine speed should be equal to transmission losses. Estimated transmission losses at max engine power: • front wheel drive, all gear positions, and transverse engine mounting: 9.4% • rear wheel drive, direct gear, and longitudinal engine mounting: 8.3%. For rear wheel drive in other gear positions than the direct gear transmission, losses are expected to be approximately 4% higher.. VTI notat 7A-2010. 5.
(8) For estimation of transmission losses in the engine map analysis, a model based on findings of a literature survey is used including two parts: mechanical losses with fixed values per pair of gear-wheel and churning losses for the gear-wheels in the oil. The literature does not give a satisfying unambiguous picture of transmission losses. The used model for transmission losses constitutes a mix of information from the literature and from car manufacturers. For front wheel drive at max engine power the used model for transmission losses gives 5.5% losses. For simulation purposes one needs engine maps covering the whole engine working area with engine speed from idling up to the maximum use and with torque from full engine braking, negative torque, up to full load. Measured data mainly covers the high load area of the engine. There is no available Rototest data from torque zero and below. If the combustion efficiency would be constant, fuel consumption could be expressed by a product of a constant and engine indicated power (PIND). PIND constitutes of two parts: the internal friction in the engine (PFR) and the power output (PM). Since the combustion efficiency is not constant a fuel consumption function (g/s) has been formulated as a product of two factors. These factors constitute polynomials: • factor 1: a third degree polynomial of the indicated engine torque • factor 2: a third degree polynomial of the engine speed. The lack of measured data for low engine torques is to some extent automatically handled by using only such fuel consumption functions that approach zero when the indicated torque approaches zero. Parameter estimations have been performed separately for different fuel types and year model classes. The estimated functions have high degrees of explanation. In order to develop an engine map there is need for both a fuel consumption function and torque limit curves: one full engine braking and one max load curve. The developed method includes the estimation of these curves as well. All these data is, by use of the developed method, possible to estimate based on engine max power. Comments about engine friction losses based on the curves for full engine braking and on max load: • slightly more than 10 % at medium engine speed and max engine load • approximately 20% at engine max power (diesel<20% and petrol >20%) • more than 50% at normal engine load below 50%. In order to make fuel consumption simulations more representative there is need for further research about: • engine internal friction • transmission losses • auxiliaries power use • fuel consumption measurements covering more of the total engine working area • measurements for other fuels than diesel and petrol • test equipment development.. 6. VTI notat 7A-2010.
(9) En metod för uppskattning av genomsnittliga motormappar avseende bränsleförbrukning för personbilar – effektmätning från drivhjulen av Ulf Hammarström, Rune Karlsson och Mohammad-Reza Yahya VTI 581 95 Linköping. Sammanfattning Det finns behov av motormappar för simulering av bränsleförbrukning enligt mekanistiska principer. I en motormapp uttrycks bränsleförbrukning (g/kWh eller g/s) som funktion av motorvarvtal och vridmoment. Mera generellt finns en stor brist på denna typ av data. Det huvudsakliga syftet med föreliggande studie är att utveckla ett verktyg för att kunna tilldela valfria segment av personbilsparken representativa motormappar. Två metoder har utvecklats: en matrismetod baserad på interpolering och en funktionsmetod baserad på regression. Funktionsmetoden är i fokus för denna redovisning. De uppskattade funktionerna, parameterskattningar, har höga förklaringsgrader (>0.97). På uppdrag av Vägverket har Rototest AB utfört mätningar av bränsleförbrukning och avgasemissioner under stationära förhållanden på fler än 400 bilar av olika årsmodeller. Om detta datamaterial skulle kunna användas i mekanistiska simuleringsmodeller kan ökad representativitet förväntas i olika tillämpningar. Fördelar med Rototestmetoden, med motorn monterad i bilen, är möjlighet till ökad representativitet och lägre mätkostnader, jämfört med mätningar i provbänk. Mätning i provbänk är den traditionella metoden för att mäta motormappar. Ett problem med Rototestdata i detta sammanhang är att motoreffekten inte är direkt tillgänglig utan i stället uteffekten från slutväxeln. För att kunna uppskatta vridmoment ut från vevaxeln behöver transmissionsförlusterna kunna beskrivas. För varje testad bil finns mätningar för minst 19 kombinationer av vridmoment och varvtal: • 5 för 80 % belastning • 5 för 100 % belastning • 9 för konstanta varvtal från 50 km/h och upp till maximal fordonshastighet. De tillgängliga data omfattar både mätdata från Rototest och data från tillverkarna. Tillverkardata omfattar maximal motoreffekt och maximalt vridmoment, ut från motorn, parallellt med motorvarvtal. Skillnaden i effekt från dessa två källor vid samma varvtal bör motsvara transmissionsförlusterna. Uppskattade transmissionsförluster ur Rototestdata vid maximal motoreffekt: • framhjulsdrift, alla använda växellägen, och tvärställd motor: 9,4 % • bakhjulsdrift, direktväxel, och längsmonterad motor: 8,3 %. För bakhjulsdrift och andra växellägen än direktväxeln kan förlusterna uppskattas vara 4 % högre.. VTI notat 7A-2010. 7.
(10) För beskrivning av transmissionsförluster vid uppskattning av motormappar har en modell använts baserad på vad som framkommit ur en litteraturstudie. Denna modell omfattar två delar: mekaniska förluster och rotationsförluster i oljan. Litteraturgenomgången har inte gett en helt entydig bild av transmissionsförlusterna. Den använda modellen för transmissionsförluster baseras på en blandning av uppgifter ur litteraturen och från biltillverkare. För framhjulsdrift vid maximalt effektuttag ger den använda modellen 5,5 % i förluster. För simulering krävs motormappar som täcker hela arbetsområdet: motorvarvtal från tomgång upp till maxvarv och vridmoment från full släpning upp till maxmomentkurvan. Mätdata täcker i huvudsak motorernas höglastområde. Det finns inga Rototestdata tillgängliga från vridmoment noll och därunder. Om verkningsgraden i motorns förbränning skulle vara konstant, skulle bränsleförbrukning (mängd per tidsenhet) kunna beskrivas som en produkt mellan en konstant och indikerad motoreffekt (PIND). PIND kan beskrivas som summan av motorns inre friktionseffekt och uteffekt från vevaxeln. Eftersom verkningsgraden i förbränningen inte är konstant har en funktion för bränsleförbrukning (g/s) uttryckts som en produkt av två faktorer. Dessa faktorer utgörs av polynom: • faktor 1: ett tredjegradspolynom av indikerat vridmoment • faktor 2: ett tredjegradspolynom av motorvarvtal. Bristen på mätdata i låglastområdet har hanterats genom att ansätta en funktionsansats som går mot noll då indikerat vridmoment går mot noll. Parameterskattningar har genomförts separat för olika bränsletyper och årsmodellklasser. De uppskattade funktionerna har höga förklaringsgrader. För att utveckla en motormapp krävs både en mappfunktion och avgränsande momentkurvor: en kurva för full släpeffekt och en maxmomentkurva. Den utvecklade metoden omfattar även beskrivning av dessa kurvor. Alla dessa värden är med den utvecklade metoden möjliga att uppskatta utgående från motorns maxeffekt, bränsletyp och årsmodellklass. Kommentarer om friktionsförluster i motorn, relativt PIND, baserade på kurvorna för full släpning och för maxmoment: • något över 10 % vid genomsnittligt utnyttjat motorvarvtal och full belastning • ungefär 20 % förluster vid maximalt effektuttag (diesel<20 % och bensin>20 %) • över 50 % vid normal motorbelastning. För att kunna göra motorsimuleringar mera representativa finns det behov av ytterligare forskning avseende: • intern motorfriktion • transmissionsförluster • extra utrustning och användning av denna • bränslemätningar som täcker en större andel av det totala arbetsområdet • mätningar för andra drivmedel än för diesel och bensin • utveckling av mätutrustning.. 8. VTI notat 7A-2010.
(11) 1. Introduction. For several years a mechanistic simulation model called VETO has been in use at VTI in order to develop various vehicle effect models for road planning on an object level, including fuel consumption. The VETO type of model use detailed input data describing: • the vehicle • the road • driving behaviour • traffic regulations etc. The vehicle description includes: • the engine • the transmission • the vehicle chassis • the vehicle aerodynamic shape • the tyres including rolling resistance. The engine description includes an engine map. An engine map describes fuel consumption per time unit as a function of engine speed and engine torque. In principle, the more measuring points in the map that are available, the better. Also an engine map for simulation should cover both positive and negative crankshaft torque. A special analysis of the importance of measuring point density in engine maps has been performed by Karlsson (2004). A common situation is lack of engine maps and that measured engine maps usually only cover the positive torque area. On commission of the Swedish Road Administration (SRA), Rototest AB has measured stationary fuel consumption and exhaust emissions for more than 400 cars of different year models. If this data set could be used in models like VETO one could expect increased simulation representativity. For fuel consumption simulations with VETO one needs so called engine maps. One problem with the Rototest data set is that engine torque or power is not directly available but only power out from the final gear box. The number of measured points in the working area never exceeds 19 per measured vehicle, which is a relative small number. The measuring area is just limited to positive torques.. VTI notat 7A-2010. 9.
(12) 2. Objective. Fuel consumption data is available for more than 400 cars. A method shall be developed in order to make these data useful for simulation of fuel consumption. By use of simulation new simplified fuel consumption models can be developed to be used in Swedish Road Administration road planning models, like CAPCAL and EVA.. 10. VTI notat 7A-2010.
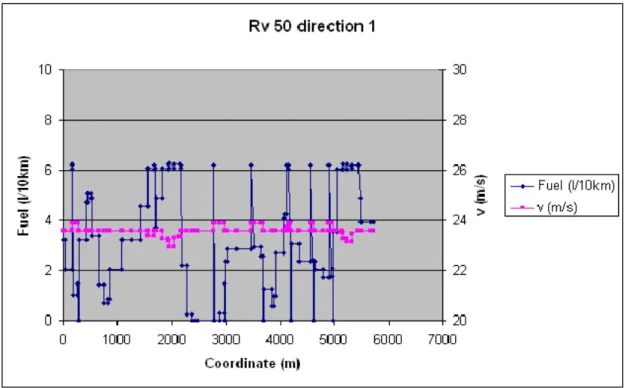
(13) 3. Simulation models using engine maps as input. 3.1. VETO, an example of a mechanistic engine map based model. The VETO program is an example on a model that is used to estimate energy use per vehicle type as a function of road design, vehicle parameters, driving patterns etc. VETO has been developed in order to estimate VOC (Vehicle Operating Costs) and exhaust emissions for road traffic. VOC does include fuel consumption. A main objective when developing VETO has been to construct a tool for evaluation of “all” road measures of importance for VOC and exhaust emissions. This type of model is of course also possible to use for the evaluation of vehicle and driving pattern measures as well. Output data from VETO is available on different levels: “meter by meter”; per road block and per road object. One further level is per direction or as an average for both directions. Energy use is described by: • fuel consumption (liter/10 km) • engine work (MJ/10 km) • engine brake (MJ/10 km) • engine efficiency (%) • wheel brake (MJ/10 km). As examples of output, diagrams 1 and 2 show speed and fuel consumption for a truck with trailer for the Swedish road object in the IERD project (national road Rv 50, Motala), the bridge alternative, for the two directions of the road.. VTI notat 7A-2010. 11.
(14) Figure 3.1 Fuel consumption and speed for a truck with trailer on rv 50, direction 1, in Motala (“bridge”).. Figure 3.2 Fuel consumption and speed for a truck with trailer on rv 50, direction 2, in Motala (“bridge”).. 12. VTI notat 7A-2010.
(15) In simulation models of the VETO type input data includes: • the vehicle • the road • the driver • the meteorological conditions. Vehicle data includes: • the engine • the transmission • the vehicle mass • the aerodynamic conditions • the tyres. Engine data includes: • the max power • the engine displacement • the max torque curve • the engine map. In an engine map fuel consumption per time unit is expressed as a function of engine speed and engine torque. For simulation there is a demand for equidistant speed and torque steps in engine maps. Measured data is in most cases not exactly in this form. In order to handle this type of problem there exist special computer programs (Edwards, 2001) in order to transfer measured data to the demand form for simulation. The transmission description includes: • the transmission of the engine out speed to the speed of the out coming axis from the final gear box • the transmission power losses. The vehicle mass used for simulation is the actual mass including the vehicle empty mass, the driver, passengers and goods. In more advanced models for evaluation of road roughness effects after mechanistic principles the mass is divided into sprung and unsprung mass. The wheels of a road vehicle need to be described with respect to the dimension, the stiffness and the rolling resistance. The road geometry is described by: • horizontal radius • gradient • cross fall/superelevation • cross section. The cross section is used together with the speed limit in order to assign a desired speed per vehicle type.. VTI notat 7A-2010. 13.
(16) The road surface description includes: • macro texture • road roughness • cross fall. The road surface weather conditions include: • dry road surface • water depth on the road • snow, depth and density, on the road. The driving behaviour includes: • desired speed on straight road sections as a function of road width and speed limit • retardation level as a function of speed • engine speed limits for gear changes both upwards and downwards • use of max available torque • gear change time. The description of meteorological conditions includes: • wind speed and direction • air pressure • air temperature. The resulting speed profile, estimated by VETO, is calculated as a function of road geometry, speed limit, vehicle performance and driving behaviour. A speed profile could also be input data to VETO.. 14. VTI notat 7A-2010.
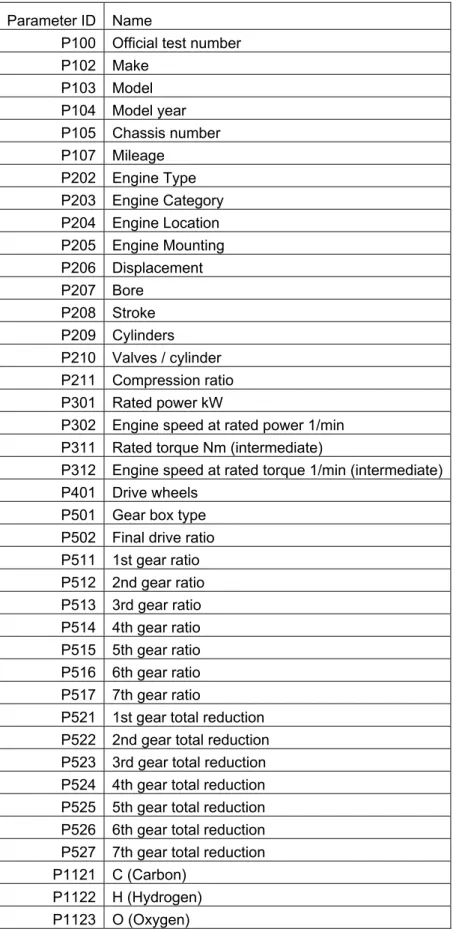
(17) 4. Rototest data. 4.1. The Rototest hydraulic brake. Rototest has a special method for engine/vehicle measurements in laboratory. The method includes a hydraulic brake connected to the drive wheels. Instead of tyres on a roll the hydraulic brake is fixed to the drive wheels. A drawback with this method, compared to engine test bench, is that the engine torque cannot be measured since the measured torque or power is reduced with the transmission losses. An advantage compared to a chassis dynamometer is that there is no problem caused by tyres on the roll. Rototest emission and fuel consumption data has been compared to data registered by VTI and by VTT (Hammarström, 1999).. 4.2. Data variables. A measurement series represents measurements for one vehicle. There are two groups of data per measurement series: • description of the vehicle, data from the manufacturer, and used fuel for measurements (test values), see description in table 4.1 • measured data (test point values), see description in table 4.2 and 4.3.. VTI notat 7A-2010. 15.
(18) Table 4.1 Description of the vehicle and used fuel for measurements (test values). Parameter ID P100 P102 P103 P104 P105 P107 P202 P203 P204 P205 P206 P207 P208 P209 P210 P211 P301 P302 P311 P312 P401 P501 P502 P511 P512 P513 P514 P515 P516 P517 P521 P522 P523 P524 P525 P526 P527 P1121 P1122 P1123. Name Official test number Make Model Model year Chassis number Mileage Engine Type Engine Category Engine Location Engine Mounting Displacement Bore Stroke Cylinders Valves / cylinder Compression ratio Rated power kW Engine speed at rated power 1/min Rated torque Nm (intermediate) Engine speed at rated torque 1/min (intermediate) Drive wheels Gear box type Final drive ratio 1st gear ratio 2nd gear ratio 3rd gear ratio 4th gear ratio 5th gear ratio 6th gear ratio 7th gear ratio 1st gear total reduction 2nd gear total reduction 3rd gear total reduction 4th gear total reduction 5th gear total reduction 6th gear total reduction 7th gear total reduction C (Carbon) H (Hydrogen) O (Oxygen). Most of the data in the table 4.1 form, with exception of fuel data, are supplied by the manufacturer of the vehicle. 16. VTI notat 7A-2010.
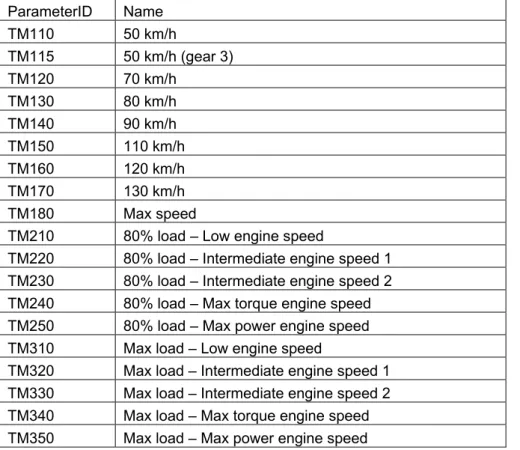
(19) Items included in measured data (test point values) are presented in table 4.2 and table 4.3. Table 4.2 Type of data from measurements. ParameterID 101 201 202 203 204 205 207 301 302 305 306 401 402 403 1001 1002 1003. Name Gear Nominal vehicle speed Vehicle speed Engine speed Calculated engine speed Measured engine speed Wheel speed Wheel torque Wheel torque / total red Running resistance power Wheel power Fuel consumption Specific fuel consumption Fuel mass flow Distance Test time Fuel quantity. Unit km/h km/h 1/min 1/min 1/min 1/min Nm Nm kW kW l/100 km g/kWh g/min m s g. Table 4.3 Data (test point values) has been measured for the following measuring points. ParameterID TM110 TM115 TM120 TM130 TM140 TM150 TM160 TM170 TM180 TM210 TM220 TM230 TM240 TM250 TM310 TM320 TM330 TM340 TM350. Name 50 km/h 50 km/h (gear 3) 70 km/h 80 km/h 90 km/h 110 km/h 120 km/h 130 km/h Max speed 80% load – Low engine speed 80% load – Intermediate engine speed 1 80% load – Intermediate engine speed 2 80% load – Max torque engine speed 80% load – Max power engine speed Max load – Low engine speed Max load – Intermediate engine speed 1 Max load – Intermediate engine speed 2 Max load – Max torque engine speed Max load – Max power engine speed. VTI notat 7A-2010. 17.
(20) For a gear box with 5 gear positions the normal selection of gears have been: • gear position 3 for TM115 (50 km/h) • gear position 4 for TM110 (50 km/h) and TM210 – 350 (80 and 100% of max load) • gear position 5 for TM120 – 180 (70 – max speed (km/h)). One should notice that all measured data represents constant engine conditions i.e. constant engine speed and constant engine torque for stabilized temperature engine conditions per test point.. 4.3. Data material. 4.3.1. Total vehicle data. The total data set includes 410 measurement series. One measurement is represented by one vehicle and a number of test points (at most 19 test points, see table 4.3). Distribution of vehicles on type of fuel: • Diesel, 34 • Petrol, 376. The number of vehicle models (model codes) is approximately the same as the number of tested vehicles. At most there are three vehicles tested with the same model code. Of 410 measurement series, 25 is SAAB and 39 is VOLVO. In table 4.4 the distribution on year models is presented: Table 4.4 Measurement distribution on year models. Year model Number of measurements. 95 2. 96 43. 97 52. 98 63. 99 61. 00 54. 01 37. 02 77. 03 21. The mileage per vehicle in the population is at most 50 985 km. Distribution of vehicles on arrangement of cylinders: • boxer: 8 • inline: 342 • V-type: 60. Distribution of vehicles on number of cylinders: • 3 cylinders: 5 vehicles • 4 cylinders: 279 vehicles • 5 cylinders: 32 vehicles • 6 cylinders: 74 vehicles • 8 cylinders: 19 vehicles • 12 cylinders: 1 vehicle.. 18. VTI notat 7A-2010.
(21) Distribution of vehicles on valves per cylinder: • “0” valves: 2 vehicles • 2 valves: 73 vehicles • 3 valves: 9 vehicles • 4 valves: 299 vehicles • 5 valves: 26 vehicles • 8 valves: 1 vehicle The total displacement ranges for all test vehicles from 796 to 5 998 cm3. Maximum engine power interval for all test vehicles: 37 to 331 kW. In table 4.5 the distribution on engine types is presented. Table 4.5 Type of engines. Type CI DI TC CI IDI TC N/A SI DI NA. Number 36 2 1 9. SI NA. 300. SI SC. 5. SI TC Total. 57 410. Comment Compression Ignition Direct injection Turbo Compound (Diesel engine with direct injection and turbo) Compression Ignition Indirect Injection Turbo Compound (Diesel engine with prechamber injection and turbo) Not available/analysed Spark Ignition Direct Injection Natural Aspiration (Otto engine with direct injection and without turbo) Spark Ignition Natural Aspiration (Ottomotor (with gate injection) without turbo) Spark Ignition Stratisfised Combustion (Otto engine with stratified combustion) Spark Ignition Turbo Compound (Otto engine with turbo). Distribution of vehicles on engine location: • Front: 397 • Middle: 7 • Rear: 6. Distribution of vehicles on engine mounting: • Longitudinal: 109 • Transverse: 301. In table 4.6 an overview of the vehicle distribution on fuel type, transmissions etc. is presented.. VTI notat 7A-2010. 19.
(22) Table 4.6 Vehicle number distribution.* Year of first registration –1999 longitudinal transverse autom manual autom manual Diesel engines and front wheel drive 2 4 Petrol engines and front wheel drive 1 10 2 148 Diesel engines and rear wheel drive 4 Petrol engines and rear wheel drive 21 All wheel drive and diesel: 7 vehicles All wheel drive and petrol: 17 vehicles. 2000– longitudinal transverse autom manual autom manual 2 1. 5. 2. 2. 8. 19. 9 8. 96. *The total number in the table is different from the total number of test series depending on missing data in some cells.. In table 4.7 the distribution of test vehicles on number of gear positions is presented. Table 4.7 Distribution of test vehicles on number of gear positions. Number of gear positions 4 5 6 Total. Automatic 24 44 6 74. Manual 1 304 31 336. In Appendix 1 the distribution of test points on different gear positions is presented. The largest amount of test points is available for petrol engines, front wheel drive, transverse engine mounting and manual 5 position gear box. The test point distribution for this vehicle class • gear position 3: 11% • gear position 4: 41% • gear position 5: 48%. 4.3.2. Data for engine map analysis: front wheel drive, transverse engine mounting and manual gear box. For the final analysis, data has been limited to: • front wheel drive • transverse mounting of the engine • manual 5 gear position gearboxes.. 20. VTI notat 7A-2010.
(23) Comments on data for front wheel drive and transverse engine mounting: • diesel: - number of vehicles, 13 - observations/measuring points, 196 - engine speed interval: 1200 to 4300 rpm - engine speed interval relative to max power engine speed: 0,30 to 1,05 •. Petrol: - number of vehicles, 242 - observations/measuring points, 3591 - engine speed interval: 1000 to 7400 rpm - engine speed interval relative to max power engine speed: 0,15 to 1,10.. The reason for restricting the data set for analyze is to reduce a negative influence on the analysis from different transmissions with different transmission losses.. 4.4. Correlation analysis. 4.4.1. Method. In order to develop engine maps, information describing the importance of different engine variables or measurement conditions is of interest. The importance could be expressed by correlation values between fuel consumption and all other available variables. Such an analysis should be made for certain engine working points. Of course, fuel consumption has a high correlation with engine power. One alternative is to normalize fuel consumption to engine max power since there also are several other variables with high correlation to engine max power. The data material includes both fuel consumption data and numerous vehicle variables. The fuel consumption data represents different engine loads. For further analysis correlations between fuel and vehicle variables could be of interest. Fuel consumption measurements represent up to 19 engine load points (TM110 – 350). In order to make the correlation analysis more meaningful some measures have been taken: • to normalize fuel consumption by PMdriv_rat/1000 • to select estimated fuel consumption values for the power to 25; 50 and 100% of PMdriv_rat PMdriv: measured power out to the drive wheels (W) PMdriv_rat: maximum measured power out to the drive wheels (W) Normalize fuel consumption: Fcndriv=((Fuel quantity (g))/(Test time (s)))/(PMdriv_rat/1000) Fcndriv: measured fuel consumption normalized with the maximum power measured at the drive wheels (g/(s*kW)). VTI notat 7A-2010. 21.
(24) Classify data into diesel and petrol. For each vehicle test estimate parameters in the function based on at most 19 test point values: Fcndriv=a0+a1*(PMdriv/PMdriv_rat)+a2*(PMdriv/PMXdriv_rat)2 For each vehicle test calculate three values with the Fcndriv function: 0.25, 0.50 and 1.0 times the engine load (PMdriv/PMXdriv_rat). Include these three values to the data set per test. There are two types of correlation analysis: • fuel consumption, Fcndriv, to other variables • other variables without Fcndriv. The estimated correlation values are presented in Appendix 2. 4.4.2. Analysis. Correlations between normalized fuel consumption, Fcndriv, and other variables (see Appendix 2). There are fuel consumption values (Fcndriv) for three levels of engine load (PMdriv/PMdriv_rat): 0.25, 0.50 and 1.0. Comments to correlation results for petrol engines to other variables: • all absolute values>0.25 for all three loads: no such values • all absolute values ≤0.25 and with the same sign per variable for all three loads: o when the proportion of rear wheel drive increases Fcndriv decrease o when the proportion of transverse mounting increases Fcndriv increase o when the proportion of automatic gear boxes increase Fcndriv increases o when the compression rate increases Fcndriv decreases o when the number of cylinders increases Fcndriv decreases o when the amount of fuel carbon increases Fcndriv decreases. The lowest engine load, 0.25, has the largest number of absolute correlation values ≥0.25 Comments to correlation results for diesel engines per variable: • all absolute values >0.25 and with the same sign: - when the proportion of automatic gearboxes increases Fcndriv increases - when bore increases Fcndriv increases - when compression increases Fcndriv increases. 22. •. all values per variable with the same sign and an absolute value ≤ 0.25: - when mileage increases Fcndriv decreases - when model year increases Fcndriv decreases. •. at least one absolute value ≤0,25 and with the same sign per variable for all three loads: VTI notat 7A-2010.
(25) o o o o o o. when model year increases Fcndriv decreases when mileage increases Fcndriv decreases Fcndriv is lower for transverse mounting compared to longitudinal mounting When engine displacement increase Fcndriv decreases When rated power increases Fcndriv decreases Fcndriv is higher for rear wheel drive compared to front wheel drive.. Correlations within the group of vehicle variables (see Appendix 2). Comments (obvious correlations are excluded) on petrol engines with absolute correlation values>0.3: • engine category and gear box: V-type engine has higher proportion of automatic gear box compared to inline engine • engine displacement and gear box type: when the displacement increases the proportion of automatic gear box increases • drive wheels location and type of gear box: rear wheel drive has higher proportion of automatic gear box compared to front wheel drive • valves/cylinder and rated power: when number of valves increases rated power increases. Comments (obvious correlations are excluded) on diesel engines with absolute correlation values>0.3: • engine displacement and drive wheels: rear wheel drive has higher displacement compared to front wheel drive • rated power and gear box type: when the power increases the proportion of automatic gearboxes increases • drive wheels and gear box type: rear wheel drive has a higher proportion of automatic gearboxes compared to front wheel drive • cylinders and valves/cylinder: when the number of cylinders increases the number of valves per cylinder increases • model year and compression ratio: compression ratio decreases with increasing year model.. VTI notat 7A-2010. 23.
(26) 5. Problem. In an engine map, fuel consumption or exhaust emissions are described for different engine speeds and engine crankshaft torques. The engine crankshaft torque is not directly available in Rototest data. Because of this there are some problems that needs to be solved: • there is need for engine map data as a function of engine crankshaft torque and speed instead of the Rototest form of data, power at the driving wheels • there is need for engine maps covering the whole engine working area • there is need for a method in order to transform measured data to a form useful for mechanistic based simulations in general • there is need for a method in order to estimate an engine map for any engine type or engine size. Measured Rototest data represents power at the drive wheels (PMdriv) instead of the crankshaft power (PM). The resulting engine power at the drive wheels (PMdriv) is a function of: • engine crankshaft power • transmission oil rotation losses • transmission mechanical losses. Transmission losses consist of mechanical losses and oil rotating losses. Mechanical losses are described as a fixed percentage value of the power into or out from the gear box. Rotating losses are just a function of rotation speed of the gear wheels. Mechanical losses appear in the gear box and in the final gear box. For rear wheel drive these are separate units but for front wheel drive they are integrated into one unit. If PMdriv is known there is a possibility to estimate PM by adjusting for the losses in the transmission (a power equation). The power equation is different for rear and front wheel drive. Rear wheel drive: ((PM-PVX)*(VGVX/100)-PBX)*(VGBX/100)=PMdriv PM=(PMdriv/(VGBX/100)+PBX)/(VGVX/100)+PVX where, PM: engine power at the crankshaft (W) VGVX: mechanical efficiency in the gear box (%) VGBX: mechanical efficiency in the final gear box (%) PVX: churning losses in the gear box (W) PBX: churning losses in the final gear (W) 24. VTI notat 7A-2010.
(27) In this expression the mechanical efficiency is multiplied with the effect going into the transmission minus the rotation losses. It is not obvious if the efficiency factor should be multiplied with the effect coming into the transmission or coming out from the transmission. To some extent it is a matter of definitions and in what way the efficiency has been measured. In the VETO model the transmission losses are described as above. VGVX is a function of gear position: for the direct gear the efficiency is 100% and for all other gear positions k1 %. VGBX has a constant efficiency. Front wheel drive: (PM-PVBX)*(VGVBX/100)=PMdriv PM=PMdriv/(VGVBX/100)+PVBX where VGVBX: mechanical efficiency in the total transmission (%) PVBX: churning losses in the total transmission (W) For front wheel drive the mechanical efficiency VGVBX is supposed to be the same independently of the gear position. The rotation losses should mainly be expressed as functions of the incoming axle rotation speed. For rear wheel drive there are two gear box units with different incoming rotation speeds. The relation between these speeds depends on gear position. For front wheel drive the gear box and the final gear box is combined to one unit. In this transmission unit the relation between rotation speeds of different gear wheels depends on the gear position. In both alternatives there is in principal a need to describe rotation losses as a function of the different parts of the transmission. In the case of front wheel drive the transmission could be regarded as two parts. The Rototest data includes information which in principle would be enough for estimation of transmission losses: • maximum engine power and maximum engine torque presented by the manufacturer • maximum engine power and torque at the drive wheels measured by Rototest. These data should give the possibility to estimate total losses for at least two engine speeds and loads. However, the real situation is a bit different since: • the true maximum power presented by the manufacturer can be in a range of +/5% from the presented value • that the cooling fan in Rototest measurements could be in a different mode than for the manufacturer data. VTI notat 7A-2010. 25.
(28) •. the engine speeds can differ between the manufacturer data and the Rototest data.. In order to use Rototest measured data for engine map estimation transmission losses need to be estimated in all 19 measuring points. Mechanistic simulations based on engine maps demand: • that the total working area of the engine can be described • that engine torque and engine speed can be used in order to read values in the engine map • that interpolation in order to describe all engine working points is possible. An engine map should cover: • an engine speed range from idling up to max engine speed on the road • an engine torque range from full engine brake, negative torque, up to max engine torque per engine speed. The engine speed interval in Rototest measured data: • petrol engines: 1000 to 7400 rpm • diesel engines: 1200 to 4300 rpm. In order to estimate fuel consumption, based on an engine map matrix, up to the max torque curve and down to the engine brake torque curve there is need for interpolation points outside the engine working area. For estimations close to the braking curve engine map values below the braking curve are needed and expected to have a negative sign. The lack of data for negative torque when using Rototest is not very critical since we know that fuel consumption (Fc) will decrease when the indicated engine power (PIND) decreases and that Fc, when PIND is equal to zero, should be approximately equal to zero. For petrol engines at full engine brake there is a fuel consumption > 0 in an engine speed interval and equal to zero outside this interval. For diesel engines Fc = 0 at full engine brake in the whole engine speed range. Probably Fc will not go continuously to zero when Mind approaches zero since there is probably a step effect between fuel injection and no fuel injection. In an engine map, Fc is expressed as a function of two variables, engine speed and torque, and can be represented: • by a matrix (normal) • by a function (unusual). Of course, the most useful alternative would be the function alternative. One drawback with a function could be if data varies with engine speed and torque in a very complex way. Such relations could be difficult to describe by a continuous function. With a function both alternatives are possible to use. If a matrix is used there must be equidistant steps of torque and engine speed in order to interpolate in VETO. Since the max torque curve and the engine brake curve are not 26. VTI notat 7A-2010.
(29) straight lines the matrix need, of interpolation reasons, to cover an area at least as big as the real engine working area. The number of measured points by Rototest per vehicle does not exceed 19. Each point represents one engine speed and one torque value. In order to use data one needs to make interpolations and extrapolations respectively to cover all engine real world working points. Extrapolations, especially for engine load below the measured area, should be based on engine technology knowledge if possible. The objective is to estimate average engine maps covering the entire working area representative for different classes of cars. The Rototest data mainly covers the high load area of engine maps. One problem then is to estimate the representativity of estimated maps in the area without available data. An engine map for simulation also requires the max and min torque curve as a function of engine speed. The min torque curve represents full engine braking. There are measuring points available on the max torque curve, both from the manufacturer and from Rototest, but no measurements for the min torque curve. One problem is that the Rototest max torque curve is not measured for the crankshaft but instead for the final gear box. The fuel consumption (mass/time) in an engine is proportional to the developed power (PIND) inside the cylinders. If the efficiency of the combustion was constant, fuel consumption per time unit could be described as: Fc=k*PIND PIND=NRs*Mind*6.28 PIND=PM+PFR+PAUX where, PIND: indicated engine power i.e. power developed inside the cylinders (W) Mind: indicated engine torque (Nm) PM: engine power out from the crankshaft (W) PFR: engine internal friction (W) PAUX: power need for auxiliaries (W) PFR constitutes different types of friction, in particular the friction inside the cylinders.. VTI notat 7A-2010. 27.
(30) The sum of PFR and PAUX represents full engine braking. Auxiliaries could include the engine cooling fan, air condition etc. The use of the cooling fan depends on the engine temperature which depends on the engine power. The fan could be activated at full load but normally not at partial load. There could be a problem to know what is included in PAUX and PFR. In this study PFR is intended to represent the sum of both effects. If the combustion efficiency inside the cylinders is not constant Fc could for example be expressed by: Fc=c0*(Mind+c1*Mind2+c2*Mind3...)*(NRs+c3*NRs2+c4*NRs3...) If such a function can be estimated one just has to estimate Mind in order to use estimated functions. The idea behind using Mind instead of M is that Mind is more related to the energy transformation in the cylinders. Of course M could be used as well but then Mind need to be expressed from M. Mind is the direct measure to use for describing the fuel used. To describe PVX, PBX and PVBX one needs general expressions which can handle all sizes of light vehicles. The transmission losses (W) can be expected to increase with engine size. Engine size can be described by rated power or swept volume. Since the expression for rotating losses includes incoming rotation speed it should be enough with a torque indirect measure which could be swept volume. The objective is to finally estimate engine map functions Fc(NRs,M) for simulation where M represents the crankshaft torque. The reason for using M is that simulation models in general are expected to use this measure. In order to reach this objective the expression (function) for Mind needs to be representative. One first demand to reach is that the form of the Mind function is representative. The next demand is to have representative parameter values. Parameter values can be assigned in different ways: • all parameters in Mind are estimated in parallel to c0-c4 • parameter values for PFR or for transmission losses from other sources are used as input. In order to use the fuel function with Mind as independent variable the user must be able to describe Mind. Mind also should be described in the same way as used in the parameter estimation. If not, there is a risk that when the user estimates Mind this will be different to what the parameter estimation of c0-c4 represents. In road planning and for national inventories of CO2 there is need for values representing different segments of the national car fleet. Such segments could represent an engine size class and an age class. The statistical data available for such a segment could be the average of: • engine power • engine swept volume • vehicle weight • fuel consumption for a standardized driving cycle. From such a set of statistical data an engine map should be possible to estimate.. 28. VTI notat 7A-2010.
(31) Of course, there could also be need for an engine map representing a special vehicle model. In this study the objective is limited to average engine maps for vehicle fleet segments. It is not obvious how to develop a method for estimation of an average engine map, especially if the group of measured vehicles is not representative for the group of vehicles the engine map should be representative for. One alternative could be to use a method like in Sturm and Hausberger (2007). In this method all data is normalized by the engine rated power. The torque is described as a percentage value of the max torque per engine speed. Also engine speed is described by a percentage value of the engine speed at the rated power. Based on the engine power the average engine maps can then be estimated. In order to use this method an engine map per tested vehicle need to be developed. An average engine map should also reflect the frequency of different vehicle models in the fleet.. VTI notat 7A-2010. 29.
(32) 6. Method. 6.1. The form of engine maps for simulation. 6.1.1. General need. There is need for a method in order to estimate engine maps for average typical vehicles in different segments of the national vehicle register. Effect models should be representative for such segments. So far such class representative effects have in general been developed based on one average vehicle description per such class. An alternative could be to use a distribution of engine maps for the class. Engine maps could have different dimensions: g/s; g/kWh etc. For simulations g/s would be the most suitable alternative. In order to estimate an average engine for a class of vehicles one needs a method that can estimate an engine map based on a few data describing the segment of vehicles. Such data could be average power or swept volume for the vehicle segment. From such data one need to estimate: • the max torque curve for the engine speed interval • the min torque curve for the engine speed interval • fuel consumption for each point in the engine working area with the min and max torque curves as limits. 6.1.2. Engine map forms. An engine map can be defined as a function of two variables (engine speed and torque), where the function values somehow represent the behaviour of the engine, such as fuel consumption, energy use, emission of various types of pollutants. In this report only fuel consumption is considered. In principle, the engine map function can be represented in at least two different forms: • as a matrix • as an analytical expression (“continuous function”). The matrix form can be considered as a discretization (sampling) of the continuous function onto a uniform mesh of grid points (i.e., the grid points should be located at equidistant steps in engine speed and torque). Existing simulation models, like VETO, in general use the matrix form for input data. In order to evaluate the map at an arbitrary point, an interpolation of the matrix values between the grid points has to be done. This is not necessary if an analytical expression is available instead. The reason for using the matrix form is that analytical expressions can rarely be obtained for engine maps. This is particularly true when the engine maps represent exhaust emissions, where the engine map usually depends on torque and engine speed in a very irregular manner. The analytical expressions presented in this report constitute a very rare example of non-matrix representations of engine maps. 6.1.3. Methods for computing engine maps. Below new methods for estimating matrices and methods for function estimations is described. In both cases normalization of data is a major issue to consider.. 30. VTI notat 7A-2010.
(33) Normalization of data Representative engine maps for a specific vehicle segment can be based on measurements of one or several engines. If data from more than one engine are used then these data must first be normalized before a common estimation of a representative engine map can be done. Normalizations should be done in three respects: • fuel consumption is normalized by the max indicated engine power • engine speed is normalized by the engine speed at maximum power • indicated engine torque is normalized by the maximum indicated torque at per normalized engine speed. Normalizations can be done explicitly, by computing new input data, or implicitly, by introducing variables (e.g. maximum power) in function expressions that should correspond to normalization quantities. Matrix estimations The way of normalizing engine maps has been described by (Rexeis et al., 2005). In a previous project at VTI (Edwards, 2001), a method was developed for estimation of matrix engine maps, EMAP2000. This method has been further improved and developed in the present project, see (Karlsson, 2007) and the modified method is described in the following section. Estimating a representative matrix engine map involve two basic difficulties: normalizations and the interpolation of irregular data onto a common uniform mesh. Once this has been accomplished the final representative matrix can be computed by taking averages in the common mesh points. The averaging operation is not only performed on the engine map, but also on the maximum torque curve. Normalization operations act on discrete sets of data and involve two-dimensional transformations in the torque-speed plane and interpolations. Although they tend to become rather complicated, they are in fact rather straightforward. Data, for each engine separately, can be interpolated using a two-dimensional interpolation routine in MATLAB: griddata. This routine produces a nice, smooth interpolation surface within the convex hull of the given points. However, outside this convex hull no values are obtained. This phenomenon highlights a problem that would arise with any routine used for interpolating between a set of points in the plane: it produces unreliable results outside the region where data is given. In order to handle this problem the following procedure was invented. In a first step, a function is approximated to the given data. This approach is similar to the continuous function method, but here a rather simplified expression is used: Fc = c0*Mind + c1*Mind*NR + c2*Mind*Mind*NR + c3*Mind*NR*NR The coefficients, c0-c4, are determined by a least squares approximation to the given data. This function is then evaluated in a number of points along a rectangular “boundary” surrounding the area of interest in the torque-speed plane. The original set VTI notat 7A-2010. 31.
(34) of measurement data is extended with these boundary points. Finally, the MATLAB interpolation routine, griddata, is applied to the extended data set. In this way, the engine map matrix can describe any local irregularities in the engine map, while at the same time have stable global properties. The above procedure requires that the measurement errors are small. In particular, if two data points are located very close to one another in the torque-speed plane, these should be replaced by a single point. Otherwise a local disturbance might arise in the interpolated surface, having no physical significance. Continuous function estimations The basic idea is to approximate a function, to all data from the various engines in a vehicle segment, simultaneously by regression. Much of the complications that arise in the matrix method can be avoided. The basic difficulty is to find an appropriate function expression. This should preferably be based on a physical model with only a few unknown coefficients to be determined. The continuous engine map function has been formulated in section 5: Fc=c0*(Mind+c1*Mind2+c2*Mind3...)*(NRs+c3*NRs2+c4*NRs3...) The basic Fcn function is the same both with and without parameter (PFR and PVBX) estimation. The difference between the alternatives is the expression of Mindn. This alternative gives in principle a possibility to also, in addition to fuel parameters, estimate transmission losses and engine internal friction. 6.1.4. Method used. Both methods described in 6.1.2 have been developed. The advantage with the matrix method is that any complex surface can be described. Essentially, the continuous function method has been used and presented in this document. The advantage with the continuous function alternative should be a more simple method for the user of engine maps. The performed analysis includes both with and without weighting. The weighting alternative is based on the number of vehicles per model in the national vehicle register 2004.. 6.2. Transmission losses. 6.2.1. Literature review. A literature survey has been performed within the scope of this project (Karlsson, 2007) 1 . The purpose of the survey was to search the literature for an appropriate model describing transmission losses, which could be implemented in a vehicle simulation. 1. Karlsson, R., Transmission losses – a literature survey. Unpublished notes, VTI.. 32. VTI notat 7A-2010.
(35) program such as VETO. It is important to obtain a model which is representative for a large part of road vehicles. However, formulating a general model for transmission losses is, a task of considerable complexity. There are a number of reasons for this: • the transmission system usually consists of a large number of parts where losses may occur • the configuration of the system may vary substantially from one vehicle model to another • different types of losses exist • different (competing) methods exist for estimating the losses • some types of losses are heavily dependent on the temperature • also the viscosity of oil may be important. One major difficulty is the incoherent and disparate results presented in the literature. Data is rather inhomogeneous and incoherent, making it difficult to compare and evaluate different results. This is very clearly illustrated in the present survey. One reason for this is the lack of standardization and benchmark equipment for this type of studies. Different types of gear boxes are used in different papers making it difficult to evaluate the various methods. Instead of using data from other sources, we have as an alternative tried to estimate transmission losses from the Rototest data, see section 6.2.2. One way to describe the transmission losses is to use general data from the literature. Transmission losses include: • the lubricant churning losses • mechanical losses. The churning losses are functions of the revolution speed of the incoming axle into the gear box. With the gear box in neutral position there could still be churning losses. If the clutch is pressed down there will not be any churning losses for a stopped vehicle but for a moving vehicle. The mechanical losses are functions of the number of pair of gear-wheels involved in the power transmission. There are, at least for rear wheel drive, two main alternatives for a gear box not in neutral position: • With a direct gear: o direct gear position: no mechanical losses o other gears: two pairs of gear wheels involved • Without a direct gear: for all gear positions two pairs of gear wheels are involved. For the final gear box there is only one gear position. The number of involved pairs of gears is always one. Instead there is a difference in mechanical losses as a function of the angle between the incoming and outgoing axle: - if parallel, losses 2% - if 90 degrees, losses 4%. The churning losses are described in section 5.. VTI notat 7A-2010. 33.
(36) 6.2.2. Estimation of transmission losses based on crankshaft power data from the manufacturer and measured drive wheel power from Rototest. For each vehicle model there is official rated power and torque reported by the manufacturer. These data have been measured by Rototest as well, but out from the drive wheel axis. The difference between these data represents transmission losses at special engine loads. One problem with this method is the influence of the cooling fan. This fan is activated automatically as a function of the conditions. It could be activated in some driving modes and not in others. There is a risk that the fan might have been activated at different modes by the manufacturer and by Rototest. However, there is no information available about activated or not. The power use for the fan could be of the same size as transmission losses. In order to estimate transmission losses based on these data the cooling fan should be in the same mode in both data sets. This requirement has not been fulfilled. In order to estimate transmission losses the engine must have the same engine speed and same torque in both data sets. The only data possible to use then is at max engine load. The engine speeds at max load will not be exactly the same in the data sets. In order to handle this problem only power values with small differences in engine speed can be compared. A limit value for acceptance has been formulated: 1 % difference in engine average speeds per data set between manufacturer and Rototest. With this limit value most data for year models –1999 are accepted for estimation of transmission losses. There are no measurements accepted for year models 2000–. In Appendix 3 estimated average values are presented: • number of cars per cell • max engine power (P301) • engine speed at max power (P302) • max drive wheel power (P306 in 350) • engine speed at max drive wheel power (P204 in 350). Structure of data in Appendix 3: • year of first registration class • fuel type: diesel or petrol • engine position: front; middle or rear • engine mounting: longitudinal or transverse • drive wheels: front, rear or all • type of gear box: automatic or manual • gear ratio: =1 or ≠ 1.. 34. VTI notat 7A-2010.
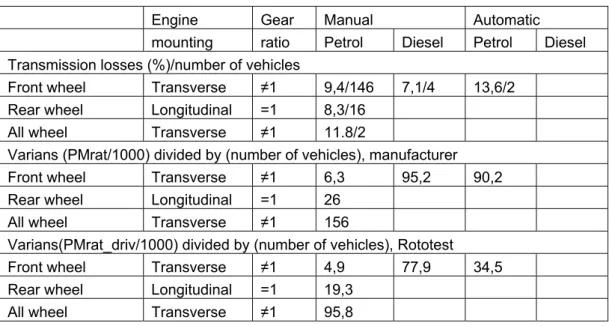
(37) Table 6.1 Transmission losses, mechanical and lubricant churning losses, and number of observations at rated engine power for year models –1999.*((losses(%)/number vehicles). Engine Gear Manual mounting ratio Petrol Diesel Transmission losses (%)/number of vehicles Front wheel Transverse ≠1 9,4/146 7,1/4 Rear wheel Longitudinal =1 8,3/16 All wheel Transverse ≠1 11.8/2 Varians (PMrat/1000) divided by (number of vehicles), manufacturer Front wheel Transverse ≠1 6,3 95,2 Rear wheel Longitudinal =1 26 All wheel Transverse ≠1 156 Varians(PMrat_driv/1000) divided by (number of vehicles), Rototest Front wheel Transverse ≠1 4,9 77,9 Rear wheel Longitudinal =1 19,3 All wheel Transverse ≠1 95,8. Automatic Petrol Diesel 13,6/2. 90,2. 34,5. * Restricted to data with a maximum deviation in average engine speed of 1 % between manufacturer and Rototest.. The variance for the average value is in general smaller for Rototest data compared to manufacturer data. To some extent this is expected since the Rototest variable is smaller than the variable reported by the manufacturer. Transmission losses have been estimated at one engine working point, the max power. Data could also be used for estimations at the max torque. The relative transmission losses depends on NRs and M: Relative transmission losses= (a+b*NRs+c*M)/M When M increases and NRs decreases the relative transmission losses will decrease. For front wheel drive total relative transmission losses will be in the interval: (1 – VGVBX/100) < relative transmission losses ≤ 1, if PM≥ transmission losses (W) VGVBX: mechanical transmission efficiency for front wheel drive...(%) 6.2.3. Modelling of transmission efficiency. There is need for a complete description of the transmission efficiency. Transmission efficiency has been based on a literature survey and contacts with a car manufacturer. The modelled transmission efficiency can be compared to Rototest data. Transmission efficiency based on Rototest data represents the max torque curve.. VTI notat 7A-2010. 35.
(38) Transmission efficiency increases with increasing engine load. When comparing the used model with estimations based on Rototest data it must be for the same conditions. Both for rear and front wheel drive the relative efficiency of the transmission increases when the engine speed decreases or when the torque increases. Light vehicles with rear wheel drive. Mechanical losses: • gear box: two pair of gear wheel in all gear positions with exception for the direct gear; 2% losses for each pair of gear wheel i.e. in total 4% losses for all gear positions with exception of the direct gear position. The efficiency (VGVX) will then be 96% in other gear positions than the direct gear and 100% on the direct gear • final gear box: the efficiency (VGBX) for 90° between incoming and outgoing axis is estimated to 96%. Lubricant churning losses Like in M501 (Hammarström and Karlsson, 1987): PVX=PMrat/78000)*(2.156*NR+0.02588*NR2) 2 PBX=PMrat/78000)*(11.64*NRk+0.3068*NRk2) PMrat: max engine power (W) NRs: rotation speed for the incoming axis to the gear box (rps) NRsk: rotation speed for incoming axis to the final gear box (rps) Total transmission efficiency Estimated total transmission efficiency for petrol car on direct gear by Rototest: 91.7% Comparison of efficiency based on different sources for front wheel drive The total transmission efficiency based on the literature survey: 92.5% for engine speed and engine torque at max power (89.1 kW). The efficiency based on Rototest data then is 0.8% lower than the literature alternative. Light vehicles with front wheel drive The gear box and the final gear box constitute one unit. Mechanical losses: two pair of gear wheel in all gear positions and parallel axles; this should result in a general efficiency of 96%. Lubricant churning losses The model for this type of losses is based on the literature survey including contacts with a car manufacturer:. 2. The base function was valid for a car with a 78 kW engine. The asumption is that churning losses have a linear dependence of engine rated power.. 36. VTI notat 7A-2010.
(39) PVBX=PVX=(PMrat/127000)*(11.25*NR+0.131256*NR2) PVBX: total churning losses in the transmission. (W) Total transmission efficiency Estimated total efficiency based on Rototest data in the whole transmission at max power, 90.6 %. Comparison of efficiency based on different sources for front wheel drive The total transmission efficiency based on the literature survey: 94.5% for engine speed and engine torque at max power (89.1 kW). Thus, the efficiency based on Rototest data is 3.9% lower than the literature alternative. Additional comments, a mix of hypothesis and facts, about transmission losses in general: • the churning losses should be dependent of the number of gear wheels, the size of the gear wheels and the rotation speed of each gear wheel • the mechanical losses should be dependent of the gear ratio. The developed model just describes some of these conditions: • the rotation speed of gear wheel to some extent • the number of gear wheels involved.. 6.3. Engine friction. Fuel consumption should be described as a function of the indicated engine effect PIND. In order to estimate PIND one needs to estimate PFR. The internal engine friction could be expressed like in Egnell (2005): PFR = (FMEP x 4 x CVcyl x Nrs / 2 ) x NC FMEP: average internal friction pressure (Pa) CVcyl: displacement per cylinder (m3) NC: number of cylinders There are different expressions for FMEP available. FMEP for diesel engines is expected to be higher compared to Otto engines. Otto engines Based on Hammarström and Karlsson (1987): PFR=(NC*CVcyl*10-3/2.3)*(-178.2+34.1*NRs+3.73*NRs2)….(W). VTI notat 7A-2010. 37.
(40) Based on Heywood (1988): FMEP = 105*(0.97+0.15*(NRs*60/103)+0.05*(NRs*60/103)2) PFR=(0.97*NRs+0,15*NRs2*(60/103)+0,05*NRs3*(60/103)2)*4* (CVcyl/2)*102..(W) Diesel engines Based on Heywood (1988): FMEP=(C1+48*(NRs*60/1000)+0.4*(Sp)2) * 103 Sp=2*L*NRs… (m/s) Sp: mean piston speed (m/s) L: stroke (m) CVcyl=L*3.14*(B/2)2 (m3) B: bore (m) If: B=L CV=NC*3.14*L3/4 CV : swept volume for the engine (m3) L=(4*CV/(NC*3.14))1/3 Sp=2*(4*CV/(NC*3.14))1/3*NRs FMEP=(C1+48*(NRs/1000)+0.4*(2 *(4*CVcyl/3.14)1/3* NRs)2)*103 PFR=FMEP*NC*CVcyl*NRs/2 = =(C1*NRs+48*(NRs2*60/1000)+0.4*NRs3*(2*(4*(CVcyl/1000)/(3.14))1/3)2) *(NC*CVcyl/2)*103 (the alternative used for analysis). 38. VTI notat 7A-2010.
(41) Alternatively: PFR=( C1*NRs+48*(NRs2*60/1000)+0.4*NRs3*(2*L)2)*( NC*CVcyl/2)*103 C1: parameter depending on type of injection and stroke…(kPa) Estimated function for C1 (direct injection): 3 C1=98+(L-0,0953)*(75-98)/(0.142-0.0953)….(kPa) PFR is used for two purposes: • estimation of indicated torque (Mind) • estimation of the engine brake torque (Mfr). PFR has been expressed being independent of engine load, which is a simplified description.. 6.4. Engine displacement. In order to estimate PFR one needs information about engine displacement. In Rototest data this information is included. If engine displacement not is available one can estimate it based on other data (Hammarström and Yahya, 2006), see below. Petrol engines: CV=(598.528-0.307*yearmodel-13,228*ln(PMrat*10-3/M))*PMrat/109...(m3) P: power (kW) M: vehicle weight without load (kg) If year model<1976 then year model=1976 and if year model>2004 then year model=2004. Diesel engines: CV=(-1005,284+0,494*yearmodel)*(1+0.812*ln(Pmrat*10-3/M))*PMrat/109…(m3) If year model<1976 then year model=1976 and if year model>2004 then year model=2004. 3. Based on data in Heywood (1988) p. 722–724).. VTI notat 7A-2010. 39.
(42) 6.5. Parameter estimation in engine map functions. 6.5.1. General. The estimations include two functions, one for Fcn and one for Mindn. The Fcn function: Fcn=c0*(Mindn+c1*Mindn2+c2*Mindn3)*(NRs+c3*NRs2+c4*NRs3) There are two alternative expressions of Mindn • with known parameter values for transmission losses and engine friction • with unknown parameter values for transmission losses and engine friction. One main problem with Rototest data for engine map estimation is transmission losses. These losses are depending on: • engine orientation, transverse or longitudinal • rear or front wheel drive • type of gear box • number of gear positions • gear position. In table 4.8 the distribution of measuring points on these variables are presented. In order not to have a negative influence from the transmission efficiency, just use one transmission group: front wheel drive, transverse engine and five gear positions. Petrol engines are also split after year model: ≤1999, >2000 and all. Diesel engines will be analyzed as one group depending of few observations. Data set for analyze: • Petrol: 242 vehicles and 3586 measuring points Diesel: 13 vehicles and 196 measuring points. 6.5.2. Estimation of all parameter values in Mindn. In this case no values are assigned for the parameters used to estimate engine friction and transmission losses. If the adjustment of the function to Rototest data would be successful the result would include terms possible to identify booth for PFR and PVBX in parallel to the engine map function: Mindn=((Mdriv/(VGVBX/100)+CVdm*(a1/UVVX+a2*NRs/(UVVX**2)+a3*NRs+a4* NRs**2))/(PMrat/1000)) In this function a1/(UVVX/100)+a2*NRs/(UVVX2) represents the churning losses in the final step of the transmission. The sum a3*NRs+a4*NRs2 represents the sum of the first step in the transmission and PFR. In the expression for Mindn, the “drive wheel torque” Mdriv is divided by VGVBX/100. The parameter estimation method can not handle estimations of parameters if all terms have unknown parameters. The alternative to assign VGVBX a value directly has been 40. VTI notat 7A-2010.
(43) chosen. This value for VGVBX should then be used for simulation using estimated engine maps. Let VGVBX=96. One possibility with this alternative could be to compare c0-c4 estimated without unknown a1-a4. If c0-c4 would be approximately equal between the two alternatives the conclusion would be that used models including assigned values for PFR and transmission losses would be representative. 6.5.3. All parameter values in Mindn as input. If there would be assigned parameter values in Mindn that are not representative, this will cause that estimated parameter values in Fcn, c0-c4, will not be representative. Two alternative engine friction functions are available for petrol and one for diesel engines. Parameter estimations in Fcn have been performed for these alternatives. Estimate c0 – c4 in: Fcn=c0*(Mindn+c1*Mindn2+c2*Mindn3)*(NRs+c3*NRs2+c4*NRs3) Mindn=(((PMdriv/(VGVBX/100)+PVBX)+ PFR)/ (NRs*6,28))/P301 Split of the analysis for different expressions of PFR: • petrol: based on Hammarström and Karlsson (1987) and Heywood (1988) respectively • diesel: based on Hammarström and Karlsson (1987) and Heywood (1988) respectively. 6.5.4. Statistics for control. From the manufacturer there is measuring data from two test points and from Rototest up to 19 test points. In Appendix 4 average values per test point are presented: • Rototest, 5 test points at 80 and 100 % engine load respectively: o measured: number of observations; power; CVdm; engine speed; UVVX; Fcn; and Mdrivn o calculated: Mindn and Mn • manufacturer, 2 test points: o measured: power; CVdm; engine speed; Mn o calculated: Mindn Since the number of observations might vary between test points for example constants like CVdm can vary as well. The average values per test point both give an overview of data and a possibility for control of calculated: PFR, PIND, PVBX and VGVX. If the estimation of transmission losses is representative the sum of these losses and max. VTI notat 7A-2010. 41.
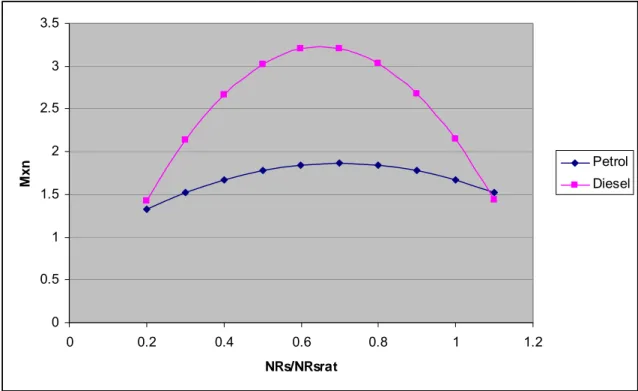
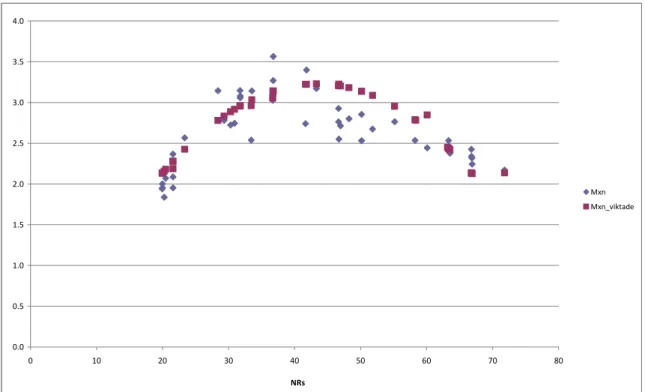
(44) power at drive wheels should be equal to max power presented by the manufacturer. However, differences are expected depending on: • that the data sets are not exactly the same • that engine speeds at max power are not exactly the same. The estimated normalized engine torque based on Rototest data is somewhat below the manufacturer data. Especially engine speed for max torque is different. Rototest speed is higher than manufacturer speed in average. For diesel engines there are some most different TVP301 and CVdm values compared to surrounding values. This is explained by few observations.. 6.6. Engine map crankshaft torque limits. 6.6.1. Engine speed at max engine power, initial estimation. In order to use the max load function there is a need to estimate NRsrat. NRsrat=(P302/60) NRsrat: engine speed at max engine power…(rps) PMrat=1000*P301 Estimation of parameters in function for NRsrat: NRsrat= a+b*PMrat/1000 alternatively NRsrat=a+b*CVdm Estimate a, b and r2 based on data for front wheel drive and manual gear boxes with five positions. 4 6.6.2. Engine min torque curve. In order to use an engine map there is need for one max and one min torque curve representing the upper and the lower limits of the engine map. 4. An alternative proposal for estimation of NRsrat:. NRsrat = PMrat /(6.28 * MXrat) = PMrat / (6.28 * (a+b*CVdm+c*CVdm2)). 42. VTI notat 7A-2010.
Figure
+7


Related documents
The basic design concept was to design a small deflector that fits over the injector nozzle and into the engine block that diverts the spray towards the exhaust port.. Referring
Engine efficiency based on fuel flows and brake torque was within 26 - 40 % at different engine speeds and torque levels, which was lower than the same engine running with
The eXtreme high Pressure fuel-Injection system (XPI) used on Scania busses and trucks is a sophisticated system that injects fuel into the cylinders with exceptional
Figure 4.3: The difference in instantaneous fuel consumption using two different estimation methods in stars, using steady state engine maps and compensating for the transient
Sammanfattningsvis signalerade Hendrix’ klädsel främst förankring i den vita hippiekulturen, medan hans scenframträdandes visuella uttryck mycket tydligt band samman honom
ANOVAn visade en tendens till signifikant interaktionseffekt för variablerna alkohol och nedstämdhet vad gäller social ångest hos tjejer (F(1, 164)=2,60, p=,108), där de tjejer
I denna studie har vi utgått från kunskaper och problematik som vi utvecklat genom analys av projekt och lärdomar i Innovationslabbet för eHälsa. I projekten har många olika
The thesis proposes ways to increase eParticipation in authoritarian contexts, citing the social accountability sector (where the thesis shows evidence of eParticipation working) as
