http://www.diva-portal.org
Preprint
This is the submitted version of a paper published in Empirical Software Engineering.
Citation for the original published paper (version of record):
Afzal, W., Ghazi, A., Itkonen, J., Torkar, R., Andrews, A. et al. (2015)
An experiment on the effectiveness and efficiency of exploratory testing.
Empirical Software Engineering, 20(3): 844-878
http://dx.doi.org/10.1007/s10664-014-9301-4
Access to the published version may require subscription.
N.B. When citing this work, cite the original published paper.
Permanent link to this version:
Noname manuscript No. (will be inserted by the editor)
An Experiment on the Effectiveness and Efficiency of Exploratory
Testing
Wasif Afzal · Ahmad Nauman Ghazi · Juha Itkonen · Richard Torkar · Anneliese Andrews · Khurram Bhatti
Received: date / Accepted: date
Abstract The exploratory testing (ET) approach is commonly applied in industry, but lacks scientific research. The scientific community needs quantitative results on the performance of ET taken from realistic experimental settings. The objective of this paper is to quantify the effectiveness and efficiency of ET vs. testing with documented test cases (test case based testing, TCT). We performed four controlled experiments where a total of 24 practitioners and 46 students performed manual functional testing using ET and TCT. We measured the number of identified defects in the 90-minute testing sessions of testing, the detection difficulty, severity and types of the detected defects, and the number of false defect reports. The results show that ET found a significantly greater number of defects. ET also found significantly more defects of varying levels of difficulty, types and severity levels. The two testing approaches, however, did not differ significantly in terms of the number of false defect reports submitted. We conclude that ET was more efficient than TCT in our experiment. ET was also more effective than TCT when detection difficulty, type of defects and severity levels are considered. However, the two approaches are comparable when it comes to the number of false defect reports submitted.
1 Introduction
Software testing is an important activity to improve software quality. However it is well known that it is costly (Yang et al, 2008; Bertolino, 2008). Thus, there has always been a need to increase the efficiency
Wasif Afzal
School of Innovation, Design and Engineering, M¨alardalen University,
Tel.: +46-700-266501 E-mail: wasif.afzal@mdh.se
Ahmad Nauman Ghazi and Khurram Bhatti Blekinge Institute of Technology
SE-37179, Karlskrona, Sweden. E-mail: nauman.ghazi@bth.se Juha Itkonen
Department of Computer Science and Engineering Aalto University
Finland
E-mail: juha.itkonen@aalto.fi Richard Torkar
Department of Computer Science and Engineering
Chalmers University of Technology | University of Gothenburg Sweden. E-mail: richard.torkar@chalmers.se Anneliese Andrews University of Denver, USA . E-mail: andrews@cs.du.edu
of testing while, in parallel, making it more effective in terms of finding defects. A number of testing techniques have been developed to enhance the effectiveness and efficiency of software testing, see Juristo et al. (Juristo et al, 2004) where they present a review and classification of different testing techniques. According to SWEBOK (Abran et al, 2004), the many proposed testing techniques differ essentially in how they select the test set for achieving the test adequacy criterion.
Due to high costs of testing software, a lot of research has focussed on automated software testing. Automated software testing should ideally automate multiple activities in the test process, such as the generation of test requirements, test case generation, test oracle generation, test case selection or test case prioritization (Ali et al, 2010). The main reason for automation is to have improved test efficiency, especially in regression testing where test cases are to be executed iteratively after making changes to the software (Dustin et al, 1999). But, as Bertolino (Bertolino, 2007) argues, 100% automatic testing is still a dream for software testing research and practice. The software industry today still relies heavily on manual software testing (Berner et al, 2005; Andersson and Runeson, 2002; Hartman, 2002) where the skills of professional testers and application domain experts are used to identify software defects. Our focus in this paper is on manual software testing as opposed to automated software testing.
The traditional and common approach to software testing is to define and plan test cases prior to execution and then compare their outputs to the documented expected results. Such a document-driven and a pre-planned approach to testing is called as test case based testing (TCT). The test cases are documented with test inputs, expected outputs and the steps to test a function (Itkonen et al, 2009; Agruss and Johnson, 2000; Andersson and Runeson, 2002). The major emphasis of TCT remains on detailed documentation of test cases to verify correct implementation of a functional specification (Abran et al, 2004). The test adequacy criterion is thus the coverage of requirements. There are undoubtedly certain strengths with the TCT approach. It provides explicit expected outputs for the testers and handles complex relationships in the functionality systematically (Itkonen et al, 2007; Ahonen et al, 2004; Itkonen, 2008; Ryber, 2007; Grechanik et al, 2009; Yamaura, 2002; Taipale et al, 2006). The test case documentation can also provide benefits later in the regression testing reuse. However, in this paper we focus on the actual testing activity and defect detection scoping other potential benefits out of this study.
As opposed to TCT, exploratory testing (ET) is an approach to test software without pre-designed test cases. ET is parallel learning, test design and test execution (van Veenendaal et al, 2002; Kaner et al, 2008). In ET, the tester has the freedom to explore the software and design new tests based on personal experience during test execution. The tests are, thus, dynamically designed, executed and modified (Abran et al, 2004). It is believed that ET is largely dependent on the skills, experience and intuition of the tester. Central to the concept of ET is simultaneous/continuous learning where the tester uses the information gained while testing to design new and better tests. That is why ET is typically defined as simultaneous learning, test design and test execution (Bach, 2003). ET does not assume any prior application domain knowledge at tester’s end1 but expects a tester to be knowledgeable in test techniques (e.g., boundary value analysis) and to be able to use the accumulated knowledge about where to look for defects. This is further clarified by Whittaker (Whittaker, 2010): “Strategy-based exploratory testing takes all those written techniques (like boundary value analysis or combinatorial testing) and unwritten instinct (like the fact that exception handlers tend to be buggy) and uses this information to guide the hand of the tester. [. . .] The strategies are based on accumulated knowledge about where bugs hide, how to combine inputs and data, and which code paths commonly break.”
In one sense, ET reflects a complete shift in the testing approach, where test execution is based on tester’s current and improving understanding of the system. This understanding of the system is derived from various sources: observed product behavior during testing, familiarity with the application, the platform, the failure process, the type of possible faults and failures, the risk associated with a particular product, and so on (Kaner et al, 2008). Although the term exploratory testing was first coined by Kaner and Bach in 1983, Myers acknowledged experience-based approaches to testing in 1979 (Myers et al, 2012). However, the actual process to perform ET is not described by Myers. Instead, it was treated as an ad-hoc or error guessing technique.
Over the years, ET has evolved into a thoughtful approach to manual testing. ET is now seen in in-dustry as an approach whereby different testing techniques can be applied. In addition, some approaches, such as session-based test management (SBTM), have been developed to manage the ET process (Bach,
2000). Finally, ET has also been proposed to provide certain advantages for the industry (van Veenen-daal et al, 2002; Naseer and Zulfiqar, 2010; Bach, 2000; Itkonen and Rautiainen, 2005; Kaner et al, 2008; Lyndsay and van Eeden, 2003; V˚aga and Amland, 2002) such as defect detection effectiveness as well as better utilization of testers’ skills, knowledge and creativity. The applicability of the ET approach has not been studied in research literature. The ET approach, despite its claimed benefits, has poten-tial limitations in certain contexts: when precise repeatability for regression testing is required or when experienced or knowledgeable testers are not available.
There have only been a few empirical studies on the performance of ET or similar approaches, see (F. Houdek, 2002; do Nascimento and Machado, 2007; Itkonen et al, 2007; Bhatti and Ghazi, 2010). In these studies, ET has been reported as being more efficient than traditional TCT. However, as the the empirical research on ET is still rare, there is a need to do more controlled empirical studies on the effectiveness and efficiency of ET to confirm and extend the existing results. This scarcity of research on ET is surprising considering the common notion that test execution results depend on the skills of testers (Juristo et al, 2004). Generally there has been little empirical investigation on test execution practices and manual testing. Little is known regarding what factors affect manual testing efficiency or the practices that are considered useful by industrial testers (Juristo et al, 2004; Itkonen et al, 2007).
Itkonen et al. (Itkonen et al, 2007) compared ET and TCT approaches using time-boxed test exe-cution sessions in a controlled student experiment, where the test exeexe-cution time was equal among the approaches. They reported higher numbers of detected defects and lower total effort for the ET approach, even though there was no statistically significant difference in defect detection effectiveness between the ET and TCT approaches. Further, the detected defects did not differ significantly with respect to their types, detection difficulty or severity. In the experiment of Itkonen et al. the TCT approach also produced more false defect reports than ET (Itkonen et al, 2007). This study extends the experiment of Itkonen et al. by including both student and industry professionals as subjects and setting an equal total time among the approaches.
In order to advance our knowledge regarding ET and to further validate the claims regarding its effectiveness and efficiency, we have conducted an experiment to answer the following main research question (RQ):
RQ: Do testers, who are performing functional testing using the ET approach, find more or different defects compared to testers using the TCT approach?
Our main RQ is further divided into three research questions that are given in Section 3.2.
In functional testing, functions or components are tested by feeding them input data and examin-ing the output against the specification or design documents. The internal program structure is rarely considered during functional testing.
In this paper, we use the term defect to refer to an incorrect behavior of a software system that a tester reports, based on an externally observable failure that occurs during the testing. Our experiment only focuses on testing activity and, thus, excludes debugging and identifying the location of actual faults. We also need to make a distinction from pure failure counts, because our analysis does not include repeated failures occurring during the same testing session caused by a single fault.
In summary, the results of our study show that ET found a significantly greater number of defects in comparison with TCT. ET also found significantly more defects of varying levels of detection difficulty, types and severity levels. On the other hand, the two testing approaches did not differ significantly in terms of number of false defect reports submitted.
The rest of the paper is structured as follows. Section 2 presents the existing research on ET and TCT. Section 3 presents the research methodology, the experiment design, data collection and analysis. The results from the experiment are presented in Section 4. Answers to the research questions are discussed in Section 5. The threats to validity are covered in Section 6. Finally, in Section 7, conclusions and future research directions are presented.
2 Related work
A review of experiments on testing techniques is given by Juristo et al. (Juristo et al, 2004)2. This review concludes that there is no single testing technique that can be accepted as a fact as they all are pending some sort of corroboration such as laboratory or field replication or knowledge pending formal analysis. Moreover, for functional and control flow testing technique families a practical recommendation is that more defects are detected by combining individual testers than techniques of the two families. This is important because, in one way, it shows that the results of test execution depend on the tester’s skills and knowledge, even in test case based testing. There is some evidence to support this argument. Kamsties and Lott found that the time taken to find a defect was dependent on the subject (Kamsties and Lott, 1995). Wood et al. (Wood et al, 1997) found that combined pairs and triplets of individual testers using the same technique found more defects than individuals. There are many possible reasons for the variation in the results. Individual testers might execute the documented tests differently; the testers’ ability to recognize failures might be different; or individual testers might end up with different tests even though they are using the same test case design technique. The important role of personal experience in software testing has been reported in testing research. Beer and Ramler (Beer and Ramler, 2008) studied the role of experience in testing by industrial case studies. In addition, Kettunen et al. (Kettunen et al, 2010) recognized the importance of testers’ experience, Poon et al. (Poon et al, 2011) studied the effect of experience on test case design and Galletta et al. (Galletta et al, 1993) report that expertise increases error finding performance.
ET, as described in Section 1, is an approach that does not rely on the documentation of test cases prior to test execution. It has been acknowledged in the literature that ET has lacked scientific research (Itkonen and Rautiainen, 2005). Later there have emerged a few studies. Nascimento et al. (do Nascimento and Machado, 2007) conducted an experiment to evaluate the use of model-based and ET approaches in the context of feature testing in mobile phone applications. They found that ET is better than model-based testing for functional testing and produced better results. The effort was clearly smaller when applying ET compared to the model-based approach.
Also in the context of verifying executable specifications Houdek et al. (F. Houdek, 2002) performed a student experiment comparing reviews, systematic testing techniques and the ad-hoc testing approach. The results indirectly support hypotheses regarding the efficiency of experience-based approaches showing that the ad-hoc approach required less effort, and that there was no difference between the techniques with respect to defect detection effectiveness. None of the studied techniques alone revealed a majority of the defects and only 44% of the defects were such that the same defect was found by more than one technique.
Research on the industrial practice of software testing is sparse. Some studies show that test cases are seldom rigorously used and documented. Instead, practitioners report that they find test cases difficult to design and, in some cases, even quite useless (Ahonen et al, 2004; Andersson and Runeson, 2002; Itkonen and Rautiainen, 2005). In practice, it seems that test case selection and design is often left to individual testers and the lack of structured test case design techniques is not found as a problem (Andersson and Runeson, 2002). Research on the ET approach in industry includes a case study (Itkonen and Rautiainen, 2005) and observation studies on testing practices (Itkonen et al, 2009) and on the role of knowledge (Itkonen et al, 2013), but to our knowledge the effectiveness and efficiency of ET has not been researched in any industrial context.
Even though the efficiency and applicability of ET lacks reliable research, there are anecdotal re-ports listing many benefits of this type of testing. The claimed benefits, as summarized in (Itkonen and Rautiainen, 2005), include effectiveness, the ability to utilize tester’s creativity and non-reliance on doc-umentation (van Veenendaal et al, 2002; Bach, 2000; Kaner et al, 2008; Lyndsay and van Eeden, 2003; V˚aga and Amland, 2002).
2 For recent reviews on software testing techniques, see (Jia and Harman, 2011; Ali et al, 2010; da Mota Silveira Neto
3 Methodology
This section describes the methodology followed in the study. First, the research goals along with research questions and hypotheses are described. After that a detailed description of the experimental design is presented.
3.1 Goal definition
The experiment was motivated by a need to further validate the claimed benefits of using ET. There are studies that report ET as being more efficient and effective in finding critical defects. As described in the previous section, it has been claimed that ET takes less effort and utilizes the skill, knowledge and experience of the tester in a better way. However, more empirical research and reliable results are needed in order to better understand the potential benefits of the ET approach.
In this experiment we focus on the testing activity and the effects in terms of defect detection effectiveness. The high-level research problem is to investigate if the traditional testing approach with pre-design and documented test cases is beneficial or not in terms of defect detection effectiveness. This is an important question, despite of the other potential benefits of test documentation, because the rationale behind the traditional detailed test case documentation is to improve the defect detection capability (Goodenough and Gerhart, 1975; Myers et al, 2012).
According to Wohlin et al. (Wohlin et al, 2000), a goal-definition template (identifying the object(s), goal(s), quality focus and the perspective of the study) ensures that important aspects of an experiment are defined before the planning and execution:
– Objects of study: The two testing approaches, i.e., ET and TCT.
– Purpose: To compare the two testing approaches in fixed length testing sessions in terms of number of found defects, defect types, defect severity levels, defect detection difficulty, and the number of false defect reports.
– Quality focus: Defect detection efficiency and the effectiveness of the two testing approaches. – Perspective: The experimental results are interpreted from a tester’s and a researcher’s point of
view.
– Context: The experiment is run with industry practitioners and students as subjects performing functional testing at system level.
In this context it might be worthwhile to clarify the words effectiveness and efficiency and how these words are used in the context of this experiment. By effectiveness we mean the fault finding performance of a technique, i.e., the number of faults a technique finds. If we also add a measure of effort, i.e., the time it takes to find these faults, then we use the word efficiency.
3.2 Research questions and hypotheses formulation
Our main RQ was given in Section 1. In order to answer our main RQ, a number of sub-RQs are pro-posed, along with their associated hypotheses:
RQ 1: How do the ET and TCT testing approaches compare with respect to the number of defects detected in a given time?
Null Hypothesis H0.1: There is no difference in the number of detected defects between ET and TCT approaches.
Alternate Hypothesis H1.1: There is a difference in the number of detected defects between ET and TCT approaches.
RQ 2: How do the ET and TCT testing approaches compare with respect to defect detection diffi-culty, types of identified defects and defect severity levels?
Null Hypothesis H0.2.1: There is no difference in the defect detection difficulty when using ET and TCT approaches.
Alternate Hypothesis H1.2.1: There is a difference in the defect detection difficulty when using ET and TCT
ap-proaches.
Table 1 The division of subjects in experimental iterations and groups.
Iteration Type Total subjects ET TCT
1 Academia 46 23 23
2 Industrial 3 1 2
3 Industrial 8 4 4
4 Industrial 13 7 6
Alternate Hypothesis H1.2.2: There is a difference in the technical type of defects detected using ET and TCT
ap-proaches.
Null Hypothesis H0.2.3: There is no difference in the severity of defects detected using ET and TCT approaches.
Alternate Hypothesis H1.2.3: There is a difference in the severity of defects detected using ET and TCT approaches.
RQ 3: How do the ET and TCT testing approaches compare in terms of number of false defect reports?
Null Hypothesis H0.3: There is no difference in the number of false defect reports when using ET and TCT testing
approaches.
Alternate Hypothesis H1.3: There is a difference in the number of false defect reports when using ET and TCT
testing approaches.
To answer the research questions and to test our stated hypotheses, we used a controlled experiment. In the experimental design we followed the recommendations for experimental studies by (Wohlin et al, 2000; Juristo and Moreno, 2001; Kitchenham et al, 2002).
3.3 Selection of subjects
The subjects in our study were industry practitioners and students. There were three industry partners, two located in Europe and one in Asia. The subjects were selected using a convenience sampling based on accessibility. The subjects from the industry had experience in working with software testing. Still, they were provided with material on the test case design techniques. In academia, the students of an MSc course in software verification and validation took part in the experiment. They learnt different test case design techniques in the course. Moreover, the students were selected based on their performance, i.e., only students performing well in their course assignments were selected. The assignments in the course were marked according to a pre-designed template where a student got marks based on a variety of learning criteria. The final marks on an assignment reflected the aggregate of each of the individual criterion. Out of a total of 70 students, 46 were ultimately selected for the experiment, i.e., top-65%. This selection of top-65% of the students was done before the execution of the experiment, i.e., we did not gather any data from the bottom 35% of the students as they were excluded from the very start.
The total number of subjects who participated in this experiment was 70. Among them there were a total of 24 participants from industry and 46 from academia. The subjects were divided into two groups. The groups are referred to as the ET group and the TCT group, based on the approach they used to test the feature set (experimental object). The approach to be used by each of the two groups (either ET or TCT) was only disclosed to them once they had started their sessions. There were a total of 35 participants in each of the two groups for the four experimental iterations. (The division of subjects in experimental iterations and groups is shown in Table 1.)
Further, the following aspects were considered for people participating as subjects (Wohlin et al, 2000) .
– Obtain consent : To reduce the risk of invalid data and to enable the subjects to perform the experiment according to the objectives, the intention of the work and the research objectives were explained to all subjects (through a meeting in the industry and a presentation to students). It was made clear how the results would be used and published.
– Sensitive results: The subjects were assured that their performance in the experiment would be kept confidential.
– Inducements: To increase motivation, extra course points were awarded to the students participating in the experiment, but participation was not made compulsory. The industry practitioners were
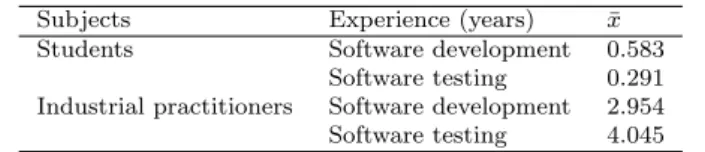
Table 2 Average experience of subjects in software development and software testing in number of years.
Subjects Experience (years) ¯x
Students Software development 0.583
Software testing 0.291 Industrial practitioners Software development 2.954 Software testing 4.045
motivated by the prospects of getting important feedback on the performance of the two testing approaches.
To characterize the subjects, demographic data was collected in terms of experience in software development and software testing. The demographic data of the subjects is given in Table 2. On average, the industrial practitioners were more experienced in software development and software testing than the students, which was expected. However, the students were, on the other hand, knowledgeable in the use of various testing techniques that were taught during the course software verification and validation.
3.4 Experiment design
The experimental design of this study is based on one factor with two treatments. The factor in our experiment is the testing approach while the treatments are ET and TCT. There are two response variables of interest: defect detection efficiency and defect detection effectiveness.
The experiment was comprised of two separate sessions, one each for the ET and TCT group. In the testing session phase, the TCT group designed and executed the test cases for the feature set. The subjects did not design any test cases before the testing session. The rationale was to measure the efficiency in terms of time to complete all required activities. At the start of the session, the TCT group was provided with a template, both for designing the test cases and for reporting the defects. The ET group was instructed to log their session activity as per their own understanding but in a readable format. Both groups were given the same materials and information regarding the tested application and its features. Also both TCT and ET groups were provided with the same jEdit user’s guide for finding the expected outputs. The subjects in TCT group designed their test cases themselves, no existing test cases were provided for them.
All subjects were instructed to apply the same detailed test design techniques: equivalence partition-ing, boundary value analysis and combination testing techniques. The same techniques were applied for test case designing in TCT as well as for testing in ET. Same techniques were applied both with the industry and student subjects. This information was communicated to them prior to the experiment.
Each session started with a 15-minute ‘session startup’ phase where the subjects were introduced with the objective of the experiment and were given the guidelines on how to conduct the experiment. The actual testing was done in a 90 min time-boxed session3. The defect reports and the test logs were
then handed over for evaluation. The following artifacts were provided in the testing session: – Session instructions.
– A copy of the relevant chapters of the jEdit user’s guide. – Defect reporting document (TCT only).
– Test case design document (TCT only). – A test charter and logging document for ET. – Test data files that are available in the test sessions:
– A small text file.
– GNU general public license text file. – jEdit user’s guide as a text file. – Ant build.xml file.
– Java source code files from jEdit. – C++ source code files from WinMerge4.
3 The 90 minutes session length was decided as suggested by Bach (Bach, 2000) but is not a strict requirement (we were
constrained by the limited time available for the experiments from our industrial and academic subjects.)
4 The C++ source code files were given to the subjects as an example to see code formatting and indentation. The
The following artifacts were required to be submitted by the subjects: – Defect reports in a text document.
– The test cases and the test log (TCT only). – The filled ET logging document (ET only). – Test case design document (TCT only).
The concept of tracking the test activity in sessions is taken from Bach’s approach of session-based test management (SBTM) (Bach, 2000). SBTM was introduced to better organize ET by generating orderly reports and keeping track of tester’s progress supported by a tool. Testing is done in time-limited sessions with each session having a mission or charter. The sessions are debriefed with the test lead accepting a session report and providing feedback. The session report is stored in a repository whereby a tool scans it for getting basic metrics, like time spent on various test activities and testing progress over time in terms of completed sessions.
3.5 Instrumentation
The experimental object we used in this study was the same as used by Itkonen et al. (Itkonen et al, 2007). It is an open source text editor5. Artificial faults were seeded in the application at the source code level to make two variants and then recompiled. The variant that we used is referred to as Feature Set-A in the experiment by Itkonen et al. (Itkonen et al, 2007). This variant contained a total of 25 seeded faults. The actual number of faults exceeds the number of seeded faults. The choice to use a text editor was made because editors are familiar to the subjects without requiring any training (Itkonen et al, 2007), and it represents a realistic application. In addition, being open source it was possible to seed faults in the application code. The experimental object was only available to the subjects once the functional testing phase was started.
In addition to the test object feature set, we used the following instrumentation, with required modifications: user guide and instructions; test case design template (Appendix A); defect report template (Appendix B); exploratory charter6(Appendix C); and feature set defects details.
The Feature Set-A was composed of first and second priority functions: – First priority functions
– Working with files (User’s guide chapter 4) • Creating new files.
• Opening files (excluding CZipped files). • Saving files.
• Closing files and exiting jEdit. – Editing text (User’s guide chapter 5)
• Moving the caret. • Selecting text.
· Range selection. · Rectangular selection. · Multiple selection. • Inserting and Deleting text. – Second priority functions
– Editing text (User’s guide chapter 5) • Working with words.
· What is a word? • Working with lines. • Working with paragraphs. • Wrapping long lines.
· Soft wrap. · Hard wrap.
5 jEdit version 4.2
Table 3 Defect count data summary.
Testing approach defects found (Mean (¯x))
ET 8.342
TCT 1.828
3.6 Operation
The user guide and the instructions for testing the application were provided to the subjects one day before the experiment execution. The task of the subjects was to cover all functionality documented in the user’s guide concerning Feature Set-A. One subject participated only in one allocated session, i.e., either ET or TCT.
At the start of the testing session, subjects were provided with instructions. The instructions contained details on session arrangement and the focus of the testing session. The TCT group received the template for test case design and reporting defects. The ET group got a vague charter listing the functionality to be tested and an emphasis on testing from user’s viewpoint. Both ET and TCT groups performed the test execution manually.
We executed a total of four experiment iterations, i.e., four instances of the experiment conducted with different subjects under similar experimental setting. Three of these iterations were done in industry (two in Europe and one in Asia) while one of the iterations were done in academia. For each experiment iteration, the ET and TCT groups performed the sessions at the same time (they were located in identical locations but in different rooms).
To provide an identical experimental environment, i.e., testing tools and operating system (OS), each subject connected to a remote Windows XP image. The OS image was preloaded with the experimental object in complete isolation from the Internet. To collect data from this experiment, the logs and defect report forms were filled out by the subjects during the testing session. After the data was collected, it was checked for correctness and the subjects were consulted when necessary.
The experimental design of this study was similar to the earlier experiment by Itkonen et al. (Itkonen et al, 2007) and used the same software under test, including the same seeded and actual faults. There are, however, three important differences in the experimental design between the two experiments. First, this study employed only one test session per subject with the purpose of reducing the learning effect of the subjects. We tried to avoid the learning effect because we believed that we would measure the true effect of a particular treatment more accurately. Each subject carried out the experiment one time only using their assigned testing approach. Second, in this experiment the total time provided to both approaches was the same, whereas in Itkonen et al.’s earlier experiment the test case design effort was not part of the time-boxed testing sessions. Both approaches were allocated 90 minutes to carry out all activities involved in their approach. This way we were, in addition, able to measure the efficiency in terms of number of defects found in a given time. Third, the experimental settings were, of course, different. This experiment was executed both in industry and academia, whereas Itkonen et al.’s study (Itkonen et al, 2007) used student subjects only.
4 Results and analysis
This section presents the experimental results based on the statistical analysis of the data.
4.1 Defect count
The defect count included all those reported defects that the researchers were able to interpret, under-stand and reproduce (i.e., true defects). A false defect (duplicate, non-reproducible, non-underunder-standable) was not included in the defect count. The details of false defects are described in Section 4.3. The de-fect counts are summarized in Table 3. The table lists the dede-fect counts separately for both testing approaches.
The mean defect counts for the ET and TCT approaches are 8.342 and 1.828 respectively; ET detected on average 6.514 more defects than TCT. The actual number of defects found by the two approaches was 292 (ET) vs. 64 (TCT). The number of defects detected by both groups were from a normal distribution
(confirmed by using the Shapiro-Wilks test for normality). Thus, the number of defects detected were compared using the t-test. Using the two-tailed t-test, we obtained p = 1.159 × 10⁻¹⁰, hence, the defects found using the two approaches were statistically different at α = 0.05. The effect size calculated using Cohen’s d statistic also suggested practical significance, i.e., d = 2.0657.
For the number of defects detected in the given time, students found 172 true defects when using ET with a median of 68. Practitioners found 120 true defects when using ET with a median of 9. This shows
that for the number of students and practitioners applying ET, the practitioners found on average more defects than students. However, the difference is not statistically significant (p = 0.07) when applying the Mann-Whitney U test at α = 0.05 (the data had a non-normal distribution). (We also used the non-parametric Vargha and Delaney’s ˆA12 statistic to assess effect size. The statistic ˆA12 turned out
to be 0.31 which is a small effect size according to the guidelines of Vargha and Delaney (Vargha and Delaney, 2000)).
Students, when applying TCT, found a total of 33 true defects with a median of 1. Practitioners, on the other hand, found a total of 31 defects while applying TCT with a median of 2.5. This shows that practitioners found, on average, more true defects than students when using TCT. However, the difference is not statistically significant (p = 0.15, ˆA12= 0.35) when applying the Mann-Whitney U test
at α = 0.05 (the data had a non-normal distribution).
4.2 Detection difficulty, types and severity
The defect reports were classified into three dimensions (Itkonen et al, 2007): 1. Detection difficulty.
2. Technical type. 3. Severity.
We used the same measure for defect detection difficulty as Itkonen et al. used in their earlier exper-iment (Itkonen et al, 2007). The detection difficulty of a defect is defined by using the failure-triggering fault interaction9(FTFI) number. This number refers to the number of conditions required to trigger a
failure (Kuhn et al, 2004). The FTFI number is determined by observing the failure occurrence and ana-lyzing how many different inputs or actions are required in order to make the failure occur. For example, if triggering a failure requires the tester to set one input in the system to a specific value and executing a specific command, the FTFI number would be 2 (i.e., mode 2 defect). The detection difficulty of a defect in this study is characterized into four levels of increasing difficulty:
– Mode 0: A defect is immediately visible to the tester.
– Mode 1: A defect requires a single input to cause a failure (single-mode defect). – Mode 2: A defect requires a combination of two inputs to cause a failure.
– Mode 3: A defect requires a combination of three or more inputs to cause a failure.
To make testing more effective it is important to know which types of defects could be found in the software under test, and the relative frequency with which these defects have occurred in the past (Abran et al, 2004). IEEE standard 1044-2009 (IEEE 1044-2009, 2010) exists on classifying software defects but the standard only prescribes example defect types such as interface, logic and syntax while recommending organizations to define their own classifications; “the point is to establish a defect taxonomy that is meaningful to the organization and the software engineers” (Abran et al, 2004). For the purpose of this study, we have classified defects based on the externally visible symptoms, instead of the (source code level) technical fault type as is common in existing classifications, see, e.g., ODC (Chillarege et al, 1992). We believe that for comparing approaches for manual testing the defect symptoms is an important factor affecting defect detection. The defects were classified into following types based on the symptoms: performance, documentation, GUI, inconsistency, missing function, technical defect, usability and wrong
7 Cohen’s d shows the mean difference between the two groups in standard deviation units. The values for d are interpreted
differently for different research questions. However, we have followed a standard interpretation offered by Cohen (Cohen, 1988), where 0.8, 0.5 and 0.2 show large, moderate and small practical significances, respectively.
8 Median is a more close indication of true average than mean due to the presence of extreme values.
9 FTFI number is somewhat ambiguously named in the original article, since the metric is not about fault interactions,
Table 4 Description of the types of defects with examples.
Type Description Example
Documentation Defects in user manual Manual has wrong keyboard shortcut for inverting the selection in the selecting text chapter
GUI Defects in user interface, such as undesirable behavior in text and file selection, inappropri-ate error messages and missing menus
Uninformative error message when trying to save in an access restricted folder
Inconsistency Functions exhibiting inconsistent behavior Opening a new empty buffer is not possible when only one unmodified empty buffer exists
Missing function Defects due to missing functionality and in-compatibility issues
Shortcut problems with Finnish keyboard and Au-tosave does not automatically find the auAu-tosave file; prompting for recovery when jEdit is launched after crash
Performance Defects resulting in reduced performance of the system
Character input stops after writing few characters fast Technical defect Defects attributed to application crash,
tech-nical error message or runtime exception
While holding right arrow-key down an exception is thrown; Goto line crashes if large line number is pro-vided
Usability Defects resulting in undesirable usability issues Open dialog always opens to C: directory; Select lines accept invalid input without a warning message Wrong function Defects resulting in incorrect functionality An extra newline character is added at the end of the
file while saving; if a file created in another editor is opened the last character is missing
Table 5 Distribution of defects concerning detection difficulty.
Mode ET TCT ET % TCT % Total Mode 0 73 22 25% 35% 95 Mode 1 117 27 40% 44% 144 Mode 2 72 11 25% 18% 83 Mode 3 30 2 10% 3% 32 Total 292 62 100% 100% 354
function. The definition of each type of defect with examples appears in Table 4. The defect severity indicates the defect’s estimated impact on the end user, i.e., negligible, minor, normal, critical or severe. In all four modes of detection difficulty, ET found clearly more defects. The difference between the number of defects found in each difficulty level is, consequently, also statistically significant at α = 0.05 using the t-test (p = 0.021, d = 2.91).
In the percentage distribution presented in Table 5 we can see the differences between ET and TCT in terms of the detection difficulty. The data shows that for the defects that ET revealed, the proportion on defects that were difficult to detect was higher. In the defects revealed by TCT the proportion of the obvious and straightforward defects was higher.
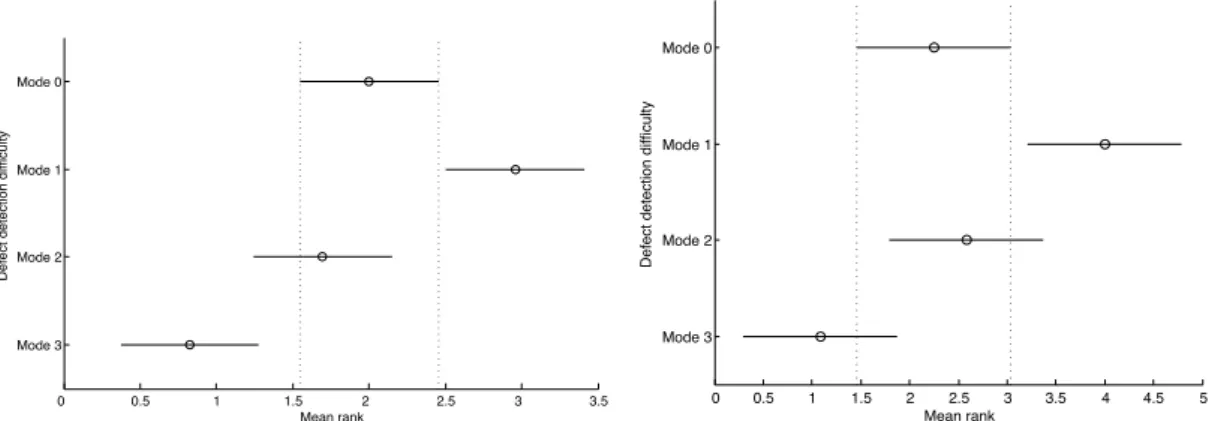
For students applying ET, the four modes of defect detection difficulty were significantly different using one-way analysis of variance (p = 4.5e − 7, α = 0.05).The effect size calculated using eta-squared (η2) also suggested practical significance, i.e., η2=0.3110. We performed a multiple-comparisons test
(Tuckey-Kramer, α = 0.05)11 to find out which pairs of modes are significantly different. The results
showed that mode 0 and 1 defects were significantly different from mode 3 defects (Fig. 1(a)). In the percentage distribution presented in Table 6 we can see the differences in the modes of defects detected by students using ET. The data indicates that students detected a greater percentage of easier defects (mode 0 and 1) as compared to difficult defects (mode 2 and 3).
For practitioners applying ET, the four modes of defect detection difficulty were also found to be significantly different using one-way analysis of variance (p = 1.8e − 4, η2=0.36). The results of a multiple comparisons test (Tuckey-Kramer, α = 0.05) showed that mode 0 defects were not significantly different from mode 3 defects while mode 1 defects were significantly different from mode 3 (Fig. 1(b)). In the
10 η2 is a commonly used effect size measure in analysis of variance and represents an estimate of the degree of the
association for the sample. We have followed the interpretation of Cohen (Cohen, 1988) for the significance of η2 where
0.0099 constitutes a small effect, 0.0588 a medium effect and 0.1379 a large effect.
11 The term mean rank is used in Tuckey-Kramer test for multiple comparisons. This test ranks the set of means in
ascending order to reduce possible comparisons to be tested, e.g., in the ranking of the means W >X >Y >Z, if there is no difference between the two means that have the largest difference (W & Z), comparing other means having smaller difference will be of no use as we will get the same conclusion.
0 0.5 1 1.5 2 2.5 3 3.5 Mode 3 Mode 2 Mode 1 Mode 0 Mean rank
Defect detection difficulty
(a) Multiple comparisons test for the different modes of defects detected by students applying ET.
0 0.5 1 1.5 2 2.5 3 3.5 4 4.5 5
Mode 3 Mode 2 Mode 1 Mode 0
Defect detection difficulty
Mean rank
(b) Multiple comparisons test for the different modes of defects detected by practitioners applying ET.
Fig. 1 Results of the multiple comparisons test for modes of defects detected by students and practitioners using ET (The vertical dotted lines indicate differences in mean ranks of different modes of defects, i.e., in Fig 1(a) above, the vertical dotted lines indicate Mode 1 and 3 have mean ranks significantly different from Mode 0.)
Table 6 Percentages of the modes of defects detected by students and practitioners applying ET. Mode Students Practitioners Students % Practitioners %
Mode 0 46 27 26.74% 22.69%
Mode 1 68 48 39.53% 40.34%
Mode 2 39 31 22.67% 26.05%
Mode 3 19 13 11.04% 10.92%
Table 7 Percentages of the different modes of defects detected by students and practitioners applying TCT. Mode Students Practitioners Students % Practitioners %
Mode 0 7 11 25.92% 45.83%
Mode 1 15 7 55.55% 29.17%
Mode 2 5 6 18.52% 25%
Mode 3 0 0 0.00% 0.00%
percentage distribution presented in Table 6 we can see a trend similar to when students applied ET, i.e., practitioners detected a greater percentage of easier defects (mode 0 and 1) as compared to difficult defects (mode 2 and 3).
We further applied the multivariate analysis of variance test for identifying any significant differences between students and practitioners for defect detection difficulty modes when using ET. The results given by four different multivariate tests indicate that there is no significant effect of the type of subjects (either students or practitioners) on the different modes of defects identified in total (p-value for Pillai’s trace, Wilks’ lambda, Hotelling’s trace, Roy’s largest root = 0.31, η2= 0.14, α = 0.05).
For students applying TCT, the four modes of defect detection difficulty were significantly different using one-way analysis of variance (p = 0.01, η2= 0.12, α = 0.05). The results of performing a multiple
comparisons test (Tuckey-Kramer, α = 0.05) showed that mode 0 and 2 defects were not significantly different from any other mode while mode 1 and 3 were found to be significantly different (Fig 2(a)). The percentage distribution of different modes of defects is presented in Table 7. It shows that no defect in mode 3 was detected by students applying TCT while majority of the defects found were comparatively easy to find (mode 0 and 1).
For practitioners applying TCT, there were no significant differences found between the different modes of defects detected using one-way analysis of variance (p = 0.15, η2 = 0.11, α = 0.05). The percentage distribution of different modes of defects detected by practitioners using TCT is given in Table 7. As was the case with students, practitioners also did not find any defects in mode 3 while majority of the defects found were easy (mode 0 and 1).
We further applied the multivariate analysis of variance test for identifying any significant differences between students and practitioners for defect detection difficulty modes of defects when using TCT. The results given by four different multivariate tests indicate that there is no significant effect of the type of
−0.4 −0.2 0 0.2 0.4 0.6 0.8 1 Mode 3 Mode 2 Mode 1 Mode 0 Mean rank
Defect detection difficulty
(a) Multiple comparisons test for the different modes of defects detected by students applying TCT.
Fig. 2 Results of the multiple comparisons test for different modes of defects detected by students using TCT. (The vertical dotted lines indicate differences in mean ranks of different modes of defects, i.e., in Fig 2(a) above, the vertical dotted lines indicate that mode 0 defects have mean rank significantly different from none other.)
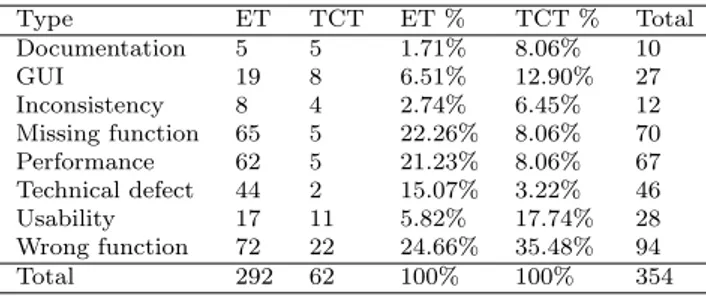
Table 8 Distribution of defects regarding technical type.
Type ET TCT ET % TCT % Total Documentation 5 5 1.71% 8.06% 10 GUI 19 8 6.51% 12.90% 27 Inconsistency 8 4 2.74% 6.45% 12 Missing function 65 5 22.26% 8.06% 70 Performance 62 5 21.23% 8.06% 67 Technical defect 44 2 15.07% 3.22% 46 Usability 17 11 5.82% 17.74% 28 Wrong function 72 22 24.66% 35.48% 94 Total 292 62 100% 100% 354
subjects (either students or practitioners) on the different modes of defects identified in total (p-value for Pillai’s trace, Wilks’ lambda, Hotelling’s trace, Roy’s largest root = 0.27, η2= 0.12, α = 0.05).
Table 8 show the categorization of the defects based on their technical type. The ET approach revealed more defects in each defect type category in comparison to TCT (the exception being the ‘documentation’ type where both approaches found equal number of defects). Nevertheless, the differences are very high for the following types: missing function, performance, technical defect, and wrong function. Using a t-test, the difference between the number of defects found per technical type for the two approaches is statistically significant at α = 0.05 (p = 0.012, d = 2.26).
The percentage distribution presented in Table 8 indicates quite strongly that concerning defects that ET found, the proportion of missing function, performance, and technical defects were clearly higher. On the other hand the proportions of GUI and usability defects as well as wrong function types defects were higher in defects revealed by TCT.
The results of one-way analysis of variance (p = 7.8e − 16, η2= 0.38) also showed that students, when
using ET, found significantly different technical types of defects. A multiple comparisons test (Tuckey-Kramer, α = 0.05) (Fig. 3(a)) showed that the defects of the type: documentation, GUI, inconsistency and usability were significantly different from the defects of the type: missing function, performance and wrong function. The percentage distribution presented in Table 9 show clearly that students applying ET found greater proportions of missing function, performance and wrong function defects as compared to remaining types of defects.
The practitioners also found significantly different type of defects when using ET as shown by the results of one-way analysis of variance (p = 4.1e − 10, η2=0.47). A multiple comparisons test
(Tuckey-Kramer, α = 0.05) (Fig. 3(b)) showed similar results to students using ET, i.e., the defects of the type: documentation, GUI, inconsistency and usability were significantly different from the defects of the type: missing function, performance and wrong function. The percentage distribution of type of defects found by practitioners using ET (Table 9) show a similar pattern to when students applied ET, i.e., practitioners
−0.5 0 0.5 1 1.5 2 2.5 Wrong function Usability Technical defect Performance Missing function Inconsistency GUI Documentation Defect type Mean rank
(a) Multiple comparisons test for the different types of de-fects detected by students applying ET.
−0.5 0 0.5 1 1.5 2 2.5 3 Wrong function Usability Technical defect Performance Missing function Inconsistency GUI Documentation Defect type Mean rank
(b) Multiple comparisons test for the different types of de-fects detected by practitioners applying ET.
Fig. 3 Results of the multiple comparisons test for types of defects detected by students and practitioners using ET (The vertical dotted lines indicate differences in mean ranks of different types of defects, i.e., in Fig 3(a) above, the vertical dotted lines indicate that documentation has mean rank significantly different from missing function, performance, technical defect and wrong function.)
Table 9 Percentages of the type of defects detected by students and practitioners applying ET. Type Students Practitioners Students % Practitioners %
Documentation 2 3 1.15% 2.54% GUI 12 7 6.90% 5.93% Inconsistency 4 4 2.30% 3.39% Missing function 39 26 22.41% 22.03% Performance 38 24 21.84% 20.34% Technical defect 26 18 14.94% 15.25% Usability 10 7 5.75% 5.93% Wrong function 43 29 24.71% 24.58%
Table 10 Percentages of the different types of defects detected by students and practitioners applying TCT. Type Students Practitioners Students % Practitioners %
Documentation 0 0 0.00% 0.00% GUI 1 1 3.70% 4.17% Inconsistency 4 0 14.81% 0.00% Missing function 3 2 11.11% 8.33% Performance 4 1 14.81% 4.17% Technical defect 0 2 0.00% 8.33% Usability 3 8 11.11% 33.33% Wrong function 12 10 44.44% 41.67%
found greater proportions of missing function, performance and wrong function defects as compared to remaining type of defects.
We further applied the multivariate analysis of variance test for identifying any significant differences between students and practitioners for type of defects when using ET. The results given by four different multivariate tests indicate that there is no significant effect of the type of subjects (either students or practitioners) on the different type of defects identified in total (p-value for Pillai’s trace, Wilks’ lambda, Hotelling’s trace, Roy’s largest root = 0.58, η2= 0.20, α = 0.05).
The results of one-way analysis of variance (p = 2.1e − 4, η2 = 0.14, α = 0.05) also showed that
students, when using TCT, found significantly different types of defects. A multiple comparisons test (Tuckey-Kramer, α = 0.05) (Fig 4(a)) showed that the defects of type wrong function were significantly different than all other types of defects (which did not differ significantly among each other). The per-centage distribution shown in Table 10 shows that the defects of the type wrong function were detected more than any types of defects.
The practitioners applying TCT, on the other hand, did not find significantly different types of defects as given by the results of one-way analysis of variance (p = 0.05, η2= 0.14, α = 0.05). The percentage distribution of types of defects are shown in Table 10. As with students using TCT, practitioners also found more wrong function type defects than other types.
−0.2 −0.1 0 0.1 0.2 0.3 0.4 0.5 0.6 0.7 Wrong function Usability Technical defect Performance Missing function Inconsistency GUI Documentation Mean rank Defect type
(a) Multiple comparisons test for the different types of de-fects detected by students applying TCT.
Fig. 4 Results of the multiple comparisons test for different types of defects detected by students using TCT. (The vertical dotted lines indicate differences in mean ranks of different types of defects, i.e., in Fig 4(a) above, the vertical dotted lines indicate that defects of type documentation have mean rank significantly different from defects of type wrong function.)
Table 11 Severity distribution of defects.
Severity ET TCT ET % TCT % Total Negligible 13 9 4.45 % 14.52 % 22 Minor 49 12 16.78 % 19.35 % 61 Normal 99 25 33.90 % 40.32 % 124 Severe 108 14 36.99 % 22.58 % 122 Critical 23 2 7.88 % 3.22 % 25 Total 292 62 100 % 100 % 354
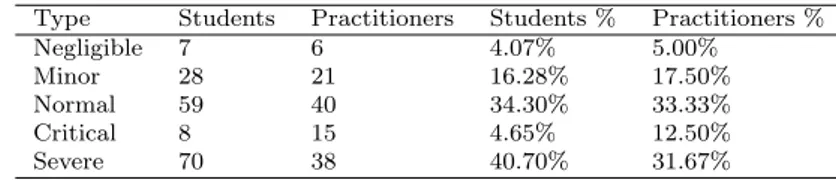
Table 12 Percentages of the severity level of defects detected by students and practitioners applying ET. Type Students Practitioners Students % Practitioners %
Negligible 7 6 4.07% 5.00%
Minor 28 21 16.28% 17.50%
Normal 59 40 34.30% 33.33%
Critical 8 15 4.65% 12.50%
Severe 70 38 40.70% 31.67%
We further applied the multivariate analysis of variance test for identifying any significant differences between students and practitioners for different types of defects when using TCT. The results given by four different multivariate tests indicate that there is no significant effect of the type of subjects (either students or practitioners) on the different types of defects identified in total (p-value for Pillai’s trace, Wilks’ lambda, Hotelling’s trace, Roy’s largest root = 0.08, η2= 0.35, α = 0.05).
Table 11 shows the categorization of the defects based on their severities. We can see that ET found more defects in all severity classes. The difference is also statistically significant using a t-test at α = 0.05 (p = 0.048, d = 1.84).
The percentage proportions in Table 11 show that the proportion of severe and critical defects is higher when ET was employed and the proportion of ‘negligible’ defects was greater with TCT.
Comparing the severity levels of defects found by students using ET show that they found significantly different severity levels of defects (one-way analysis of variance, p = 3.2e − 14, η2 = 0.46). The results of a multiple comparisons test (Tuckey-Kramer, α=0.05) showed that severe and normal defects were significantly different from negligible, minor and critical defects (Fig. 5(a)). This is also evident from the percentage distribution of severity levels of defects found by students using ET (Table 12). The students clearly found greater proportions of normal and severe defects in comparison to remaining severity levels of defects.
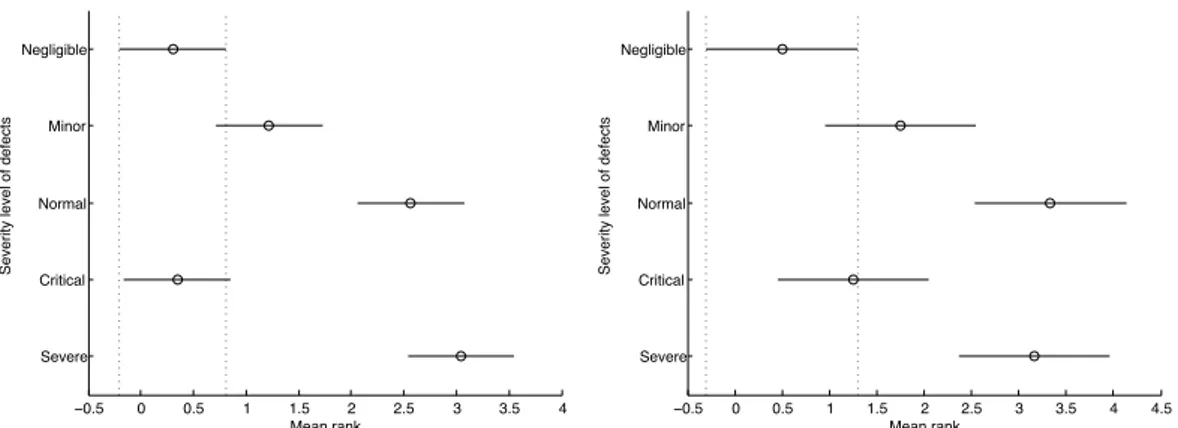
The practitioners also found defects of significantly different severity levels using ET (one-way analysis of variance, p = 7.5e − 6, η2= 0.40). A multiple comparisons test (Tuckey-Kramer, α = 0.05) (Fig. 5(b)) showed results similar to when students applied ET, i.e., severe and normal defects were significantly different from negligible and critical defects. The percentage distribution of severity levels of defects
−0.5 0 0.5 1 1.5 2 2.5 3 3.5 4 Severe Critical Normal Minor Negligible
Severity level of defects
Mean rank
(a) Multiple comparisons test for the different severity levels of defects detected by students applying ET.
−0.5 0 0.5 1 1.5 2 2.5 3 3.5 4 4.5 Severe Critical Normal Minor Negligible
Severity level of defects
Mean rank
(b) Multiple comparisons test for the different severity levels of defects detected by practitioners applying ET. Fig. 5 Results of the multiple comparisons test for different severity levels of defects detected by students and practitioners using ET (The vertical dotted lines indicate differences in mean ranks of different severity levels of defects, i.e., in Fig 5(a) above, the vertical dotted lines indicate that negligible defects have mean rank significantly different from normal and severe defects.) −0.2 −0.1 0 0.1 0.2 0.3 0.4 0.5 0.6 0.7 Severe Critical Normal Minor Negligible Mean rank
Severity level of defects
(a) Multiple comparisons test for the severity levels of defects detected by students applying TCT.
−0.5 0 0.5 1 1.5 2 Severe Critical Normal Minor Negligible Mean rank
Severity level of defects
(b) Multiple comparisons test for the severity levels of defects detected by practitioners applying TCT.
Fig. 6 Results of the multiple comparisons test for severity levels of defects detected by students and practitioners using TCT. (The vertical dotted lines indicate differences in mean ranks of different types of defects, i.e., in Fig 6(a) above, the vertical dotted lines indicate that defects of negligible severity level have mean rank significantly different from no other severity level.)
(Table 12) also show that practitioners found more normal and severe defects in comparison to remaining severity levels of defects.
We further applied the multivariate analysis of variance test for identifying any significant differences between students and practitioners for severity levels of defects when using ET. The results given by four different multivariate tests indicate that there is no significant effect of the type of subjects (either students or practitioners) on the different severity levels of defects identified in total (p-value for Pillai’s trace, Wilks’ lambda, Hotelling’s trace, Roy’s largest root = 0.14, η2= 0.24, α = 0.05).
The students when using TCT also found significantly different severity levels of defects as indicated by one-way analysis of variance (p = 0.007, η2= 0.12, α = 0.05). The multiple comparisons test
(Tuckey-Kramer, α=0.05) (Fig. 6(a)) showed that negligible, minor and severe severity levels of defects were different than none other severity level of defects while normal and critical were significantly different. Looking at the percentage distribution of the severity levels of defects found by students using TCT (Table 13) show that most of the defects found were of normal severity level while no defect of severity level critical was found.
The practitioners when using TCT, also found significantly different severity levels of defects, as given by one-way analysis of variance (p = 0.01, η2 = 0.21, α = 0.05). The results of a multiple comparisons test (Tuckey-Kramer, α = 0.05) (Fig. 6(b)) indicate that normal defects were significantly different from
Table 13 Percentages of the severity levels of defects detected by students and practitioners applying TCT. Severity level Students Practitioners Students % Practitioners %
Negligible 8 1 29.63% 4.17%
Minor 3 4 11.11% 16.67%
Normal 11 14 40.74% 58.33%
Critical 0 0 0.00% 0.00%
Severe 5 5 18.52% 20.83%
negligible and critical defects. Minor and severe defects did not differ significantly with other severity level of defects. The results are somewhat similar to when students applied TCT. The percentage distribution of severity levels of defects found by practitioners is given in Table 13. Similar to when students performed TCT, no critical defects are found by practitioners while normal defects were found more than any other severity level of defects.
We further applied the multivariate analysis of variance test for identifying any significant differences between students and practitioners for different severity levels of defects when using TCT. The results given by four different multivariate tests indicate that there is no significant effect of the type of subjects (either students or practitioners) on the different severity levels of defects identified in total (p-value for Pillai’s trace, Wilks’ lambda, Hotelling’s trace, Roy’s largest root = 0.14, η2= 0.20, α = 0.05).
4.3 False defect reports
We consider a reported defect as false if it is either: a duplicate, non-existing, or the report cannot be understood. A defect report was judged as false by the researchers if it clearly reported the same defect that had been already reported by the same subject in the same test session; it was not an existing defect in the tested software (could not be reproduced); or it was impossible for the researchers to understand the defect report. The actual false defect counts for ET and TCT were 27 and 44, respectively. The averages were ¯xET = 0.771 and ¯xT CT = 1.257.
It can be seen that on average TCT produced 0.486 more false defect reports than ET. However, the difference is not statistically significant (p = 0.522) when applying the Mann-Whitney U test at α = 0.05 (the data had a non-normal distribution). We also used the non-parametric Vargha and Delaney’s ˆA12
statistic to assess effect size. The statistic ˆA12turned out to be 0.463 which is a small effect size according
to the guidelines of Vargha and Delaney12.
Students applying ET reported 35 false defects with the median number of false defects being 0. On the other hand, the practitioners applying ET reported 9 false defect reports with the median number of false defects also being 0. The statistics indicate that on average both students and practitioners found similar number of false defects. This is also confirmed by Mann-Whitney U test (the data had a non-normal distribution) at α = 0.05 (p = 0.98, ˆA12 = 0.50) which indicates non-significant differences
in the median number of false defect reports submitted by students and practitioners when applying ET. Students applying TCT reported 37 false defects with the median number of false defects being 0. On the other hand, the practitioners applying TCT reported 7 false defect reports with the median number of false defects again being 0. The statistics indicate that on average both students and practitioners found similar number of false defects when applying TCT. This is also confirmed by Mann-Whitney U test (the data had a non-normal distribution) at α = 0.05 (p = 0.55, ˆA12 = 0.55) which indicates non-significant
differences in the median number of false defect reports submitted by students and practitioners when applying ET.
5 Discussion
This section answers the stated research questions and discusses the stated hypotheses.
12 Vargha and Delaney suggest that the ˆA
12statistic of 0.56, 0.64 and 0.71 represent small, medium and large effect
5.1 RQ 1: How do the ET and TCT testing approaches compare with respect to the number of defects detected in a given time?
In this experiment subjects found significantly more defects when using ET. Hence, we claim, it allows us to reject the null hypothesis: H0.1. This result is different from the study by Itkonen et al. (Itkonen
et al, 2007) where ET revealed more defects, but the difference was not statistically significant. On the other hand, the total effort of the TCT approach in their experiment was considerably higher. One plausible explanation for this is the difference in the experimental design. In this experiment the test case design effort was included in the testing sessions comparing identical total testing effort, whereas in the earlier experiment by Itkonen et al. the significant test case pre-design effort was not part of the testing sessions, comparing identical test execution effort. Considering this difference, our results, where ET shows a significantly higher defect detection efficiency, is in line with the earlier results by Itkonen et al. (Itkonen et al, 2007).
The answer to RQ 1 provides us with an indication that ET should be more efficient in finding defects in a given time. This means that documentation of test cases is not always critical for identifying defects in testing, especially if the available time for testing is short. Thus, our experiment shows that ET is efficient when it comes to time utilization to produce more results with minimum levels of documentation (see Subsections 3.4 and 3.6 for a more detailed description of type of documentation used in this experiment). It is important to note that this comparison focuses on the testing approach, meaning that we got superior effectiveness and efficiency by applying the ET approach to the same basic testing techniques as in the TCT approach. We also analyzed the level of documentation done for ET and TCT by subjects. The subjects performing ET provided on average 40 lines of text and screenshots as compared to on average 50 lines of text and screenshots for TCT. The documentation provided by subjects performing ET included brief test objective, steps to reproduce the identified defect and the screenshot of error message received. The subjects performing TCT documented all their test cases before test execution with steps to perform a test case with expected results. Similar to the ET group, they also provided the screenshot of error message received.
Our data in this study does not allow more detailed analysis of the reasons for the efficiency difference. One hypothesis could be that the achieved coverage explains the difference, meaning that in ET testers are able to cover more functionality by focusing directly on testing without the separate design phase. Other explaining factor could be cognitive effects of following a detailed plan. These aspects are important candidates for future studies.
5.2 RQ 2: How do the ET and TCT testing approaches compare with respect to defect detection difficulty, types of identified defects and defect severity levels?
The experimental results showed that ET found more defects in each of the four modes of defect detection difficulty. Moreover the difference in the number of defects found in each of the modes, by the two approaches, was found to be statistically significant. Therefore, we are able to reject the null hypothesis:
H0.2.1. This result strongly indicates that ET is able to find a greater number of defects regardless of
their detection difficulty levels. Even more important is the finding that the distribution of found defects, with respect to ET, showed higher percentages for mode 2 and 3 (more complicated to reveal). Based on this data ET is more effective to reveal defects that are difficult to find and TCT, in addition to revealing fewer defects, also reveals more straightforward ones. This indicates that it is challenging for both students and practitioners to design good test cases that would actually cover anything but the most simple interactions and combinations of features, while, when using ET, the subjects are able to more effectively test also the more complicated situations.
For detection difficulty of defects, although the different modes of detection difficulty differed within students and practitioners when applying ET, between students and practitioners there were no significant differences found. When TCT was used, there were again no significant differences found between students and practitioners for different modes of defect detection difficulty. There was however a trend observed: both students and practitioners, whether applying ET or TCT, detected greater number of easier defects as compared to difficult defects.
In terms of the technical type of defects, ET found, again, a higher number of defects in each of the technical type categories in comparison to TCT (exception being ‘documentation’ type). The differences
were found to be statistically significant, therefore the null hypothesis, H0.2.2, is rejected. When the
distributions of defects regarding technical type are compared, an interesting finding is that TCT revealed a higher percentage of GUI and usability defects. One would expect that ET reveals more of these often quite visible GUI level defects (and usability defects), since the documented test cases typically focus on functional features rather than on GUI level features.
For the different types of defects, there were significant differences within students and practitioners when applying ET, however no significant differences were found between the two groups. A trend ob-served was that, when applying ET, both students and practitioners found greater proportions of missing function, performance and wrong function defects as compared to remaining type of defects. When TCT was used, there were again no significant differences found between students and practitioners for differ-ent type of defects, however a trend common in both subject groups was that more wrong function type of defects were identified than any other type.
In terms of the severity of defects, the actual numbers found by ET are greater than TCT for each of the severity levels and the differences are also statistically significant. We are therefore able to reject the null hypothesis: H0.2.3. Considering the distribution of defects, our results show clear differences between
the two approaches. The results indicate that ET seems to reveal more severe and critical defects and the TCT approach more of normal and negligible level defects.
For the severity level of defects, there were significant differences within students and practitioners when applying ET, however no significant differences were found between the two subject groups. A trend observed was that, when applying ET, both students and practitioners found greater proportions of normal and sever defects in comparison to remaining severity level of defects. When TCT was used, there were significant differences found within students and practitioners, however between groups there were no significant differences. A trend observed was that more normal severity level defects were identified by the two groups of subjects when TCT was applied.
The answer to RQ 2 is that in this experiment ET was more effective in finding defects that are difficult to reveal and potentially also effective in finding more critical defects than TCT. The TCT approach led testers to find more straightforward defects as well as, to a certain extent, GUI and usability related defects. In addition, TCT revealed proportionally more intermediate and negligible severity level defects. This could be explained by the fact that test cases were written and executed in a short time and that the subjects were not able to concentrate enough on some of the potentially critical functionality to test. On the other hand, testers did design and execute the tests in parallel when using ET and, hence, ET might have enabled the testers to use their own creativity, to a higher extent, to detect more defects. Our results support the claimed benefits of ET. For defect detection difficulty, technical types, and severity of defects, the differences are higher than reported in the study by Itkonen et al. (Itkonen et al, 2007).
5.3 RQ 3: How do the ET and TCT testing approaches compare in terms of number of false defect reports?
Our experimental results show that testers reported more false defect reports using the TCT approach. The difference in comparison to ET is smaller than what was reported by Itkonen et al. (Itkonen et al, 2007). This result, even though not statistically significant, might indicate that there could be some aspects in the use of detailed test cases that affect the testers’ work negatively. One explanation can be that when using test cases testers focus on the single test and do not consider the behavior of the system more comprehensively, which might lead to duplicate and incorrect reports. This, in one way, could indicate that ET allows a better understanding of how a system works and a better knowledge of the expected outcomes. Based on the data, however, we are not able to reject H0.3.
Our experimental results also confirm non-significant differences in the number of false defect reports submitted by the two subject groups, when applying either ET or TCT.
In summary the experimental results show that there are no significant differences between students and practitioners in terms of efficiency and effectiveness when performing ET and TCT. The similar numbers for efficiency and effectiveness for students and practitioners might seem a surprising result. However, one explaining factor could be the similar amount of domain knowledge that has been identified as an important factor in software testing (Itkonen et al, 2013; Beer and Ramler, 2008). In this experiment the target of testing was a generic text editor application and it can be assumed that both students and professionals possessed similar level of application domain knowledge. Also the students selected for the