Overconfidence among Swedish private investors
- A regression study between the overconfidence behaviour among Swedish privateinvestors and demographic factors.
Master thesis within: Business Administration, Finance Number of credits: 30 ECTS
Program of study: Civilekonomprogrammet Authors: Anna Gustavsson and Emma Svenler Jönköping: 18th May 2020
ii
Master Thesis in Business Administration, Finance
Title: Overconfidence among Swedish private investors Authors: Anna Gustavsson & Emma Svenler
Tutor: Fredrik Hansen & Toni Duras Date: 2020-05-18
Key terms: Behavioural finance, Overconfidence, Overconfident investors, Demographic factors
Abstract
Background: For the past 30 years, the neoclassical finance has been questioned by behavioural finance. The main difference is behavioural finance´s ability to explain a
behaviour that deviate from rationality. One of the major biases within behavioural finance is overconfidence. Overconfident behaviour describes an investor with too strong belief in their own ability. This bias is not well-examined within behavioural finance in Sweden. The consequences of overconfidence are the investor´s overvaluation skills which in turn leads to unnecessary risk-taking, excessive trading and economic losses.
Purpose: The purpose of this thesis is to investigate if the overconfident bias exists among Swedish private investors. A study if the demographic factors; gender, age, marital status, education, and experience effect the level of overconfident behaviour. Further, an
investigation to identify industries overconfident investors prefer or despise.
Method: Our study use a deductive approach with a quantitative research. From the basis of previous studies, five hypotheses explaining a relation between demographic factors and overconfidence have been formulated. The data is collected through an online survey,
published in finance forums between 2020-03-10 to 2020-03-22 which gave 233 participants. A binary logistic model was performed in STATA to examine if the hypothesis should be rejected or not.
Conclusion: The findings from our study show presence of overconfidence among Swedish private investors. Statistically significant results confirm that gender, age, education, and experience have an impact on overconfident behaviour. Men are more overconfident than women, younger investors act more overconfident, higher education increase overconfidence, and more experienced investors are more overconfident.
iii Acknowledgment
We would like to take this opportunity and thank everyone who supported us to make this study possible. First of all, we would like to thank our tutor, Fredrik Hansen for important guidance and knowledge. We would also like to send our appreciation to Toni Duras for
support in the statistical field.
Secondly, we want to appreciate everyone who has responded to our web-survey, without your answers we would not have had any data to analyse.
Finally, enormous honour to students in our seminar group, focus group, and friends who gave us valuable feedback to strengthen our thesis.
iv
Table of Contents
1. Introduction... 1 1.1 Background ... 1 1.2 Problem ... 2 1.3 Purpose ... 3 1.4 Delimitations ... 4 1.5 Structure ... 4 2. Literature review ... 62.1 Theoretical approaches to finance ... 6
2.1.1 Neoclassical finance ... 6
2.1.2 Behavioural finance ... 6
2.2 Overconfident bias ... 8
2.2.1 Self-attribution bias ... 9
2.2.2 Excessive trading ...10
2.2.3 Better than average ...10
2.2.4 Miscalibration...11 2.2.5 Illusion of control ...12 2.3 Previous research ...12 2.3.1 Gender ...12 2.3.2 Age ...13 2.3.3 Marital status ...14 2.3.4 Experience ...15 2.3.5 Education ...16 2.4 Hypothesis ...18 3. Methodology ...19 3.1 Approach ...19 3.2 Data collection ...20 3.2.1 Survey ...20
3.2.2 Population and Selection ...21
3.3 Empirical method ...22
3.3.1 Binary Logistic Model ...22
3.3.2 Variables ...23
3.3.3 Dependent variables ...23
3.3.4 Independent variables ...25
3.4 Data Analysis ...26
v 4. Empirical findings ...30 4.1 Descriptive statistic ...30 4.2 Results ...31 4.2.1 Presence of overconfidence ...33 4.2.2 Gender ...34 4.2.3 Age ...34 4.2.4 Marital Status ...35 4.2.5 Experience ...36 4.2.6 Education ...37 4.2.7 Industry selections ...38 5. Analysis ...39 5.1 Presence of overconfidence ...39 5.3 Gender ...40 5.4 Age ...41 5.5 Marital Status...42 5.6 Experience ...42 5.7 Education ...43 5.8 Industry selections ...44 6. Conclusion ...46 7. Discussion ...48
7.1 Ethical and social aspects ...48
7.2 Contribution and self-criticism ...49
7.3 Future investigations ...49
8. References ...51
Appendices...55
Appendix 1- Survey ...55
vi
List of Figures
Figure 1 Allocation of motivational level among participants of the survey ... 28
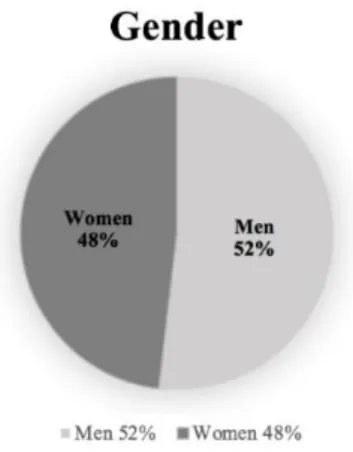
Figure 2 Allocation between men and women in the data collection ... 30
Figure 3 Descriptive statistics for continuous variables ... 30
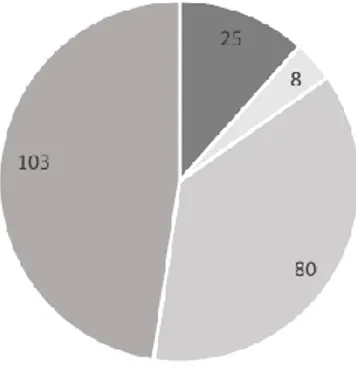
Figure 4 Allocation between Civil status in the data collection ... 31
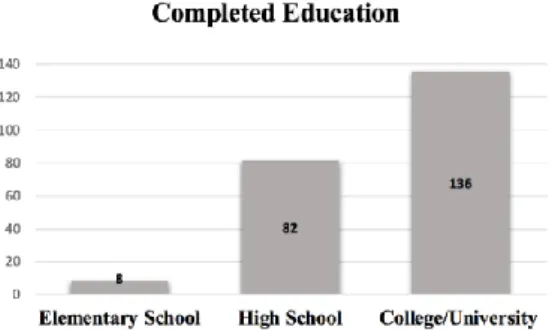
Figure 5 Allocation of completed education ... 31
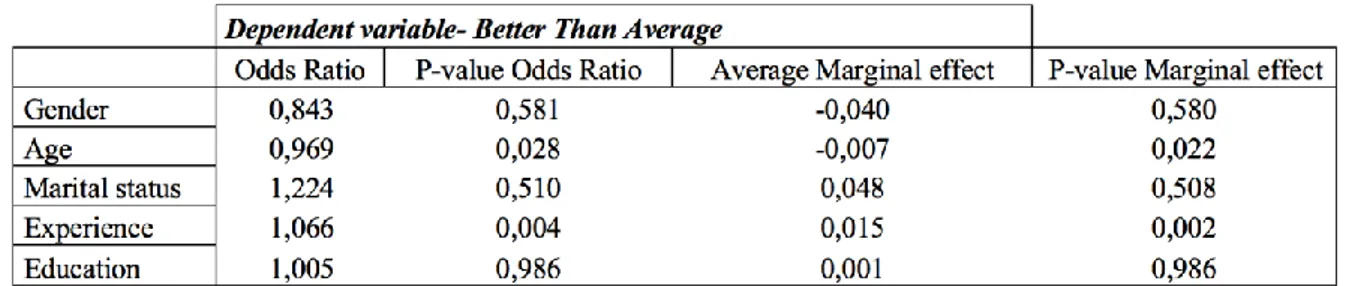
Figure 6 Summary of Regression result with Better Than Average ... 32
Figure 7 Summary of Regression result with Frequency ... 32
Figure 8 Summary of Regression result with Miscalibration ... 32
Figure 9 Person´s correlation ... 33
Figure 10 Presence of overconfidence among Swedish private investors ... 33
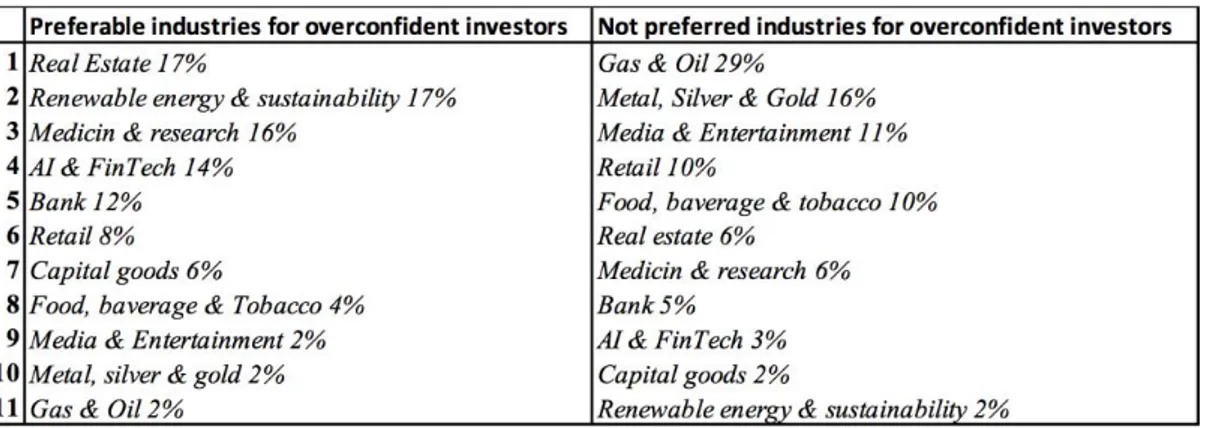
Figure 11 Industries ranked in preferable order... 38
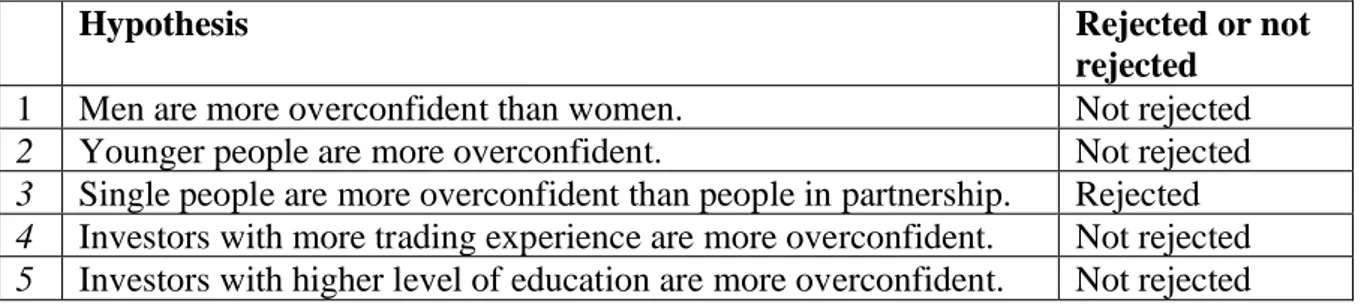
Figure 12 Summarised table of hypothesis 1-5 ... 40
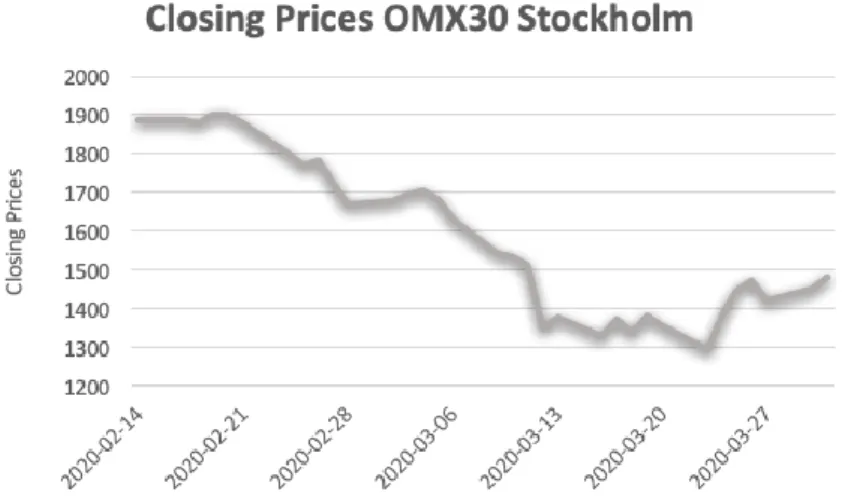
Figure 13 OMX-30 Stockholm during our data collection ... 45
List of Tables
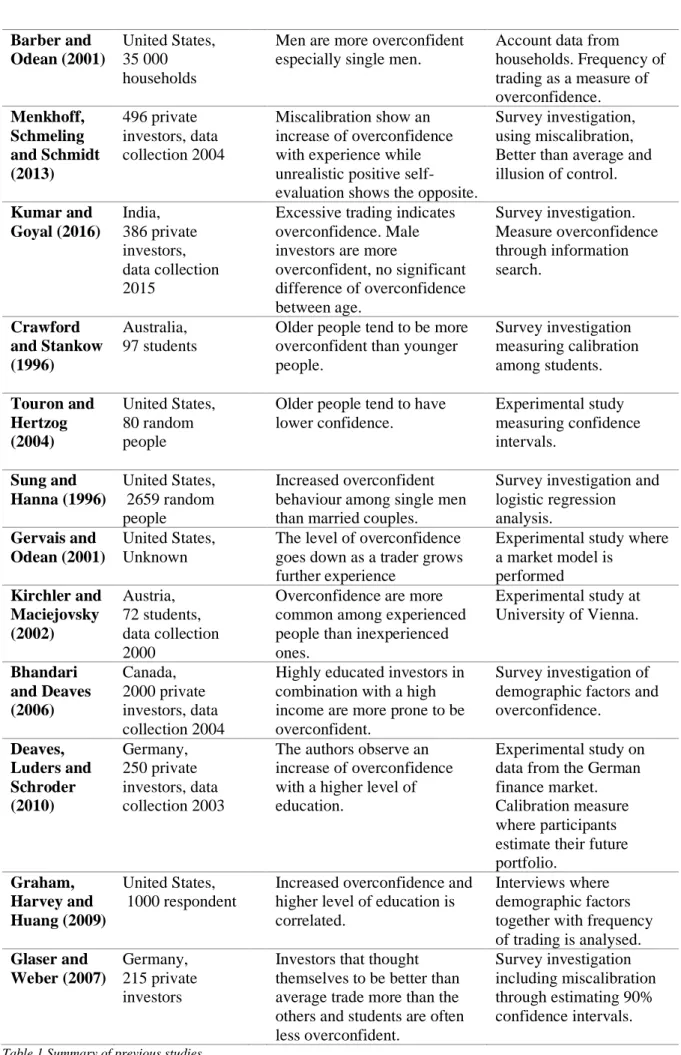
Table 1 Summary of previous studies ... 171 1.1 Background
The traditional approach to finance has been cited in neglecting to account for why individual trade assets and how investors build their portfolios. Therefore, the stock returns need to be caused by other reasons than pure rationality (Subrahmanyam, 2008). To explain any irrationality, Barberis and Thaler (2003) refers to two important blocks the behavioural finance approach is based on, investor psychology and limits to arbitrage. Psychology includes the reason to why individuals may differ from rational behaviour and whereby people do that. It refers to cognitive psychology that examines expectations and decisions, and how people influence decision making. Limits to arbitrage cover that it is practically difficult for rational traders to catch advantage of irrational tradesmen’s operations. Further, it might be exceedingly costly and therefore also hard to improve.
If investors differ from rational behaviour, they usually do so in a regular habit. Behavioural finance develops individual and regular deviations into models (Barber and Odean, 2001). Models in behavioural finance are therefore based on the original behaviour of personalities, and it has been confirmed that people rely on experimental evidence more than outcomes from traditional models (Subrahmanyam, 2008).
One of the cognitive biases within behavioural finance is the overconfident behaviour among investors. Overconfidence is a well-known phenomenon in the discipline of Psychology. However, it is not a well-examined area within behavioural finance, especially in Sweden. In behavioural finance, overconfidence is an area that describes investors with too strong confidence in their own ability. This does not only cause people to overestimate their knowledge but also to underestimate risks, which in turn might leads to reduced returns. (Nofsinger, 2014). The overconfident bias makes investors misjudge public information and overvalue their analysing skills. Consequently, it leads to unnecessary risk taking, excessive trading, and potential economic losses. The increased risk-taking roots in the tendency of overconfidence investors to hold positions in small, new and fewer industries. Excessive trading comes with the exaggerated belief in their own valuation and disrespect to market volatility and the predictions of others (Hirschey & Nofsinger, 2010).
Since overconfidence is mostly referred to as one of the most current judgment biases, it is a relevant area to explore. Many studies have proved that the consequences of overconfidence
2 behaviour are suboptimal decisions by traders, managers and politicians, which make it an interesting subject for the whole economy. It has also been a subject for research in several decades back and still no explicit explanation of the bias exists (Glaser, Langer & Weber, 2013). Furthermore, the gap of investigations of overconfidence investors in Sweden, make it an interesting geographic area to study.
This paper will investigate whether the demographic factors such as; gender, age, marital status, experience and education affect the overconfident behaviour among Swedish private investors and to which level. Barber and Odean (2001) analysed the relation between gender and overconfidence on US online brokers where they concluded that men are more
overconfident than women. The authors also found larger difference in trading activity of single men and single women and points out to be that married couples influence each other in a great manner and singles tend to act more overconfident in investment behaviour. Menkhoff, Schmeling and Schmidt (2010) conclude in their research that an increased age have a decreased influence on overconfidence behaviour. The authors also conclude that increased experience among investors at a younger age have the potential to give wider confidence intervals, namely increased overconfidence. According to Gervais and Odean (2001) the level of overconfidence goes down as a trader grows further experience. Some research has also presented an indication on increased level of education could lead to overconfident behaviour. For example, Mishra and Metilda (2015) present a result that experts have a higher probability of being overconfident than individuals with low expertise. 1.2 Problem
Despite performed studies, overconfidence is a complex phenomenon and is still an unsolved issue and a vibrant research area within the finance sector. According to Nofsinger (2014), investors who are overconfident gain a lower payoff compared to investors who are
considered to act rational. Previous studies show that investors who are overconfident make irrational investment decisions, consequently with a decreased portfolio yield. The most serious issue with overconfidence, namely having too much confidence in one’s own ability, is the reduced return on the investor's equity portfolio. Hence, the investor makes
unfavourable decisions (Barber & Odean 2000). An overconfident investor sells his portfolio more times a year than a rational investor, even sometimes while the yield is negative, which results in worse yearly rate of return for an overconfident investor´s portfolio. (Nofsinger, 2014).
3 Looking at Sweden, the general overconfidence bias among the inhabitants was initially investigated by Svenson (1981). Performed on students in Sweden and in the United States, Svenson showed that Swedes were not as overconfident as Americans. The study proves that the overconfident problem is more widespread among American students, albeit still being a serious issue in Sweden. Hence, to gain a greater knowledge of how present the problem is in Sweden, extended studies are required, and this thesis will be an example of this. Our study will also be performed on private investor instead of students in order to enable the
possibility to see a pattern of overconfidence within individual financial decision-making in Sweden.
As mentioned above, demographic factors such as gender, age, investor experience, marital status, and level of education are often claimed to affect overconfidence investors. Prior investigation has essentially been carried out in the United States and for some parts
comparable results have been seen, while different factors have presented differing outcomes. To our knowledge, no previous investigation has been performed in Sweden on the relation between overconfidence and the demographic factors such as gender, age, marital status, experience, and level of education. Also, an analysis if there are certain industries that attract overconfident investors has not been made in previous research. This is an interesting area for study to see if there are preferred industries for overconfident investors. Identifying theses possible industries could help in further investigations of overconfident investors and the search for a solution to the overconfidence problem.
1.3 Purpose
The purpose of this thesis is to investigate the overconfident bias among Swedish private investors. Demographic factors will be studied to find out which factors have a major impact on the overconfident bias. Also, an investigation of the possibility if certain industries attracts overconfident investors more than others will be made.
Following research questions will be considered:
• Does Swedish private investors display overconfidence?
• Do the demographic factors gender, age, marital status, experience and level of education affect overconfidence behaviour?
4 1.4 Delimitations
Our investigation will only examine whether the respondent is overconfident or not and whether demographic factors have an impact on overconfident behaviour. The problem of reduced return cannot be examined due to inaccessible investment data of the participants. To solve for the problem of reduced return one need to see the explicit yield for each participant. This thesis will focus on Swedish inhabitants that invest in any financial instruments. Further, the analysis is limited to five demographic factors. This is because according to previous research, these factors are relevant for measure overconfidence. The data are collected
through an online survey within a twelve days period, 2020-03-10 to 2020-03-22. During this time the outbreak of Covid-19 virus spread over the world and initiated a global crisis.
Hence, the result has been impacted by the violence of Covid-19 and influenced the answers of the participants in this study. This means that our data cover the overconfidence behaviour in Sweden in the beginning of a pandemic and global crisis.
1.5 Structure
This paper is built up as follow:
Chapter 2- Literature review: The chapter start with explaining the various approaches to finance, such as neoclassical finance and behavioural finance. These are essential discoveries that have remained important to this analysis. Further, the concept of overconfidence is described. The chapter ends with an increasing awareness of the demographic and social factors chosen to understand the overconfident behaviour.
Chapter 3- Methodology: This chapter commences with an establishment of the basic approaches to argue for our chosen method. The next part of this section is an explanation of how the data is collected and analysed. The chapter ends with a review of strengths and limitations of this study.
Chapter 4- Empirical findings: This part introduces the empirical findings from the binary logistic regression. Thus, displaying the consequences of demographic and social factors hold on investors and whereby describe overconfidence. Also, this chapter include a section of branch selection that attract overconfident investors.
Chapter 5- Analysis: This chapter is a summary of the empirical finding along with the literature review. It is arranged in the same way as chapter 4.
5 Chapter 6- Conclusion: This section meets the purpose by the empirical findings and
analysis.
Chapter 7- Discussion: This chapter take an ethical and social view of the accomplished study. The chapter ends with suggestion of future research within the area of overconfidence.
6
2. Literature review
2.1 Theoretical approaches to finance
Discussion whether which theory that is the right one to apply for the area of finance have been massive the last 30 years (Barberis & Thaler, 2003). Neoclassical finance and
behavioural finance are two standard theories that tend to state the opposite. The two theories presented in the section ahead have had a substantial influence on how to perceive the
investor behaviour. 2.1.1 Neoclassical finance
The main assumption of neoclassical finance is that all investors (or at least the major part) behave neoclassically rational. It presumes that investors know how to deal and decode given information and convenient value the probability of certain future happenings. Further, this theory also implies that if irrational decisions are made anyway resulting in mispricing of assets, it will be adjusted back by the rational agents taking advantage of the arbitrage strategies. Hence, neoclassical finance proposes that capital markets are always efficient if the assets holding the right price and expose all the available information (Szyszka, 2013). Advantages to be taken from this approach is the normative models that are produced in the concurrence with it. For example, the most standard theories to use such as Sharpe´s capital asset pricing model (Sharpe, 2007), Markowitz´s portfolio theory (Markowitz, 1952) and Fama´s efficient market hypothesis (Fama, 1970) are all founded through the neoclassical finance approach. Although, the disadvantage is the unrealistic application of assumptions, related to individual financial decision-making. At the same time, these assumptions are motivated to simulate processes to create the normative models mentioned above (Szyszka, 2013).
2.1.2 Behavioural finance
Prospect theory presented by Amos Tversky and Daniel Kahneman more than 30 years ago is one of the most well-known theories to reject the neoclassical finance theory and its
traditional assumption that people always act rational (Tversky and Kahneman, 1979). Instead it suggests that it is an approach that explains how people make decisions in an optimal way given different biases (Hirschey & Nofsinger, 2010). The scientists within behavioural finance took into consideration actual human behaviour to illustrate reasons for under and overvaluation of outstanding shares (Mishra & Metilda, 2015). The prospect theory describes the way people make decisions and value decisions involving financial uncertainty.
7 One major finding of Tversky and Kahneman (1979) was that people do not necessarily choose the less risky alternative between two choices. Further, also found is that people do not act in a rational way in all decisions (Hirschey & Nofsinger, 2010). The prospect theory has proven to have a major influence on behavioural finance and behavioural economics in general.
Behavioural finance has reached essential attention among both academics and practitioners across the preceding years. This has primarily been because traditional neoclassical economic models that state investors act rationally, which they do not. The investor´s behaviour when gathering knowledge and how they plan in a position to maximize their utility, is rarely the situation in the real world. (Barberis & Thaler, 2003). This traditional strategy and its theories have accordingly been involved in missing the tools to explaining why investors behave in a specific way, which has driven the growth of behavioural finance (Subrahmanyam, 2007). The theory of behavioural finance is argued to be built upon two major blocks, which are limits to arbitrage and investor psychology. The limits to arbitrage claim that rational investors can have difficulties undo dislocations made by irrational traders. The investor psychology block categorizes the different abnormality from the titled rational investor that not only might, but quite often occur. Further, the behavioural finance argues for the fact that the use of models where investors are considered not fully rational can be a reasonable way to understand some phenomena within individual decision making among investors. These models within behavioural finance have helped explain the way certain investors behave, more specifically why they trade in long run and why they prefer some portfolios over others (Barberis & Thaler, 2003).
The worldwide trend of people becoming more involved in their private economy makes it naturally to develop models that explain how well the individuals are handling their private economy. For example, regarding biases connected to trading and diversifying. Among the most explicit prediction for the rational behaviour models is a low frequency of trading. Still, studies have shown that individuals trade much more than what can be explained by rational behaviour. To explain this trend of excessive trading in a behavioural way, overconfidence is the prominent argument. Individuals think they hold on to the right information to warrant their trade, when the information they hold is too vague to justify their actions (Barberis & Thaler, 2003).
8 2.2 Overconfident bias
People often think of themselves to be better than average, an outcome that from a general perspective is impossible. Although, it is a typical behaviour for people to retain clear memories of success and weak memories of failure. This pattern of personality will in turn result in a belief among people that they are better than they really are. Investors for example, tend to remember stock market gains much sharper than huge market losses, which make the investors more confident. In turn, the overconfidence among investors create a behaviour of underestimation of risk, overestimation of their own knowledge, and an exaggeration of their skill to control proceedings (Hirschey & Nofsinger, 2010).
A related discussion is why the irrational and overconfident traders do not get pushed out of the market in the long run. Subrahmanyam (2007) mentions three reasons that argue for irrational investors surviving in the long run.
• The first one states that overconfidence can impact taking and create greater risk-bearing among investors. This can in turn potentially generate higher returns in the future despite the consequence of reduced return by overconfidence.
• Secondly, overconfidence is a precondition for investors to act aggressively, which then impacts the rational investor to diminish his trading. In certain points, this scenario will create greater expected profits for the overconfident trader. • The last argument states, when the stock prices affect the rudimentary through
influencing corporate investments, the overconfident investor can earn higher returns even in this case.
These scenarios take place because irrational traders tend to act on tenderness. Most often when the overconfident investors beat the rational investors, these are situations when irrational investors as a group outperforms the rational investors on an average basis. If the overconfidence behaviour was not substantial, one third of investors would consider themselves to be below average, one third among the average, and the rest third to be above average. Even though, this is not the case. Largely, one third see them to be above average and the rest two thirds consider them to be in average. Almost no investors states to be below the average investor. This generally applies to both individual private investors and
professional investors (Subrahmanyam, 2007).
Although, the overconfident bias is a very complex area to study and hence it cannot be measured by only one single factor, but seems to show off different facets (Glaser et al.,
9 2007). So, to narrow down the overconfidence term, there are some main measurement factors that indicate an overconfident behaviour. Among them, self-attribution bias, excessive trading, better than average effect, miscalibration and, illusion of control can be found. These measures will be explained shortly in the following section.
2.2.1 Self-attribution bias
The grade of overconfidence among investors tend to expand during times of success. Mostly due to what is known as the self-attribution bias, investors associate their success with skill while a loss often get associated with bad luck (Hirschey & Nofsinger, 2010). It is easy to identify this pattern through analysing the stock markets, during bull markets there is a clear excessively trading, whereas during the bear markets it shows a decline in trading activity. People with self-attribution bias manage to associate success to congenital characters such as skill and foreknowledge, and attribute breakdowns to situational circumstances. It refers to that people take credit for progress and criticize external parts for breakdowns (Bradley, 1978).
Heider (1958) established that attributes relate to needs and wishes and consist of two bias specifically, self-enhancing and self-protecting bias. Where self-enhancing bias relates to the aim of people to maintain an unreasonable level of honour for their accomplishment. Self-protecting bias refers to the irrational rejection of liability for fault. Gervais and Odean (2001), presented the self-attribution bias toward conventional training standards. Investors that are sensitive to the bias would associate the growth in profit of their investment as grateful and if the value of the investment goes down, they will describe it as bad luck or blame it because of some external factors. The authors formed a standard that defines whereby beginner traders that are self-attributive and flourishing, ultimately convert overconfident and practice high-risk investment.
Hirshleifer (2001) demonstrates in his research a strong association between self-attribution and overconfidence. Self-attribution and overconfidence are inactive and active equivalents where self-attribution learn investors to be overconfident. FengLi (2010)1 analysed the
association between overconfidence and self-attribution in his research utilizing two
frameworks that follow the manager’s opinion about future cash-flows. The author gathered data from a database maintained by the security and exchange commission at a time span
1 The article by Feng Li (2010) is published on SSRN and is not peer reviewed. However, it is an article cited by
10 from 1994-2007. The result showed that supervisors hold self-attribution bias which leads to overconfidence.
2.2.2 Excessive trading
Barber and Odean (2000) questions in their studies weather investors reduce their supposed utility by trading excessively. The result presented by Barber and Odean is that individual investors underestimate trading payments which in turn leads to that investors underperform relevant benchmarks. Also, according to their study, the personalities who trade the most in the market are the ones who perform worst in return. This can undoubtedly be solved by a simple interpretation, that investors believe them self to be better than average and
overestimating their knowledge, which in turn leads to enormously trading. According to another study by Graham, Harvey and Huang (2009), investors who display an overconfident behaviour have the tendency to believe they possess greater competence. This further leads to a greater willingness to act accordingly to their own beliefs and result in a numerous trading activity.
Excessive trading illustrates one of the most accessible predictions, namely that normal finance models reveal that there should be a simple small amount of trading in the financial market. Investigations describe that investors and associations trade more frequently than they should do (Barberis & Thaler, 2003).
Glaser and Weber (2007) found that investors who thought of themselves as above average traded more than others. Most normal investors underestimate the fluctuation of the risky assets and overestimate its precision. Thereby, the confidence interval for the assets becomes very small. It exists several different models to investigate in overconfidence and their common element is the prediction that overconfidence will result in higher trading volume whether it is a price taker or an informed insider. Further, Barber and Odean (2000) show that more frequency trading leads to reduced returns and Glaser and Weber (2007) in turn proves that overconfident investors trade more frequently. Therefore, the variable frequency of trading will be important in this study.
2.2.3 Better than average
Ola Svenson (1981) conducted an experiment investigating “The better than average effect”. The purpose of the study was to find out if all the respondents had an accurate perception of their own ability as well as their behaviour regarding risk taking. The experiment was conducted by asking American and Swedish students to estimate how good car drivers they believe themselves to be, as well as how much more skilled and less risky they consider
11 themselves to be compared with all the other respondents. The survey was estimated on a scale of ten intervals representing ten percent each. Svenson conducted the experiment as it has long been claimed that most car drivers consider themselves to be better than average. The result of Svenson's study shows that 93 percent of the American students thought they were better car drivers than the average. Whereby only 69 percent of the Swedish students thought they were better car drivers than the average. In the discussion, Svenson highlight that the belief of being better than other could in turn lead to that a person takes bigger risk than normal. The questions used in Svenson’s experiment; “how good and safe car driver you estimate that you are compared to others”, has been used in finance to study the area of overconfidence. As also mentioned in Nofsinger (2014), it is said that when overestimate your own ability or thinking that you are better than average is what characterize an
overconfidence investor. Hence, this will provide a measure for overconfidence in this study. 2.2.4 Miscalibration
Glaser et al., (2013) outline miscalibration quite effective as an “excessive precision in one´s belief”. Regarding miscalibration, their finding indicates that people’s probability estimations are too confident and creates a very narrow probability distribution. Volatility estimations has been made by asking investors for confidence intervals regarding the returns on an index, where most results showed too narrow intervals. As indicated by Deaves et al., (2010) there are several findings proving that individuals overestimate their accuracy of knowledge and overestimate their ability which is referred to as miscalibration. To measure the level of miscalibration one can use several ways. Although, the most used one is binary-choice questions or interval estimations, where interval estimation is the dominant one for miscalibration measurements within finance and economics (Glaser et al., 2013).
Further, a research by Jacobe and Moore (2000) was managed through miscalibration. The data were retrieved between 1998 and 2000 on thousand respondents to measure
overconfidence, estimated over two questions. The questions covered what the respondents believed the market would yield for the next twelve months followed by the question of what the respondent assumed their portfolio would yield for the next twelve months. The outcome of the investigation established that the thousand respondents on average thought that their personal return would outperform the market. The study by Jacobe and Moore was measured individually and addresses the phenomenon of overconfidence. Accordingly, from previous investigations, it can be assumed that personalities who rate themselves as more qualified investors then average are overconfident.
12 2.2.5 Illusion of control
The illusion of control relates to investors’ perception of the controllability of random results than it is in real life (Khan, Tan and Chong, 2019). An example of this is when throwing dice and guess what number the dice will show. No matter how many throws you make, the probability of each throw is the same, one has a sixth chance of choosing the right number. What follows then if a person is provided information that the dice the last three times shown the same number, three. The character who obtained the knowledge should now select what number the dice after the roll will show. Although the dice still has six options with the same probability many people ignore these and believe that the dice should show a certain number. Some believe that the dice have a greater chance of showing three, while others believe that the dice have less chance of being three. This phenomenon is referred to as the law of small numbers and can also be associated with hot hand fallacy. So, the problem is that these personalities assume that their choices are more likely to be accurate. Extended knowledge can thus, in many cases, lead to overconfidence. This is in line with what Subrahmanyam (2007) describes as irrational investors. An overconfident investor believes that more, but sometimes incorrect information will be helpful in making a better decision. However, the investor ignores known probabilities which makes the decision irrational.
2.3 Previous research 2.3.1 Gender
In 1997 Beyer and Bowden (1997) performed an examination in United States that was conducted on gender differences. Some psychologists in the United States examined whether there were differences between perceptions among men and women. The purpose of the study was to investigate whether men and women, with the same competence, have the same self-image about their competence. The study was conducted on American students, who all had to answer different factual questions of male, female and neutral character. The respondents were to answer two typical test questions which were then followed by indicating how many rights they thought they would receive on the task. They were also given to answer a seven-point scale, how well they expected them to perform, how important it was for them to perform well, and how difficult they thought the task would be. The results showed that there were statistically significant differences between the different genders. Men responded to a greater extent than women that they believed they would perform well. Males also
significantly overestimated their ability, while women underestimated their ability. The results of the study show that there are significant differences between the genders, men overestimate their ability to a greater extent than women.
13 Gender is a variable that affect the accuracy on an individual´s self-perception. Beyer (1998) performed an overconfidence measure on data from 1992. She found in her study a
significant difference between gender when measure self-perception and calibration when performing masculine tasks. In neutral tasks and more feminine task, no gender difference was found.
Mishara and Metilda (2015) found that the level of overconfidence is diversified between gender and that men prove to be more overconfident than women. The investigation where based on a data collection in India 2013. Previous researches of overconfidence bias have shown that both women and men tend to overestimate their own abilities. Lundberg et al., (1994) also found a pattern of increased difference between gender with an increased age. In the same study, they also state that the difference of overconfidence behaviour between gender was dependent on which tasks executed. Even though, these researches encourage the existence of gender differences, the variance between gender are sensitive to a wide scope of situational circumstances.
Connecting to behaviour finance, Barber and Odean (2001) also analysed the relationship between overconfidence and gender. In their study, they review psychological investigations that obtain a greater measure of overconfidence between men than women. They divide their data collection, a test trial of US online broker investors, on gender between 1991-1997. According to the authors, current financial economics implies that people function with maximum rationality. The authors doubt this believe and further demonstrates that rationality is missing in some financial decisions, where one behavioural finance problem is
overconfidence behaviour. Overconfident investors hold one familiar fundamental forecast, people trade excessively. Barber and Odean concludes that men do not rely as much on brokers, and they trade more excessively than women do; men hence have lower net returns. In that study, women turned their portfolios over 53 percent on an annual basis as opposed to men who turned their portfolios over 77 percent.
2.3.2 Age
Menkhoff et al., (2010) conclude that an increased age has a decreased influence on overconfidence. Their major finding was that miscalibration seemed to increase with age which results in less rational investors. Although, they bring up the fact that more
experienced investors are often more prone to be overconfident than inexperienced investors. Another result was found by Kumar and Goyal (2016), namely that age do not have a
14 that an investor with younger age is more disposed to the disposition affect which refers to the financial phenomenon of investors being more prone to realise gains while tending to ignore losses. Further, younger investors therefore act less rational. They also mention in their study that younger investors with limited experience are more reluctant to see the losses in their portfolio, which can be connected to the self-attribution bias and indirect indicate overconfidence as mentioned earlier in this paper.
The relation between age and overconfidence are vague, since different studies have shown different results. For example, Crawford and Stankow (1996) performed a study in Australia on 97 students. They found that overconfidence increased with age when they measured overconfidence through calibration tests. They said older participants performed worse in the resolutions but showed a consistent greater overconfidence behaviour than younger people. Totally opposite result was found by Touron and Hertzog (2004), in their experiment on 80 individuals in the United states. Their result says that older people are less overconfident, and they explain it through measure recognition of memory.
2.3.3 Marital status
Barber and Odean (2001) measured in their study civil status as married or single. Barber and Odean (2001) found difference trading activity of men and women, the greatest difference was identified on single men and single women. The turnover also differs largely when they compared single men´s and women´s portfolios. Single men invest 67 percent more than single women and further decrease their payoff with 1,44 percentage points more than a single woman per year. Thus, young and single men are more prone to hold volatile portfolios and open to accept market risk, which makes them less rational and more
overconfident. Although, an underlying reason to the difference between single and married ones, Barber and Odean (2001) points out to be that married couples influence each other and because of that reduce the difference between gender.
Another study of risk tolerance by Sung and Hanna (1996) performed in the United States 1992. They suggested that households ran by single males were like the households headed by married couples and both were considerably different from households ran by a single woman. The conclusion of Sung and Hanna (1996) were that husbands are the one most likely to make the financial decisions in a married couple, which result in a more frequent trading behaviour and indirectly overconfidence among single men and married couples.
15 2.3.4 Experience
Most people constantly learn about their own abilities through the response of their actions. Although, it exists an attribution bias within this learning because many of the people tend to overestimate the degree of personal responsibility to their own success. According to Hastorf, Schneider and Polefka (1970) the procedure of how investors learn their ability and how bias in that learning can create overconfidence investors. It is found in their studies that totally new investors do not act overconfident. On the other hand, it is also found that the
overconfidence behaviour peak in an early stage of learning and then decreases. Hastorf et al., (1970) also found that the non-rational investors and with most overconfident behaviour were not the poorest ones. It is said that overconfidence does not make traders wealthy, but the process of becoming wealthy can make traders overconfident. According to Gervais and Odean (2001), the level of overconfidence goes down as a trader grow further experience. They introduce a structure where investors earn experience by engaging in the stock market and therefore the level of maturity depends both on the amount of time spent on the stock market and the excitement of the invested time. Gervais and Odean than suggest that flourishing and inexperienced dealers are extra overconfident than experienced traders. There are behavioural studies that prove overconfidence behaviour becomes more common among experienced people than it does among inexperienced ones. An example of that phenomenon is found in the study by Kirchler and Maciejovsky (2002) in their study of 72 students in Austria. An interesting question is if behavioural biases tend to fade out with more professional experience within the market. According to Menkhoff et al., (2010) more
experienced investors at a younger age have the potential to give wider confidence intervals in studies and therefore show a less overconfident behaviour. Further, the young and more experienced person believe themselves as being above the average, in other words they tend to be more overconfident. This result indicates that both age and experience have a strong relation with overconfidence, with contrasting effects. Additionally, to age and experience factors, the education level and wealth also have a significant impact on overconfidence. Studies shown that experience has an impact on the overconfidence level, which not
necessarily is based on professionalism. Although, the relation between overconfidence and experience showed an opposing relation than between age and overconfidence. Thus, much experience results in broader overconfident behaviour while an older individual hold a less confident behaviour than a young individual (Menkhoff et al., 2010).
16 2.3.5 Education
Several studies have also shown an indication on higher level of education may lead to an increased overconfident behaviour. For example, Mishra and Metilda (2015) demonstrates that experts have a higher probability of being overconfident than individuals with low expertise. Hence, a higher level of education makes it more likely to be an expert which then indicates a relation between level of education and overconfidence. Further, Bhandari and Deaves (2006) found that high educated investors in combination with a high income are more prone to be overconfident. They also mention in the same study that especially well-educated males are more sensitive to overconfidence than women. A third study that shows a relation between education and overconfidence is the one by Deaves, Luders and Schroder (2010), where they observe an increase of overconfident with a higher level of education. Graham, Harvey and Huang (2009) also found in their study a relation between gender and education. They show that male investors with higher education thought of them self to possess higher competence than women with same education. Further, they also link the belief of higher competence to a higher frequency of trading, which than indicate an overconfidence behaviour according to previous studies by and Glaser and Weber (2007). Glaser and Weber also mention in their articles that students are often less overconfident than professional investors. Even though, the relation between investors professionalism and the overconfident behaviour can still be indirect connected to educations relation to
overconfidence as Mishra and Metilda (2015) demonstrates.
Study by Country and Data
Results and Findings Method
Beyer and Bowden (1997) United States, 419 Students
Men are more overconfident than women
Survey investigation. Better Than Average and calibration measures.
Beyer (1998)
United States, 488 Students
Males are better calibrated in masculine tasks.
Survey investigation. Calibration estimation through multiple choice.
Mishra and Metilda (2015) India, 309 fund investors
Men are more overconfident; it increases with both
experience and education.
Survey investigation. Better Than Average using a Likert scale.
Lundberg, Fox and Punćcohaŕ (1994) United States, 254 students, data collection 1992
Men are more overconfident than women and it increase with lower education.
Calibration measure through confidence interval estimation.
17 Barber and Odean (2001) United States, 35 000 households
Men are more overconfident especially single men.
Account data from households. Frequency of trading as a measure of overconfidence. Menkhoff, Schmeling and Schmidt (2013) 496 private investors, data collection 2004 Miscalibration show an increase of overconfidence with experience while unrealistic positive
self-evaluation shows the opposite.
Survey investigation, using miscalibration, Better than average and illusion of control. Kumar and Goyal (2016) India, 386 private investors, data collection 2015
Excessive trading indicates overconfidence. Male investors are more
overconfident, no significant difference of overconfidence between age. Survey investigation. Measure overconfidence through information search. Crawford and Stankow (1996) Australia, 97 students
Older people tend to be more overconfident than younger people. Survey investigation measuring calibration among students. Touron and Hertzog (2004) United States, 80 random people
Older people tend to have lower confidence. Experimental study measuring confidence intervals. Sung and Hanna (1996) United States, 2659 random people Increased overconfident behaviour among single men than married couples.
Survey investigation and logistic regression analysis. Gervais and Odean (2001) United States, Unknown
The level of overconfidence goes down as a trader grows further experience
Experimental study where a market model is performed Kirchler and Maciejovsky (2002) Austria, 72 students, data collection 2000
Overconfidence are more common among experienced people than inexperienced ones. Experimental study at University of Vienna. Bhandari and Deaves (2006) Canada, 2000 private investors, data collection 2004
Highly educated investors in combination with a high income are more prone to be overconfident.
Survey investigation of demographic factors and overconfidence. Deaves, Luders and Schroder (2010) Germany, 250 private investors, data collection 2003
The authors observe an increase of overconfidence with a higher level of education.
Experimental study on data from the German finance market. Calibration measure where participants estimate their future portfolio. Graham, Harvey and Huang (2009) United States, 1000 respondent
Increased overconfidence and higher level of education is correlated.
Interviews where demographic factors together with frequency of trading is analysed. Glaser and Weber (2007) Germany, 215 private investors
Investors that thought themselves to be better than average trade more than the others and students are often less overconfident.
Survey investigation including miscalibration through estimating 90% confidence intervals.
18 2.4 Hypothesis
From the areas of overconfidence, five alternative hypotheses based on the different demographic factors from previous studies have been framed.
1. Men are more overconfident than women. 2. Younger people are more overconfident.
3. Single people are more overconfident than people in partnership. 4. Investors with more trading experience are more overconfident. 5. Investors with higher level education are more overconfident.
19
3. Methodology
3.1 Approach
When investigate the society, one must decide whether a natural science model is applicable or not. Bryman (2016) states that there are three different philosophical positions to take. The first one is positivism, which encourage the approach of the social study to be identical to the natural studies. It consists of both deductive and inductive methods. The deductive principles are represented through hypothesis testing and allow explanations of laws to be evaluated. The inductive principles on the other hand, show off through gathering of information which provide basis for the laws. The positivistic philosophy has been the dominating one for decades within social sciences.
Second philosophy is realism. This approach believes that natural and social studies should and can use similar approaches when collect data and explain theories. This concept can be divided into two different forms, namely empirical realism and critical realism. Basically, empirical realism promotes that the by the use of suitable approaches, reality can be
understood by natural science. Critical realism advocate that the reality can be recognized and understood only by the identification of the structures that generate occasions and homilies (Bryman, 2016).
The third possible position according to Bryman (2016) is interpretivism. He states that this position represents an alternative to the positivism and advocates that a strategy is necessary that consider the variation between the social science and the object of the natural sciences and further demand the social scientist to hold on to the subjective explanation of social action. Hence, it explicitly says that one should differ from social science and natural science. Further, in order to conduct at social research one need to decide whether to use a deductive or inductive theory. A deductive theory is the most common way to relate the social research and theory. The deductive theory is carried on the basis where scientist search for what is already known within the specific research topic and based on that derives hypothesis which then needs to be tested through empirical criticism. This kind of theory is mostly associated with quantitative research methods. The opposite theory is called inductive theory and is more often associated with qualitative research methods. Thus, the inductive theory is based on collection of data to form a theory (Bryman, 2016).
20 A quantitative research is characterized by the collection of numerical data with a position of positivism and an approach which is always objective. Computer software such as Stata or SPSS is often used to analyse the data due to the massive volume. Further, there exist several types of analyses depending on the number of categories the tested variable can be divided into. First one is the univariate analysis, which is when one variable at a time is analysed. Common approaches within this analysis are frequency tables and diagrams showing explicit numbers of each tested variable. Secondly, the bivariate analysis takes two variables into consideration and analyse whether the two variables have a correlation. This analysis is often completed through regression and correlation statistics (Bryman, 2016).
In this thesis, the theory will be a deductive one and the position that will be applied is positivism. Henceforth, it will be based on alternative hypothesis on what is already known, and it will rely on empirical collected social statistics through an online survey. The purpose of this study is to identify any possible relations between several demographics and
overconfidence, therefore the bivariate analysis will be applied. 3.2 Data collection
3.2.1 Survey
In order to provide empirical evidence on the influence of demographic factors in the area of investment behaviour, a quantitative study was conducted in form of a web survey. Normally, two different approaches are discussed when collecting empirical data, which are primary- and secondary data. Secondary data refers to data that has been collected at an earlier stage and is available in different databases and/or documents and primary data means data that the researcher self collects through the research (Bryman, 2016). As the purpose of the thesis is to investigate the prevailing relationship between demographic factors and overconfidence among Swedish private investors, it is important to obtain new empirical data. Thus, primary data is used in order to obtain the most accurate results possible. In addition, another
advantage is that the information collected is adapted to what the study aims to investigate. The relationship pattern that can be found through our web survey will help us solve the problem of overconfidence, as the correlation will show which private investors who act overconfident. We thus provide public information on what behavioural patterns to avoid in order to reduce the risk of being overconfident.
The research method chosen for data collection: web survey, is advantageous by being time- and cost-effective. Another benefit is that we easily reach out to numerous respondents, spread out at different places in Sweden. One disadvantage, however, is that our distance can
21 cause questions to be interpreted differently as respondents cannot ask us to understand the questions correctly. The fact that opinions can be forced on respondents because of our predetermined questions with applied multiple-choice answers is another disadvantage. Also, the honesty can be questioned among the participants (Bryman, 2016).
The questions in our survey were pre-tested on several people throughout the design phase of the survey resulting in that several questions were exchanged, partly in style and somewhat in content. Finally, before publication, we tested the survey in a focus group of ten students, five men and five women, at Jönköping International Business School. This was done to
guarantee that the questions were clearly formulated, and thus clearly understood. Hence, to increase the validity of our survey (Bryman, 2016).
The survey was performed through the program Qualtrics and consisted of twelve questions. It was totally voluntary to participate, and the participants did not get paid. The response time to complete the survey estimated to take about two minutes. In order to develop the response rate and avoid that those who started the survey not finish it we decided to number all
questions. Information regarding the amount of questions and estimated response time was given before the survey was commenced in the preparatory text, see appendix 1.
3.2.2 Population and Selection
The purpose of this study is to examine the overconfidence bias among Swedish private investors and further demonstrate if there is any relation between selected demographic factors and overconfidence behaviour. Hence, the population in interest for this study is Swedish private investors, as opposed to professional investors.
According to the Swedish pension system (Pensionsmyndigheten, 2020), private investors include all authoritative Swedish inhabitants considered that everyone who ever worked in Sweden has maintained stocks through both national- and occupational pension. It is impossible to send the survey to everyone in Sweden and therefore, a probability sample is not viable. A probability sample is randomly selected and is generalised to be more
trustworthy to create a representative sample. The distribution of the survey for this study was a non-probability sample, which indicates that some units in a population has a higher probability of being selected, which result in a skewed selection (Bryman, 2016). Hence, since a probability sample cannot be conducted, it might occur sampling errors within the study, which will be further discussed in the section of strengths and limitations.
22 To reach out with the conducted survey, we chose to use convenience sampling, where
individuals decide by themselves if they want to participate in the survey (Bryman, 2016). This sampling type was appropriate for this study due to obvious factors such as a typical narrow time span for data collection. The survey was posted in internet forums on the investing sites; Avanza and Nordnet. In order to gain a broader participation rate with diversified gender and age, it was also posted in different Facebook pages which has the purpose of investment discussion. The different Discussion forums had variated focus, such as beginners, females, age, and experienced, which made it suitable regarding the formulation of questions in our survey. Furthermore, the sample size of this study is not abnormal from what previous study within this area have used. The total number of participants of the survey was 233 private investors. Our research follows the rules for GDPR and therefore neither hurt any individual in our data collection. To ensure this, all participants have proved their consent before they answered the survey. Further, the collected data do not contain any sensitive information such as social security numbers or names.
3.3 Empirical method 3.3.1 Binary Logistic Model
In this paper, a binary logistic model will be used to identify if there is any relationship between the demographic factors and overconfidence behaviour. Ordinary linear regressions are applicable to studies with continuous dependent variables. Our dependent variables are expressed through dummy variables, hence the logistic non-linear regression model is fitting the purpose of this paper. We have assumed that “The better than average effect”,
“miscalibration”, and “frequency of trading” indicate an overconfident behaviour. Thus, these become our dependent variables and all demographic factors are independent variables. Three binary logistic regressions have been performed in STATA with each dependent variable. Where the dependent Yi will take on either 1 or 0 and denotes as;
𝑌𝑖= {
1, 𝑖𝑓 𝑡ℎ𝑒 𝑖𝑛𝑑𝑖𝑣𝑖𝑑𝑢𝑎𝑙 𝑝𝑟𝑜𝑣𝑒𝑠 𝑡𝑜 𝑏𝑒 𝑜𝑣𝑒𝑟𝑐𝑜𝑛𝑓𝑖𝑑𝑒𝑛𝑡
0, 𝑖𝑓 𝑡ℎ𝑒 𝑖𝑛𝑑𝑖𝑣𝑖𝑑𝑢𝑎𝑙 𝑑𝑜 𝑛𝑜𝑡 𝑝𝑟𝑜𝑣𝑒𝑠 𝑡𝑜 𝑏𝑒 𝑜𝑣𝑒𝑟𝑐𝑜𝑛𝑓𝑖𝑑𝑒𝑛𝑡
To identify the relationship between overconfidence and the demographic factors, we use the following formula through STATA
𝐿𝑜𝑔 𝑃𝑟𝑜𝑏 (𝑌𝑖= 1)
1 − 𝑃𝑟𝑜𝑏 (𝑌𝑖= 1)
= 𝛽0+ 𝛽1𝐺𝑒𝑛𝑑𝑒𝑟𝑖+ 𝛽2𝐴𝑔𝑒𝑖+ 𝛽3𝑀𝑎𝑟𝑖𝑡𝑎𝑙𝑆𝑡𝑎𝑡𝑢𝑠𝑖+ 𝛽4𝐸𝑥𝑝𝑒𝑟𝑖𝑒𝑛𝑐𝑒𝑖+ 𝛽5𝐸𝑑𝑢𝑐𝑎𝑡𝑖𝑜𝑛𝑖
Yi is the dependent variable coded into dummy variable, either 0 or1. The β is a vector of the
23 overconfidence and the demographic factors, namely the β, odds ratio and its significance are used. The odds ratio describes the relation between the probability of an outcome and the non-probability.
𝑜𝑑𝑑𝑠 = 𝜋𝑖
1 − 𝜋𝑖
The attribute of a logit model is the broad range of its parameters between minus infinity to positive infinity, whereas probability only range between 0 and 1. The odds represent how a variable you obtain interesting associates to another variable in each population. If the odds are equal to one, it indicates that there is an equal likelihood of belonging to the sections. Significant assumptions about managing logistic regression are that it demands a large sample size, the independent variables should not be highly correlated with each other. Since we test all our independent variables against our dependent variable there may be problems with, multicollinearity. This problem exists when two independent variables are highly correlated with one another, which follows that the impact of the independent variables toward the dependent variable cannot be recognized (Bryman, 2016). Therefore, a Pearson’s correlation and a Cramér’s V in Stata are performed to see how the independent variables associate with each other.
3.3.2 Variables
In this thesis, the independent variables consist of the demographic factors; age, gender, marital status, experience and education. The dependent variables are those that indicate overconfident behaviour among private investors. The dependent variables are dependent since they show a behavioural pattern that external parties can affect. The independent variables are independent since they cannot be affected or manipulated (Bryman, 2016). 3.3.3 Dependent variables
We will perform three regressions where we have three different dependent variables. Many previous studies within the area of overconfidence have used at least two measures to identify overconfident behaviour. We have chosen the three most common variables from previous investigations.
The first variable that will be used to measure overconfidence among the participants in the study is the “better than average effect”. Further on, according to Nofsinger (2014) the variable has been used in previous studies to measure overconfidence behaviour. To
24 formulated like the one Svenson (1981) use in his study when investigated overconfidence behaviour overall. This was tested through question number seven in our web survey formulated as; How great investor do you consider to be in relation to the average Swedish private investor? The respondent estimated their own trading skill compared to the average Swedish private investor on a scale basis, where five is average, zero to four is below average, and the ones answering between six to ten will be overconfident. The answers are coded into dummy variables, where the respondent who estimates themselves above five are coded into 1 and all answers between one to five are coded to 0.
The second variable that will measure overconfidence is miscalibration, where the investors predict the yield of their own Swedish portfolio in comparison to the overall yield of the Swedish stock market. Question number eight (What do you think the average return on the Swedish stock market will be the next 12 months?) and question number nine (What do you think the average return on your Swedish equity portfolio will be the next 12 months?) in the web survey is than measuring overconfidence as well. Glaser and Weber (2007) confirms that investors who believe too confident in themselves has a very narrow probability distribution. The measure of this will be made accordingly to Deaves et al., (2010) which states that people who overestimate their own ability can be referred to as miscalibration and
overconfidence. The answers of question number nine and ten are also coded into dummy variables. The respondents who believe that their portfolio’s return will be higher than the return on the Swedish stock market is overconfidence and therefore coded as 1 and the others who believe the opposite is coded as 0.
The last dependent variable is frequency of trading, which also measure overconfident. Numerous studies have shown that excessive trading and a frequent trading behaviour are direct connected to overconfident behaviour. Barber and Odean (2000) measured it through trading activity during a period for their study. In this investigation, it will be measured through question number five in our web survey (How frequently do you trade with financial instruments?). As Graham, Harvey and Hung (2009) implies, that investors who trade more frequently tent to believe they have a greater competence, will be the basis in this question formulation. The ones that trade daily/weekly will be supposed to trade frequently and
therefore coded as a 1 equal to overconfident and the ones trading more seldom will be coded as 0 equal to not overconfident.
25 3.3.4 Independent variables
The independent variables examined in the study consist of five different demographics factors:
Gender- Previous studies have confirmed that there is a difference in investor behaviour among genders, most of the analysis proves that men are more overconfident than women when it comes to investor behaviour. (Mishra & Metilda, 2015; Lundberg, Fox & Punćcohaŕ, 1994; Barber & Odean, 2001) The variable is controlled through question 1 in our web survey where the respondent is asked to identify oneself as; man, woman or other. For the analysis, the answered variables were coded as dummy variables, where women are coded to 0 and men coded as 1, the ones answered other are excluded. To control if our investigation presents any contingent differences between gender in their investment behaviour.
Age- Some preceding investigation proves that there is a difference in investor behaviour among ages. Increased age has a decreased influence on overconfidence (Menkhoff et al., 2010). To find an explanation of how age, as an independent variable, affect private
investors’ behaviour, question number two was asked in the web survey (How old are you?). The question is asked as an open question where the respondent is given the opportunity to enter how old they are.
Marital status- Prior investigations established evidence of a variation in investor behaviour between different marital status, most of the study proves that single men are more
overconfident than single women when it comes to investor behaviour (Barber & Odean, 2001; Sung & Hanna,1996). The variable is checked through question three (Marital status?) in our investigation. Barber and Odean (2001) measured marital status in their investigation as single or married. However, in this report the measurements will be single or any type of partnership because of the similar rights of cohabitation and marriage in Sweden (sambolag 1:1). During the analysis, the variable remained coded as a dummy variable, where 1 stood equal to singles and 0 held equal to the partnership. To examine if our research presents any contingent variation between different marital statuses in their investment behaviour. Experience- Previous investigation has revealed that experience has an impact on the overconfidence level among investors. Although, previous studies have revealed a slightly different correlation between overconfidence and experience. According to Gervais and Odean (2001), the level of overconfidence goes down as a trader grows further experience. The researchers advise that inexperienced dealers are extra overconfident than experienced
26 traders. Although, there are completed behavioural studies that prove that totally new
investors do not act overconfident. Overconfidence behaviour becomes more common among experienced people than it does among inexperienced ones. To find an explanation of how age, as an independent variable, affect private investors’ behaviour, question number four (How long have you been trading with financial instruments?) is asked in the web survey. The question is formulated as an open question where the respondent is given the opportunity to enter how many years they have been trading with financial instruments. To find an
explanation of how experience and overconfident is correlated.
Education- Several studies of overconfident and education relations have shown a pattern of higher education tend to increase overconfident behaviour. Bhandari and Deaves (2006) found a relation between education and overconfidence, they also found an increased relation when the education was applied to men and not women. So, accordingly to the previous studies higher education gives a higher level of overconfidence. To interpret any relation in our study, question number five (What is your highest completed education?) is asked. In our study the participant is asked to answer which level of education they have completed, with the options as followed; elementary school/ High school/ College or University. When
analysing the result, once again dummy variables was used and the ones who finished college or university were and coded as 1 and the rest coded as 0.
3.4 Data Analysis
To analyse the binary logistic regression, we will look at odds ratio, significance and marginal average effect. An odds ratio is describing the probability of an outcome, in this case the probability to be overconfident. In this study, the confidence interval to be used is 95 percent which is the most used value. Hence, the result is significant only when the P-value is smaller than 0,05. The data obtained were tested for multicollinearity to investigate if there is a straight correlation among the independent variables. The multicollinearity was measured trough Pearson’s correlation and Cramér’s V, which can identify incorrect predictions regarding the independent variables. Cramér’s V shows if the relation is strong or weak between numerical variables where a value close to 1 shows a strong relation between the independent variable and a value close to zero indicates that the relation is weak. A Pearson’s correlation describes the relation between categorical variables and can take on values
between minus 1 and plus 1. (Gujarati & Porter, 2009). The marginal effect will be tested to more easily be able to discuss the outcome in the analysis.