ENHANCING THE PRODUCTION OF
BIOMETHANE
A comparison between GoBiGas process and new process of combining
anaerobic digestion and biomass gasification
DAHEEM MEHMOOD
School of Business, Society and Engineering Course: Degree Project
Course code: ERA401 Subject: Energy Engineering HE credits: 30 credits
Programme: M.Sc. programme in Energy Systems
Supervisor: Eva Thorin Hailong Li Examiner: Raza Naqvi Date: 2016-06-14
ii
ABSTRACT
In recent years, there is a rapid growing interest in the use of biomethane for the transport sector. A new method of combining anaerobic digestion and biomass gasification is proposed. The feasibility study shows that more biomethane can be produced; resulting in an increase in the revenue compared to individual biogas plants. The GoBiGas project,which is initiated by Göteborg Energi, adopted another method based on gasification, water gas shift and methanation to enable biomethane production from forest residue. The aim of the present study is to investigate the economic viability of the new method when compared with the GoBiGas (Gothenburg Biomass Gasification) process.
For this study, a model of GoBiGas process was developed in Aspen Plus to perform the technical analysis, in which the overall efficiency and exergy efficiency were calculated at different moisture contents of biomass. For the economic analysis, the annual revenue was also estimated during the study. The results show that the overall efficiency of the new method is higher than the efficiency of the GoBiGas process and there is more production of biomethane from the new process.
KEYWORDS: Aspen Plus, Biomethane, Biomass, Cold Gas efficieny, GoBiGas, Gibbs, Gasification, Exergy Analysis, Gibbs
iii
ACKNOWLEDGMENT
I began with the name of ALLAH, the most gracious and merciful. I have no words to thank ALLAH for His countless blessings and support bestowed to me throughout the journey of this research study. I would like to dedicate this research to my late uncle Ejaz Akhter, who was the bravest man I have known in my life and provided me with an opportunity to complete my Masters in Sweden.
I would like to extend my deep gratitude and appreciation to my supervisors Mr. Hailong Li and Miss Eva Thorin for providing me with an opportunity to conduct a research study. I would also like to thank them for there patient guidance, enthusiastic encouragement, useful critiques and endless help provided at each step of the research study.
I would also like to express my thanks to my examiner Mr. Raza Naqvi for providing his feedback during the research study.
Finally, I wish to thank my parents for providing me with their emotional support, love and encouragement throughout my study career. I would especially extend my gratitude to my mother for listening to detail of hurdles encountered during my research study with patience and providing me with encouraging statements to keep me motivated. I am extremely grateful to my beloved sister Asnea for her endless love and for providing me ideas to finalize the report. I am also grateful to my beloved younger brother Sarem, for his endless love, prayers and support throughout my life. This journey provided me with endless memories, and it was indeed a life time experience for me.
Thank you,
iv
TABLE OF CONTENTS
1 INTRODUCTION ... 1 1.1 Background ... 1 1.2 Purpose ... 2 1.3 Research questions ... 3 1.4 Delimitations ... 3 1.5 Thesis outline ... 4 2 LITERATURE STUDY/REVIEW ... 5 2.1 Biomass ... 5 2.2 Gasification ... 5 2.2.1 Background ... 5 2.2.2 Sub-process ... 6 2.2.2.1. Drying ... 6 2.2.2.2. Pyrolysis ... 6 2.2.2.3. Char gasification ... 72.2.3 Reactors and technologies ... 8
2.2.3.1. Fluidized-Bed Reactor ... 8
2.2.3.2. Dual Fluidized-Bed ... 8
2.2.3.3. Existing DFBs ... 9
2.2.4 Gas cleaning and upgrading ... 10
2.2.4.1. Tar ... 10
2.2.4.2. Water gas shift reaction ... 11
2.2.4.3. Methanation ... 11 2.2.4.4. Scrubber ... 11 2.2.5 End products ... 12 2.2.5.1. Syngas ... 12 2.3 Anaerobic digestion ... 12 2.3.1 Background ... 12 2.3.2 Conversion process ... 12 2.3.2.1. Hydrolysis ... 13 2.3.2.2. Acidogenesis ... 13 2.3.2.3. Acetogenesis ... 13 2.3.2.4. Methanogenesis ... 14
2.4 Economic feasibility of biogas ... 14
2.5 Process of anaerobic digestion and biomass gasification ... 15
2.6 Göteborg Biomass Gasification Project (GoBiGas Project) ... 16
v 2.7 Modeling Gasification ... 18 3 METHODOLOGY ... 20 3.1 Fuel ... 20 3.1.1 Ultimate analysis ... 21 3.1.2 Proximate analysis ... 21 3.2 Model ... 21
3.2.1 Fuel handling and drying ... 22
3.2.2 Gasification and combustion ... 23
3.2.2.1. Combustion ... 23
3.2.2.2. Gasification ... 24
3.2.3 Gas cleaning ... 25
3.2.4 Gas upgrading ... 25
3.2.4.1. Water gas shift reaction ... 26
3.2.4.2. CO2 Removal/Scrubber ... 26
3.2.4.3. Methanation ... 26
3.3 Efficiencies ... 26
3.3.1 Cold gas efficiency ... 26
3.3.2 Thermal efficiency ... 27
3.3.3 Parameters used for calculation of Efficiencies ... 27
3.4 Exergy Efficiency ... 28
3.5 Economy ... 30
3.5.1 Study approach ... 30
3.5.1.1. Net present value (NPV) ... 30
3.5.1.2. Internal rate of return (IRR) ... 30
4 RESULTS AND DISCUSSION ... 33
4.1 Model Validation ... 33
4.2 Performance of GoBiGas Model ... 34
4.2.1 Gas composition in streams after the gasifier for different moisture contents .. 34
4.2.2 Heat demand for different moisture content ... 36
4.2.3 Energy Efficiencies ... 37
4.2.3.1. Cold Gas efficiency ... 37
4.2.3.2. Overall thermal efficiency ... 38
4.2.4 Exergy analysis and Efficiencies ... 38
4.2.5 Economic Evaluation ... 40
4.3 Technology Comparison ... 42
4.3.1 Overall efficiency ... 42
vi 4.3.3 Biomethane Production ... 43 4.4 General Discussion ... 45 5 CONCLUSION ... 46 6 REFERENCES ... 47
APPENDICES
APPENDIX A: MODELING ASSUMPTIONS FOR DIFFERENT UNITS APPENDIX B: ASPEN PLUS SCHEMATIC
APPENDIX C: EXERGY CALCULATION FOR STREAMS APPENDIX D: ECONOMIC CALCULATIONS
vii
LIST OF FIGURES
Figure 1:Principle flowchart of indirect gasification(Dual Fluidized Bed process)………..9
Figure 2:Process of combining anaerobic digestion and biomass gasification (Li et al., 2015)………16
Figure 3:Schematic of GoBiGas process (adopted from (Alamia, 2015)……….18
Figure 4:Decomposition of non-conventional componet in (BMS1) stream into conventional components in stream (ELASH1) in Aspen Plus………22
Figure 5:Gasification and Combustion simulation in Aspen Plus………..……23
Figure 6:Combustion process with in and out coming streams in Aspen Plus………24
Figure 7:Gasification process simulated in Aspen Plus………24
Figure 8:Cleaning of gas in Sep(GCLEAN1) in AspenPlus……….25
Figure 9:Gas upgrading process simulated in Aspen Plus………..25
Figure 10:Schematic of exergy process…….………29
Figure 11:Comparison of thermal efficiencies between two processes….…….……….42
Figure 12:Comparsion of exergy efficiencies between two processes….……….43
Figure 13:Production of biomethane between two processes………..44
viii
LIST OF TABLES
Table 1: The upper limits of tar and particles from biomass gasification.(Milne,Evans &
Abatzoglou, 1998……….10
Table 2: Wood fuel (forest residue)properties/Biomass Composition (Heyne,2013)………….20
Table 3: Parameters used in calculation of plant overall efficiency………28
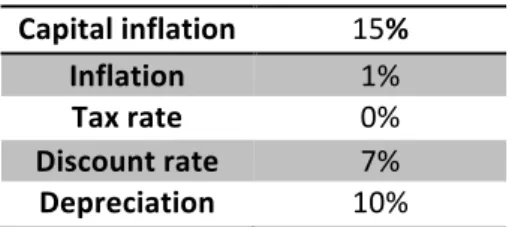
Table 4: Financial parameters used for economic analysis……….31
Table 5: Different cases with different capital cost O&M cost and biomass price for plant profitability……….32
Table 6: Data used in analysis of 50% moisture content……….32
Table 7: Data used in analysis of 20% moisture content……….32
Table 8: Wood chip properties used for simulation for model validation (Doherty, Reynolds, & Kennedy, 2014)……….33
Table 9: Cold gas composition from experiment- and demonstration plants; Guessing gasifier (Koppatz, et al., 2009), Vienna gasifier (Hofbauer, et al., 2008), Chalmers gasifier (Larsson, et al., 2013),reference study (Doherty, Reynolds, & Kennedy, 2014) and simulated GoBiGas model in Aspen Plus….……….34
Table 10: Gas composition in different streams of GoBiGas model with different moisture content………...35
Table 11: Cold gas composition after the gasifieer in GoBiGas model with different moisture content………...36
Table 12: Heat demand of heat exchangers in GoBiGas model……….37
Table 13: Heat demand from different reactors in GoBiGas model………37
Table 14: Cold gas efficiency of GoBiGas process for different mositure content………..38
Table 15: Overall thermal efficiency of GoBiGas process for different moisture contents…….38
Table 16: Calculated chemical exergy of different compounds……….………39
Table 17: Exergy losses in GoBiGas process for different moisture content……….…….39
Table 18: Overall exergy efficiency of GobiGas process……….………..40
Table 19: Resuls of economic analysis for different moisture content...………41
Table 20: Efficiency of GoBiGas process using raw gas composition…………..……….42
Table 21:Exergy efficieny of GoBigas process using raw gas composition.………43
ix
NOMENCLATURE
Designation Symbol Unit
Cold gas efficiency !"# -
Discount rate r -
Enthalpy h KJ/kg
Electricity el -
Energy - J
Mass flow $ kg/hr or k.mole/hr
Net cash inflow %& -
Overall thermal efficieny !' or !()*+& -
Total initial cost of investment %' -
Temperature T ℃
Number of time period t -
ABBREVIATIONS AND TERMS
AD Anerobic digestion
ar As recieved
Al2O3 Aluminium oxide
BFB Bubbling fluidized bed
C Carbon
CaO Calcium oxide
CH4 Methane
Cl Chlorine
CO Carbon monoxide
CO2 Carbon dioxide
DAF Dry and ash free
DS Dry Substance df Dry feed EU European Union FC Fixed carbon FG Flue gas GHG Greenhouse gas H Hydrogen H2O Water H2S Hydrogen sulphide HCl Hydrogen chloride
IRR Internal rate of return
LHV Low heating value
MC Moisture content
x
NH3 Ammonia
NiO Nickel oxide
NOx Term for NO and NO2
NPV Net present value
O Oxygen
PG Product gas
S Sulphur
SNG Synthetic natural gas
1
1 INTRODUCTION
The present chapter provides a background of current research study. Objectives and aims of current study are formed, and scope of research will be discussed. In the end, an outline is presented to provide a description of different chapters that are included in a current research study
.
1.1
Background
In the year 2012, according to estimates, only transport sector was accountable for approximately 25% of the total greenhouse gas emissions (GHG) of the European Union. The European Commission (2005) reports that among the GHG emissions of the EU, 70% coming from the transport sector was caused by road transport. The European Union have been setting up several policies and strategies that aim to reduce GHG emissions from the transport sector. Thus, it is one of the most important reasons behind the encouragement of biofuels by the Biofuels Research Advisory Council (2006).
According to estimates of Swedish transport sector, the use of biofuels has increased to 17% whereas the biogas percentage was 12% of the total share of biofuel during 2011 and 2012. Two distinct trends exist under practice for Sweden’s biogas i.e.; the production of biogas has increased, and the share of the biogas in road transport has improved (12% in the year 2011). Depending on how it is produced, methane, as an energy carrier and also a greenhouse gas, can be environmentally friendly. There is a possibility that biogas can be utilized as a fuel if its methane content is upgraded from 60% to 95%. (Swedish Energy Agency, 2014).
Biomass is a renewable energy carrier because of its carbon neutrality. Carbon neutrality means during the growth of biomass, the process of photosynthesis absorbs carbon dioxide produced during thermal utilization (Gröbl, Walter, & Haider, 2012; Zhang, 2010). According
to estimates, bioenergy could be a chief sharer in EU-27 renewable energy target by 2020, of which at least 25% would constitute biogas. Therefore, it is imperative to clean thereby, improving its calorific value and decreasing its unwanted components that damage the utilization system to upgrade the overall standard (Heyne, 2013).
Energy security reasons and environmental concerns have encouraged biomass gasification technology for effective consumption and use of biomass. The product of biomass gasification which is syngas has further usages. It can be used in power, heat and fuel generation. Moreover, biomass gasification has been used to produce CH4. Syngas has a low content of
CH4. Therefore, a methanation process is required to convert CO and H2 to CH4 (Alamia,
2
Bio-SNG, also known as biomethane, is characterized as a 2nd generation biofuel and the
biomass feedstock that is used in the production of 2nd generation biofuels is dominated by
lignocellulosic residues from agriculture and forest, such as tops and branches, crop residues, demolition wood, tree barks, and tall grasses. The key difference between 1st production fuels
and 2nd production is that biomass can be obtained without much interference to the food
economy. The technology that converts biomass 2nd production biofuels are still being advanced (Zhang, 2010). GoBiGas project is such a project derived from acquisition of knowledge within producing biomethane through gasification.The GoBiGas project was started by Göteborg Energi to allow biomethane production through biomass gasification from residuals of forests. It comprises of a gasification and methanation process(Göteborg Energi AB, 2012).
In the recent years, there has been an increase in biomethane to be used as a transport fuel. Recently a new process is proposed to produce biomethane by merging biomass gasification and anaerobic digestion. As previously mentioned syngas which is produced as a by-product of biomass gasification, H2 separated from syngas which is used to upgrade raw biogas
resulting from anaerobic digestion. According to the preliminary results, it is concluded the production of biomethane can be largely increased, consequently resulting in a higher profit. (Li, Thorin, Larsson, Dahlquist, & Yu, 2015).
1.2
Purpose
The goal of this study is to compare two different methods for the production of biomethane from both the technical and economic perspectives. The studied methods are (I) integrating biomass gasification and anaerobic digestion and (II) the GoBiGas process. In the study, the possible options for the gas upgrading process will be investigated, to obtain the desired end product. A model of the GoBiGas bio plant is developed in Aspen Plus, and then the process would be simulated to get the results of the system to form a technical and economical analysis.
The aim of the master thesis is:
• To develop a model to simulate the GoBiGas process.
• To perform techno-economic assessment of the new process and the GoBiGas process.
3
1.3
Research questions
The thesis can be listed down in a set of research questions. The thesis would address the following questions.
• What are the overall energy and exergy efficiency of GoBiGas process? • Which is the better way to enhance the production of biomethane?
1.4
Delimitations
The following limitations are involved for this research work.
• There is no production of electricity in the first phase of the GoBiGas process whereas the waste heat is used for the district heating purpose. In this thesis for the exergy and efficiency calculation, the heat and electricity are not calculated.
• For the modeling of GoBiGas process, the upgrading and gas cleaning process are simplified.
• The model of GoBiGas process is not optimized.
• The cost of biogas production is the same as used in the previous study on combining anaerobic digestion and biomass gasification.
4
1.5
Thesis outline
This thesis consists of the following chapters:
Chapter 1 Introduction
The first chapter gives a background to the subject of the research, forms the aims and objectives of the research, as well as presenting the scope of the study.
Chapter 2 Literature review
In this chapter, literature relevant to the search is analyzed to give an understanding of the gasification process, anaerobic digestion, gas cleaning and upgrading, end product, and the process of GoBiGas bio plant.
Chapter 3 Methodology
Describe the methodology for the different part of the thesis, input data to the model, Aspen plus modeling, exergy and energy analysis and economic assessment.
Chapter 4 Results and Discussion
Summarize the main results achieved from the model simulation and the exergy, energy, and economic assessment and then discussed.
Chapter 5 Conclusions
5
2 LITERATURE STUDY/REVIEW
The present chapter aims at acquiring knowledge and understanding of gasification process, anaerobic digestion, gas cleaning, upgrading, and end products. This section analyzes information presented in previous literature regarding biomass as a type of fuel and the gasification process. The literature review is useful for understanding the GoBiGas project.
2.1
Biomass
Biomass is a type of fuel regarded as renewable and a sustainable energy source without posing threats of additional CO2 to the atmosphere. The CO2 released from biomass is
absorbed during the growing and therefore, biomass is known as carbon neutral. Understanding of composition of fuel is a prerequisite for understanding the process of gasification of biomass. The ultimate analysis and proximate analysis are two different primary analysis describing the composition of biomass fuel. According to this analysis, the biomass comprises of four basic organic compounds: carbon, hydrogen, oxygen and nitrogen. According to Basu (2010) and BP (2014), it further contains a small amount of chlorine and sulphur. It is also comprised of moisture and a few inorganic impurities in the form of ash.
This study focuses on biomass fuels. One of the main components of biomass is moisture. Moisture content varies according to the type of biomass, such as wood bark contains 30-60% moisture content. The presently available gasification systems utilize dry biomass containing 10 to 20% moisture content to produce product gas with appropriate heating values (Alamia, 2015).
2.2
Gasification
The present section aims at explaining the background of gasification and process of gasification that includes drying, pyrolysis, and char gasification.
2.2.1
Background
While combustion is a process of heat generation through the thermal destruction of fuel, gasification is a chemical process that aims at producing gaseous fuels or chemical feedstock using carbonaceous materials. Energy in the fuel produced during the process of combustion is released as heat. According to Rezaiyan & Cheremisinoff (2005), the product gas generated during gasification have practical heating value as the energy is packed as chemical bonds during the process.
There are a number of useful benefits of gasification. According to Held (2012), using gasification, low heating value fuel can be gasified into high-quality fuel that can be utilized
6
as fuel or chemicals for other chemical processes or heat and electricity production. The process of gasification is affected by parameters such as feedstock, operating conditions, and gasifier design.
2.2.2
Sub-process
The gasification process comprises of three basic processes that occur simultaneously or in sequential order. These processes include drying, devolatilization or pyrolysis and gasification. Drying and devolatilization only require heat during the process while gasification involves a gasifying medium that is utilized to convert feedstock or provide an element of hydrogen to the product. Carbon dioxide, air, steam, and oxygen, or a combination of them are main gasifying mediums used during gasification process. The gasifying medium is a factor that influences the heating value and product gas composition. When oxygen is used as a gasifying medium, it increases CO and CO2 substances in product
gas while decreases the hydrogen content. High level of oxygen further results in moving the process towards combustion. Utilizing steam as a gasifying medium increases hydrogen content per unit of carbon in product gas while no combustion takes place. The use of air as a gasifying medium dilutes the product gas which occurs due to the presence of nitrogen in the air (Basu, 2010). It is suggested that the gasification of oxygen has the utmost heating value, followed by steam. According to Basu (2010), air gasification has the lowest heating value as compared to oxygen and steam gasification.
When using steam as a gasifying medium, steam-to-fuel (SFR)ratio describes the amount of steam relative to mass of DAF (dry and ash fuel) which is an important process factor that influences the gasification outcome (Larsson, Seemann, Neves, et al., 2013). According to Hofbauer and Rauch (2000), higher SFR level decreases tar level when varying it in the interval 0.18-0.8 kg steam per kg of dry fuel.
2.2.2.1. Drying
Drying is the first subprocess, in which the moisture is evaporated using the energy from the gasifier. On average, 2260 kJ of energy is required to vaporize 1 kg of moisture. The heat produced during the process of pyrolysis and gasification will be used inside the gasifier for the final drying process. When the temperature rises above 100°C, moisture starts to evaporate as the bound within the cell structures gets removed, and vaporization occurs due to low molecular weight compounds. This serves as a transition phase into pyrolysis stage. (Basu, 2010)
2.2.2.2. Pyrolysis
According to Basu (2010), pyrolysis, also referred to as devolatilization, expresses a thermochemical decomposition procedure in which larger hydrocarbons of biomass decomposed into smaller gas molecules. This process occurs either before or simultaneously
7
with the process of gasification in the absence of gasifying agents, or with a limited amount of gasifying agents that does not begin the main gasification process. 300-650°C temperature is usually required to carry out pyrolysis, which is lower than the temperature of the gasification process(800-1000°C).
Volatile component of dry fuel is converted to gas using heat (Larsson, Pallarés, Neves et al., 2010). Depending upon the biomass composition the volatiles that results after devolatilization process depends on upon the composition of biomass and comprises of NH3,
CH4, H2, CO2, C2H6, CO, H2O, N2, O2, H2S. Char is the residual product, which mainly consists
of solid carbon. It is composed of both organic and inorganic materials, with the maximum amount of solid carbon in the product (Rezaiyan & Cheremisinoff, 2005).
The following equation shows the formation of char using biomass feedstock:
-./ 122345678 + :2;5 → =ℎ;. + ?6@;5A@24 [1]
Tar is further formed from the condensable vapors through the process of condensation. The formation of tar generates a problem in the gasification process, as it is sticky liquid, which causes fouling the downstream processes (Asadullah, 2014).
2.2.2.3. Char gasification
Gasification is the most important process after the pyrolysis phase. It involves chemical reactions that occur in gasifier reactor between hydrocarbons present in the fuel, steam, carbon dioxide, hydrogen, and oxygen. Chemical reaction not only occurs between the hydrocarbons mentioned above but also involves chemical reactions between the gases that are produced from these hydrocarbons. Char gasification is the most significant reaction occurring during this phase which largely depends on the type of gasifying medium being used within the process. A large number of these reactions of gasification are endothermic in nature while there are many exothermic reactions too. Some of the most important char gasification reactions include the following reactions (Basu, 2010).
= + =BC ⇄ 2=B + 172 8H/J6@ [2]
= + :CB ⇄ =B + :C + 131 8H/J6@ [3]
= + 2:C ⇄ =:L − 74.8 8H/J6@ [4]
= + 0.5BC ⇄ =B − 111 8H/J6@ [5]
The end product in the process is a product gas along with different amounts of tar substance. The product gas also comprises of unconverted char and ash content. Product gas produced from gasification typically comprises of hydrogen, moisture, carbon dioxide, carbon monoxide and methane along with small amount of impurities in the form of ammonia, hydrochloric acid and hydrogen sulfide (Rezaiyan & Cheremisinoff, 2005).
8
2.2.3
Reactors and technologies
The updraft and downdraft gasifiers are two components of moving bed reactors that are commonly used gasification techniques at present. Entrained-flow reactor is a type of gasification technique which employs high temperature and pressure as operation conditions. The present chapter gives an in-depth explanation and description of relevant gasification technologies.
2.2.3.1. Fluidized-Bed Reactor
Fuel is added either from the top or sides to allow fast mixing in the fluidized bed. The hot bed solid uses bed temperature to heat the fuel thus causing rapid drying and pyrolysis.The medium of gasification (air, oxygen, steam or any combination) is added from the bottom into the reactor which facilitates fluidization process of fuel and bed material (Karlbrink, 2015). Two kinds of fluidized bed are obtained depending upon the velocity and speed of gasifying medium: a circulating fluidized bed (CFB) or bubbling fluidized bed (BFB). In CFB, the speed of gasifying material causes fuel particles to exit the reactor along with the gases while cyclone is used to separate these particles from gas and return them back to the bed. The bed is made up an inert material, sand, which helps to maintain an even temperature and stable operation of the reactor. These reactors have useful properties that make them suitable for upscaling purposes (Basu, 2010). The presence of fluidized bed make reactors less sensitive to changes in the size of fuel particles and moisture content (Held, 2012).
According to Basu (2010), these gasifiers operate at a very high temperature of 800-1000 °C that helps to avoid the accumulation of ash and uses biomass as a reactive fuel.
2.2.3.2. Dual Fluidized-Bed
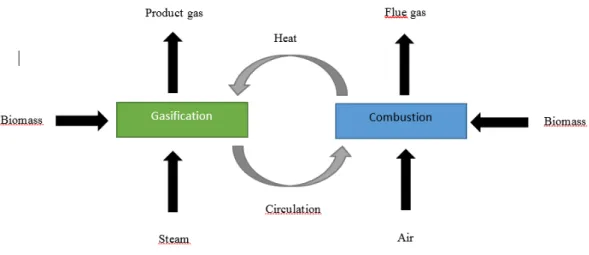
These type of gasifier helps in indirect gasification of fuel. DFB has a separate reactor where combustion takes place while gasification occurs in gasification reactor utilizing heat through circulating bed material. The fuel is added separately to both chambers, gasification and combustion chamber. The following diagram (Figure 1) is a schematic representation of DFB reactor and its chambers. The decomposition of fuel occurs when fuel gets mixed with hot bed material inside the reactor (Hofbauer et al., 2008).
9
Figure 1 – Principle flowchart of indirect gasification (Dual Fluidized Bed process)
In research study such as Held (2012) suggested that high temperature is achieved in bed material due to the burning of coke in combustion chamber utilizing air or oxygen as a gasifying medium. The product gas produced in DFB gasifier is not diluted with nitrogen and has a high heating value which serves an advantageous character for this type of gasifiers. However, the lower temperature in the combustion chamber can cause problems with reducing the amount of tar content which is a drawback of DFB gasifier.
2.2.3.3. Existing DFBs
Extensive studies have been done on the development of gasification process. In different research studies such as Held (2012), DFB gasifiers of various sizes have been successfully demonstrated. A 100 kW DFB gasifier has been successfully developed at Vienna University of Technology (Kern, Pfeifer, & Hofbauer, 2012). Another gasification reactor of 8 MW has been successfully established and working in Guessing, Austria. The product gas from this reactor helps in generation of electricity through a gas engine and facilitates in the provision of heat to district as well as for industrial drying process (Pröll, Rauch, Aichernig, & Hofbauer, 2007). According to Held (2012), the plant has been involved in producing vehicle fuel from biogas production. As a result, a biogas filling station was established adjacent to gasification plant.
A DFB gasifier of 2-4 MW for development and research purpose has been established at the Chalmers University of Technology as a part of GoBiGas project in Göteborg, Sweden (Larsson, Seemann, Neves et al., 2013). A demonstration unit as an extension of GoBiGas project with the planned manufacture of 20 MW SNG was established and became operational during the year 2014. While, a commercial unit of a designed production of 80-100 MW is another important step of GoBiGas project (Göteborg Energi, 2014).
10
2.2.4
Gas cleaning and upgrading
The cleaning of product gas involves cleaning of particles, tar, soot, and impurities. While the principles of shift reaction, methanation, scrubber, and membrane are explained in upgrading section.
2.2.4.1. Tar
The product gas obtained from the process of gasification has different utility options. However, the product gas is of no use without being cleaned from contaminants and impurities. The impurities and contaminants are produced during the process of thermal reactions with commonly occurring impurities, which are particulate matters, NH3, H2S, HCl,
and SO2. Tar is the most common impurity that is produced unavoidably during the
gasification process. Tar is described as thick black sticky liquid, which is heavier than benzene and is a highly viscous liquid. It is characterized as an aromatic compound. (Asadullah, 2014)
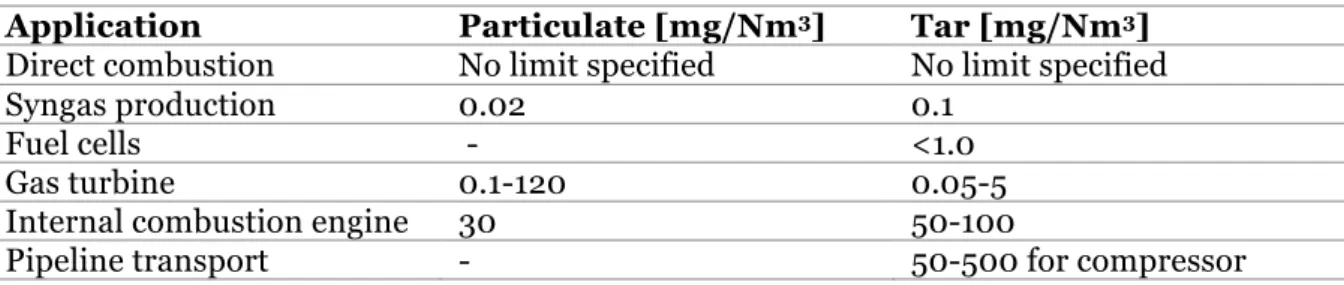
Tar creates a problem in the downstream application when it condenses or forms complex structures through the process of polymerization. Tar can form tar aerosols that block downstream equipment thus affecting the process of gasification. Different limits of tar amounts have found to be acceptable depending upon the downstream application. The following table describes various typical downstream applications, the upper limit of tar and particulates (Error! Not a valid bookmark self-reference.). (Milne, Evans, & Abatzoglou, 1998)
Table 1 - The upper limits of tar and particles from biomass gasification. (Milne, Evans, & Abatzoglou, 1998)
Application Particulate [mg/Nm3] Tar [mg/Nm3] Direct combustion No limit specified No limit specified
Syngas production 0.02 0.1
Fuel cells - <1.0
Gas turbine 0.1-120 0.05-5
Internal combustion engine 30 50-100
Pipeline transport - 50-500 for compressor
Tar gets vaporized along with product gas when it exists gasifier while it condenses as the gas is cooled.The tar production is dependent on many factors including the design of gasifier employed, the gasifying medium used during gasification, fuel-to-medium ratio and operating conditions. Gas cleaning is usually required to reach the lower limits. A typical fluidized bed has an acceptable range of about 10 g/Nm3 which can be compared to
downdraft and updraft biomass gasifier that has tar limit of 1 g/Nm3 and 50 g/Nm3
11
2.2.4.2. Water gas shift reaction
Water shift reactions are used to convert CO to H2 and CO2 through steam. It is an
exothermic reaction which occurs at a temperature range of 200-500°C and using water as a reactant during the process in the form of steam. The reaction is regarded as a high-temperature reaction over above 300 °C (Tunå, 2008). A number of different catalysts can be used to increase the speed of this reaction. The effect of pressure is minimal due to an unchanged number of moles in and out of the process (National Energy Technology Laboratory, u.d.). The following equation describes the water gas shift reaction.
=B + :CB ⇄ :C+ =BC− 41.2 8H/J6@ [6]
The molar ratios of H2/CO are remained controlled during the reaction describing a
constructive effect of this reaction. This ratio is estimated to be around 3 during the process of SNG formation and production. (Barrera, Salazar, & F.Pérez, 2014)
2.2.4.3. Methanation
Enhancing the content of methane in the raw gas occurs through the process known as methanation. (Porubova, Bazbauers, & Markova, 2011)
The following two reactions describe the process of methanation
=B + 3:C ⇄ =:L+ :CB − 206.28 8H/J6@ [7]
=BC+ 4:C⇄ =:L+ 2:CB − 165.12 8H/J6@ [8]
They are exothermic reaction occurring under the influence of a catalyst at a high temperature and pressure of 250-300°C and 20-30 bar respectively (Porubova, Bazbauers, & Markova, 2011). The catalyst is used during the reaction to increase the speed of the process of methanation (Tunå, 2008).
2.2.4.4. Scrubber
To remove CO2 from a mixture of gases, scrubbers are used along with water in previous
research studies. CO2 has greater solubility in water as compared to methane. The process
occurs at a pressure of 6-10 bar with a low temperature, as low as possible. The low temperature increases the solubility of CO2 in water and a temperature below 10 °C is usually
preferred to increase solubility as suggested according to Henry’s law. The scrubber must have an external temperature of 40°C to remove CO2 effectively. Using scrubbers can yield a
gas with 98% CH4 while removing 0.5-5 m3/day of water. (Bauer, Hulteberg, Persson, &
12
2.2.5
End products
The end products obtained largely depends on the process used for upgradation and application used during the process.
2.2.5.1. Syngas
Syngas, known as synthesis gas, comprises of hydrogen and carbon monoxide. It is obtained as a product gas through the coal or biomass gasification (Pröll, Rauch, Aichernig, & Hofbauer, 2007). Syngas is regarded as a fuel but can be largely employed in the production of other chemicals and fuels such as methanol. Apart from methanol, Fischer-Tropsch (FT)
liquids, methane and ammonia can be produced using syngas. The hydrogen to carbon ratio is an important parameter that differs based on the type of generated end product. In a research study by Held (2012), the absence of nitrogen and methane as beneficial in producing hydrocarbons using syngas.
2.3
Anaerobic digestion
2.3.1
Background
Anaerobic digestion is regarded as one of the oldest processing technology used by human beings in past. It was the most commonly used technology in wastewater treatment plants used for waste managements until 1970’s. Held (2012) suggests that the improper treatment of generated waste leads to negative environmental impacts. As a result, the management of waste has become an environmental and social concern.
It is critical to identify environmentally friendly and responsible ways to process organic fractions of municipal solid wastes through rapid biodegradation rather than landfilling or compositing the waste. Anaerobic digestion has many advantages such as it leads to efficient resource recovery and contributes towards the conversion of non-renewable energy sources. Furthermore, it is described as a controlled and closed process which is based on fugitive emission that is highly preferred as compared to landfilling and anaerobic compositing. Anaerobic digestion is a widely used process for obtaining methane as energy reservoir from municipal solid waste (McCarty, 2001).
2.3.2
Conversion process
Four main processes are involved during anaerobic digestion of organic matter which includes: hydrolysis, acidogensis, acetogensis, and methanogenesis.
13
2.3.2.1. Hydrolysis
Hydrolysis, also known as liquefaction, is the first in process steps of anaerobic digestion that enable microbial population to utilize complex biopolymers. To help bacteria’s absorb, organic matter is broken down into soluble monomers or polymers. Fermentation bacteria transforms complex soluble organic matter and compounds having higher molecular weight (such as proteins, lipids, nucleic acids, and polysaccharides) into soluble monomers and polymers (such as fatty acids, sugars and amino acids). The end product of hydrolysis largely depends on the type of compounds that are being hydrolyzed during the process. The process of hydrolysis is mediated by the presence of hydrolytic enzymes, which facilitates the process. For example, complex polymeric compound and matter are converted into monomers in the presence of hydrolytic enzymes produced by bacteria such as lipases, proteases cellulases, etc. Also during this initial stage of hydrolysis, lipids, proteins, nucleic acids, and polysaccharides are broken down to fatty acid, amino acids, purines and pyrimidines and monosaccharides respectively (Henze, Ekama, & Brdjanovic, 2008). The enzymes involved during this process are lipases, used in hydrolysis of fats, proteases for proteins and cellulases for degradation of cellulose. The rate of hydrolysis process depends on various factors such as large sized particles with a low surface to volume ratio would have a slower rate of hydrolysis as compared to small particles. Starches, cellulose, and protein have different rates of hydrolysis while non-degradable matter such as waxes or lignin are likely to slower down the process of hydrolysis of particles with which they are related (Gujer & Zehnder, 1983).
Hydrolysis process may hinder the complete process of anaerobic digestion which is usually encountered during the degradation of high solid organic wastes. To overcome the problems that usually occur during hydrolysis as well as to improve the process, various mechanical and chemical pretreatment methods can be used.
2.3.2.2. Acidogenesis
During this stage, the end products of hydrolysis (amino acids, sugar and fatty acids) serve as a substrate for fermentation. These hydrolysis products are converted into volatile carbon dioxide, fatty acids, hydrogen, and alcohols, along with the production of hydrogen sulfide (H2S) and ammonia (NH3) as by-products in the presence of acidogenic bacteria (Gujer &
Zehnder, 1983).Furthermore, acids are also formed which mainly includes butyric acid(CH3CH2CH2COOH), acetic acid(CH3COOH), propionic acid(CH3CH2COOH), and
ethanol(CH2H5OH). Hydrogen and acetate formed by degradation of methane are utilized in
the final step of anaerobic digestion while intermediary degradation products are further processed during the process of acetogensis (Henze, Ekama, & Brdjanovic, 2008).
2.3.2.3. Acetogenesis
This step of anaerobic digestion results in degradation of simple end products of acidogenesis to form acetic acid, carbon dioxide and hydrogen gas. This process of anaerobic oxidation happens in the presence of acetogenic bacteria (Henze, Ekama, & Brdjanovic, 2008).
14
2.3.2.4. Methanogenesis
During the process of methanogenesis during anaerobic digestion, methane gas is produced in the presence of methanogenic bacteria. The process occurs when the materials have been broken down into two simpler products: acetate ad hydrogen along with the formation of end products which are not included in the process of methanogenesis. Two types of methanogenesis and two groups of methanogenic bacteria are used as two different substrates are used to form methane gas. The following equation shows the formation of methane gas along with carbon dioxide from degradation of acetic acid (electron donor) in the presence of acetoclastic methanogens (Gujer & Zehnder, 1983).
CH3COO- + H2O → CH4 + HCO3- [9]
During this process, hydrogen is used as an electron donor while carbon dioxide is used as acceptor to form methane gas (Gujer & Zehnder, 1983).
CO2 + 4H2 → CH4 + 2H2O [10]
70% of methane produced during this process is formed from acetic acid. This large amount of methane produced from acetic acid is due to limited concentration of hydrogen in the digester, thus describing the presence of acetic acid as primary precursor for production of methane. Anaerobic digestion occur in various different number of stages depending upon the system of digester used. The simplest form of methane production occurs in one stage system. During this stage all the reactions occur simultaneously in a single reactor. In two-stage or multi-two-stage systems, different phases of anaerobic digestion such as methanogenesis, hydrolysis, acetogensis and acidogenesis takes place in different reactors (Gujer & Zehnder, 1983; Henze, Ekama, & Brdjanovic, 2008).
2.4
Economic feasibility of biogas
The economics of a biogas plant are connected to support regulatory structures that are established and adjusted by national governments. The biogas production in most countries in the EU is stimulated and accompanying incentive (feed-in tariff) differs according to the type of feedstock and system size. The amount of required support is dependent on the operational costs and capital costs, but also on the increase of fuel prices and the CO2 price
(Karlbrink, 2015).
The costs of investment of a biogas plant are chiefly related to its feedstock mix and size. It is also important to consider local circumstances such as concept (own use vs. large scale sales of heat or grid injection), availability of feedstock, and the distance to existing infrastructure. Depending on the plant, the investment can be made up of several equipments: gas upgrade installation (e.g. CO2 removal), pre-treatment (dehydration), feedstock storage, gasifiers (including machinery and electrical/control apparatus), gas treatment, gas storage, heat exchangers, and infrastructure. The costs of construction are included in the capital expenditure. Capital costs are undoubtedly a crucial factor in the cost of production of biogas.
15
Depending on the substrate type, feedstock is another major cost item (including storage and transport). Other items include electricity and heat use, maintenance costs, process costs, personnel costs (Meijden, 2010).
The connecting pipeline’s length and the gas grid’s pressure has a huge impact on capital costs. The Fraunhofer Institute gives the most thorough impression of biomethane production's cost structure (which originates from 2008) (Foreest, 2012).
The ECN (Energy research center of the Netherland, 2014) has estimated the costs of biomethane production based on biomass cost settings extending between zero €/GJ (home sources for small-scale operation) and 6 €/GJ ( the worldwide market for larger plants) and different plant scales (10-1,000MW). Costs of production range between 24 €/GJ for an undersized plant (10MW) with biomass costs of 6 €/GJ and 5€/GJ for a 1,000 MW plant with no feedstock costs (Meijden, 2010).
Bio-SNG or biomethane production is still in the phase of R&D and demonstration. There is few data on of an integrated installation ‘s economic performance (from pre-treatment to raw bio-SNG upgrade).
2.5
Process of anaerobic digestion and biomass gasification
As previously stated, there has been an increase in the use of biomethane as a fuel for the transport sector. According to Li (et al. 2015), H2 gas which is the major component of syngas
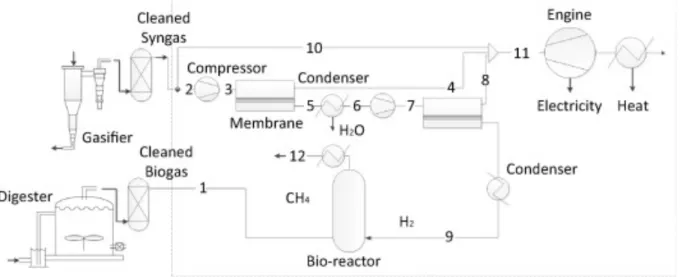
composition from biomass gasification is separated with the help of membrane system and then used to upgrade the raw biogas from anaerobic digestion. In Figure 2 the complete process can be seen. The cleaned syngas (stream 2) from gasification process is first compressed, and then hydrogen is separated by using glass type of polymer membrane system. Two membrane system has been used to achieve a high purity of H2. The separated
H2 (steam 9) is mixed with cleaned biogas from anaerobic digestion (steam 1) to convert CO2
to CH4. The technology of water scrubbing is used for biogas upgrading as CH4 is less soluble
in water as compared to CO2. With the help of the water scrubbing process, 80-99% of CH4
can be achieved.
According to Li (et al. 2015) with this process there is an increase in production of biomethane, producing 457 Nm3/hr and total income generated from the production of biomethane is 39.4 Msek/year. The energy and exergy efficiency of the process are 90.2% and 63.2% respectively.
16
Figure 2: Process of combining anaerobic digestion and biomass gasification (permission to use from authour(Li et al. 2015))
2.6
Göteborg Biomass Gasification Project (GoBiGas Project)
Göteborg biomass gasification project has been one of the leading projects of biogas production from thermal gasification. This project regards production of biomethane as an important source of energy. Biomethane has many beneficial features. Göteborg Energi AB (2014) establishes that existing natural gas stations and presence of infrastructure is the most common feature of using biogas. By 2020, it is estimated that Göteborg energy will be able to generate 1 TWh amount of biogas. This is approximately 30% of the current production of biogas in Göteborg or other words fuel used by 100000 cars (Göteborg Energi, 2014).
2.6.1
GoBiGas Gasification process
In different research studies such as Alamia (2015) and Karlbrink (2015) describes the GoBiGas process. According to Alamia (2015), the GoBiGas process comprises of gasification and methanation. In gasification process, the biomass is transformed into syngas, a product gas. Afterward, in the methanation process, the syngas is sanitized and upgraded into bio-SNG. The off gasses from the methanation procedure are heated in the post-combustion chamber, where N2 is used as inert gas.
In the methanation process, the CO2 is eliminated from the product gas. Then CO2 is then
used as an Inert gas. It helps to inertize the biomass silos, sanitize the product gas filter, and as a sealing gas (Alamia, 2015).
The GoBiGas procedure of gasification comprises of several stages. First is the section of gasification, which has a cyclone, combustion chamber, post-combustion chamber, and gasifier. Second, the product stage occurs and is followed by the flue gas cleaning systems. A
17
gasification section comprises a dual fluidized bed (DFB) biomass gasifier. DFB consists of endothermic bubbling fluidized (BFB) gasifier, as well as the exothermic circulating fluidized bed (CFB) combustor. Wood pellets are commonly used as biomass. Belt conveyor is used to transport the wood pellets to the biomass silos. There are two silos used; one is filled with pellets. The other silo is in operation which is used for putting pellets in the dosing bin of the biomass. With the help of a biomass feeding screw, the pellets are fed from the dosing bin into the steam fluidized gasifier. The pellets are gasified and pyrolyzed in the steam fluidized gasifier. The product gases are then moved to the gasifier’s top. The product gases mainly comprise of CO, CO2, H2, CH4, and water vapor (Alamia, 2015).
In the gasifier, olivine sand is used as the bed material. Olivine sand is heated in the incineration chamber. Then, in the cyclone olivine sand is split from the combustion gases. After the cyclone process, the olivine sand is fed to the gasifier, where there is the release of heat. The bed material is then returned from the gasifier to the combustion chamber through chute. It is then fluidized with steam at the gasifier’s bottom (Alamia, 2015).
In the product gas cooler, product gases moved to gasifier’s top are cooled. The gas cooler is defined as a tube which has a shell heat exchanger. The gas flows on the tube side where water flows on the side of the shell. After the cooler, a pre-coat material (CaCo3) is introduced
into the product gas. This added so as the pre-coat material may absorb condensing tar if any present in the product gases. This will help to prevent the product gas to stick to the filter fibers (Karlbrink, 2015).
Particulates contain tar, char and pre-coat material. Particulates are then removed from the product gas filter. The dust removed in the filter is sent to the combustion chamber so as to take maximum advantage of heating value of the ungasified carbon residues. It is done through combusting the particulates in the combustion chamber (Karlbrink, 2015).
The gas is cooled in the product gas scrubber. In the scrubber, the tar is diffused and dissolved in RME (scrubber liquid). Moreover almost all the water is condensed in the scrubber. The product gas that has moved at the scrubber’s top and bottom the liquid is moved to the scrubber reservoir. In the scrubber reservoir gravity separates RME and water. The pure RME steam is then recycled and re-sent to the scrubber. The condensate is injected to the condensate evaporator. The dissolved gases are moved to the post-combustion chamber from evaporator. Some of the RME is combusted as gets used in the process hence, new RME is utilized by replacing the utilized one in the combustion chamber (Karlbrink, 2015).
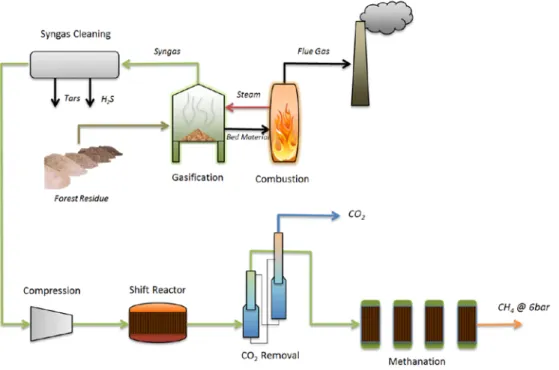
The combustion chamber is fluidized with combustion air. The main fuel used in the combustion chamber is charcoal from the gasification, as well as recycled product gas. The combustion heating is operated as close to stoichiometric surroundings as possible. The flue gases have high concentration of flammable compounds (mainly CO). The flue gases are split from the olivine sand in the cyclone and are heated in the post combustion chamber together with gases from the process of methanation (Karlbrink, 2015). A general plan of all the all process can be seen in Figure 3:
18
Figure 3: Schematic Of GoBiGas process (adopted from (Alamia, 2015))
According to Alamia (2015), during normal production, the 20 MWSNG plant uses 3 MW
electricity, 0.5 MW RME and 32 MW wood residues. It produces 20 MW biogas and an excess of heat. At a high temperature 5 MW of heat is injected directly to the district heating network. Moreover, before it to be distributed as district heating 6 MW is upgraded at a heat pump plant. This product is biogas. The product biogas comprise of 95% CH4. This biogas is
distributed through local natural gas grid station.
2.7
Modeling Gasification
For modeling of gasification different research studies such as Larsson (et al., 2010) states, To predict the effects of design and operating or feedstock factors, mathematical modeling is highly preferred. Though a mathematical model is not a reliable source about the performance of gasifier, but using the simulation along with other experimental data, gasifier performance and effects can be reliably predicted as well improvements can be carried out to enhance performance. Reliability of performance is further enhanced through carrying out performance check on commercial plants that are already established and are fully functional as compared to predicting models of a gasifier, using hypothetical data. However, carrying out experimental checks poses certain disadvantages as the variables during the process of gasification could not be maintained constant during all circumstances and therefore, extraneous variables can affect the performance of gasifier, thus changing optimum operational conditions. At the same time, using models of gasifier provides an opportunity to control every variable used in the process providing information over a broad range of
19
situations and using a variety of different variables. The use of the mathematical model is less expensive as compared to using commercial, experimental data. It can provide knowledge regarding the operational capacity of the gasifier in extreme conditions as well as provide useful feedback to improve and enhance gasifiers (Basu, 2010).
The referenced study followed during the study of modeling of GoBiGas bio plant is that described by Doherty, Reynolds, & Kennedy (2014) in which a simulation model of the dual fluidized bed of gasification process is developed in Aspen Plus. The model designed was founded on Gibbs free energy minimization and a controlled equilibrium was utilized to adjust it. In the reference study, the result of the model is validated and predict syngas gas composition, cold gas efficiency, and heating value in very good agreement with published data (Doherty, Reynolds, & Kennedy, 2014).
According to Porubova (et al., 2011), to obtain gas composition and perform rough calculations for the gasification process a nonstoichiometric equilibrium model is used. Gasification is a reacting system, and the minimization of Gibbs free energy can be used as equilibrium model. When Gibbs free energy is at its minimum steady equilibrium condition is attained, and the gas composition can be obtained. An equilibrium model is autonomous of the gasifier structure and is useful to evaluate the product gas composition by changing the process parameters.
In a nonstoichiometric model, no reactions need to solve the problem. Instead, the method of minimizing Gibbs free energy is utilized, which only needs the ultimate analysis of the fuel. When Gibbs free energy of a reacting structure is at its minimum, a steady equilibrium condition is reached. If ΔG0f,i is the Gibbs free energy of configuration of species i at standard
pressure of 1 bar, the Gibbs free energy Gtotal for the gasification goods including N species (i=1…N) (Jarungthammachote & Dutta, 2008) is given by:
TUVUWX= ` Z[∆T],[_
[ab + Z[cd@Z eef
f `
[ab [11]
To minimize Gtotal in equation 11 the unknown values of ni must be solved. Gtotal is subject to the overall mass balance of single elements. For carbon, as an illustration, the amount of carbon in the ultimate analysis must be equal to the sum of carbon in the mixture of gases after the reactions, this regardless of the fuel’s type, reaction path, or chemical formula. Hence, for each jth element it can be written
;[,gZ[
`
[ab = hg [12]
Where ai,j, is the quantity of atoms of the jth element in the ith species. Aj is the whole number of atoms of element j going into the reactor. When Gtotal is at its minimum the correct value of ni is found (Jarungthammachote & Dutta, 2008) .
The minimization of Gibbs free energy underestimates the yield of CH4. Methane equilibrium
often corresponds to concentrations below 1 %, this because CH4 reforming reaction rate is
20
3 METHODOLOGY
This methodology section includes fuel used for simulation, next to the chosen model approach along with the constructed system in Aspen Plus. The last part explains how the calculation of cold gas efficiency, overall thermal efficiency, and the economy part is carried out. These chosen methods then lead up to the results and discussion part of the thesis.
3.1
Fuel
Woody biomass at the delivery point of GoBiGas process is frequently in the shape of chips with a moisture content of 50%–60%, drying this biomass requires low-temperature heat. According to Heyne (2013), If the biomass has a moisture content of 50% on a wet basis (w.b.) and a heating value (LHV) on a dry basis of <19 MJ/kg and, the evaporation’s heat demand of the moisture and heating to a gasification temperature of 900°C matches to 22% of the LHV of the fuel. Nevertheless, if the biomass is pre-dried to 10% w.b. moisture, the heat demand only makes up 2.5% of the fuel LHV. In the process of gasification, this heat is supplied by heating of the fuel or product gas. Biomass drying is a rigorous procedure that needs considerable energy input, which has a negative influence on the entire process’s efficiency (Alamia, 2015).
The composition of the fuel used is second generation biomass consisting out of forest residues, as shown in Table 2. The moisture content of 50% and 20% is used. Since volatile matter is higher than 60%, decomposition of biomass results in a large amount of pyrolysis gas above 400 °C.
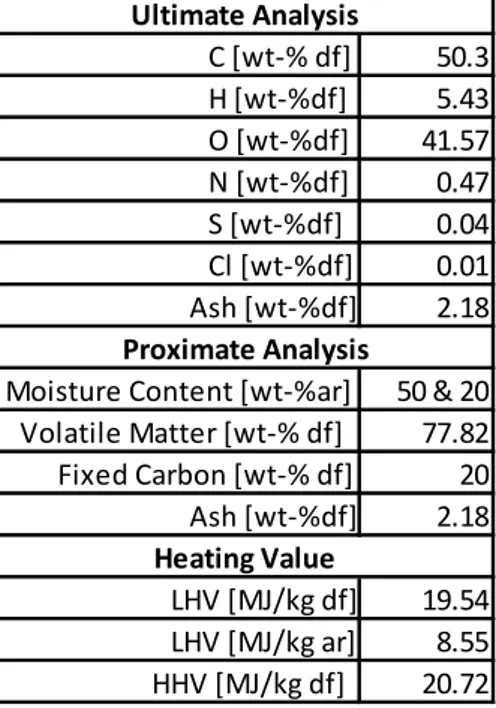
Table 2: Wood fuel (forest residue) properties/Biomass Composition (Heyne, 2013)
*df = dry feed *ar = as recieved 50.3 H [wt-%df] 5.43 O [wt-%df] 41.57 N [wt-%df] 0.47 S [wt-%df] 0.04 Cl [wt-%df] 0.01 Ash [wt-%df] 2.18 50 & 20 77.82 20 Ash [wt-%df] 2.18 19.54 8.55 20.72 HHV [MJ/kg df] Proximate Analysis Moisture Content [wt-%ar] Volatile Matter [wt-% df] Fixed Carbon [wt-% df] Heating Value Ultimate Analysis C [wt-% df] LHV [MJ/kg df] LHV [MJ/kg ar]
21
3.1.1
Ultimate analysis
According to ultimate analysis, biomass is comprised of only four basic elements with oxygen and hydrogen content being the organic components while water is described as moisture in fuel. Ultimate analysis can be commonly expressed as follow. (National Renewable Energy Laboratory, 2014)
= + : + B + i + j + =@ + h4ℎ + k6A45l.2 = 100% [13]
3.1.2
Proximate analysis
It differs from the ultimate analysis in terms of explaining the composition of biomass, as it does not present the content of basic elements only. The proximate analysis explains the composition of biomass taking in consideration the gross components such as moisture, ash, volatile matter and fixed carbon. (National Renewable Energy Laboratory, 2014).
nAo23 7;.p6Z + ?6@;5A@2 J;552. + h4ℎ + k6A45l.2 = 100% [14]
Moisture and ash content as explained by proximate analysis are of the same content as described in the ultimate analysis. However, according to proximate analysis, the heated fuel released volatile matter as condensable and non-condensable vapors. According to proximate analysis, char is produced as a residue after the devolatilization process. It contains carbon dioxide as solid carbon, as well as ash and some volatiles. (Basu, 2010)
3.2
Model
The model of GoBiGas process is build using process simulator Aspen Plus v7.3. Aspen Plus is a computer-based software package which provides services for process industry and evaluation of designs. The software has a built-in database of a wide variety of components such as heat exchangers, reactors, pumps and many other essential structures of the gasifier. This program is used to do steady state simulation (Yu, 2013).
The simulation provides the process information such as flows, heat, pressure, temperature and composition of gas throughout the process. The main assumptions and simplifications of this model are as following (Doherty, Reynolds, & Kennedy, 2014):
• Isothermal and steady state operation. • Atmospheric pressure (1 bar).
• Pressure drops are neglected. • Char is 100% carbon (C).
• All fuel bound N2 is converted to NH3.
• All fuel bound sulphur (S) is converted to H2S.
• All fuel bound chlorine (Cl2) is converted to HCl.
22 • Tar formation is not considered.
• A heat stream is used to simulate the heat transferred by the circulation of bed material between the gasifier.
• Heat loss from the gasifier is neglected. • Lower heating value of biomass.
• The Peng-Robinson equation of state modifications is selected as the property method for the model.
3.2.1
Fuel handling and drying
The biomass steam (BMS1) is identified as a non-conventional stream using Appendix B as a reference. The proximate and ultimate analysis are presented in Table 2. The lower heating values (LHV) of biomass is identified with the DCOALIGT and HCOALGEN property models. These property model helped in estimating biomass enthalpy of formation, specific heat capacity, and density based on the proximate and ultimate analysis (Doherty, Reynolds, & Kennedy, 2014). The system’s pressure is maintained in such a way that no pressure drop must occur in the model. The conditions of all unit operation blocks and feed streams are set to 1 bar (no pressure drop in the system). During the process, the non-conventional biomass was converted into the conventional component using reactor RYield (SPLIT1). The following figure 4 describes this process.
Figure-4: Decomposition of non-conventional componet in (BMS1) stream into conventional components in stream (ELASH1) in Aspen Plus
Drying biomass decreases the energy demand in the gasifier but increases the demand for steam of reactions.
23
3.2.2
Gasification and combustion
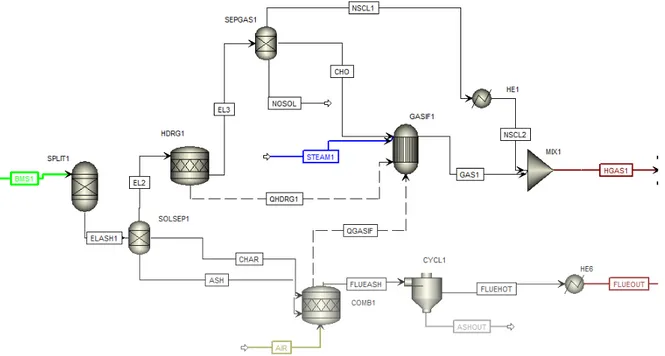
The overall gasification and combustion process of GoBiGas process is modeled in Aspen Plus and can be seen in Figure 5.
Figure 5: Gasification and Combustion simulation in Aspen Plus
3.2.2.1. Combustion
The combustion process is modeled using RStoic reactor (COMB1) ash and char are directed to the combustor. The combustion air enters the reactor at 25℃ and mole fraction is specified as 0.79 N2 and 0.21 O2. (Doherty, Reynolds, & Kennedy, 2014). The char and air reacted in
Rstoic reactor to generate heat for gasification are transferred by the heat stream (QGASIF). In Rstoic reactor, no reactions are specified. The chosen air-fuel ratio ensures the complete combustion of char, therefore, the stream contains only CO2, O2, N2, and ash. For separation of
ash SSplit block (CYCL1) is used. The simulated combustion process in Aspen Plus can be observed in Figure 6.
24
Figure 6: Combustion process with in stream and out coming streams in Aspen Plus
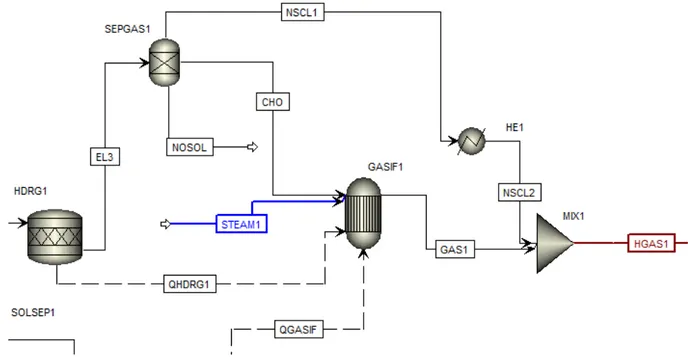
3.2.2.2. Gasification
The gasification process is modeled using reactor RGibbs (GASIF1).The material stream which contains all fuel bound N2, S2 and Cl2 is transformed in the reactor RStoic (HDRG1).
The enthalpy change due to the process in the RStoic reactor is transferred to the RGibbs reactor by the heat stream (QHDRG1). For the separation of NH3, H2S and HCl from the fuel
is separated by block Sep (SEPGAS1). The exit stream from the separator with primary fuel is fed to the gasifier. The steam is supplied for gasification. The mass flow rate of stream (STEAM1) is varied depending on the quality of syngas produced. The block Mixer is used to mix back in the preheated NH3 H2S and HCl separated before gasifier. The simulated
gasification process in Aspen Plus can be seen in Figure 7.
25
3.2.3
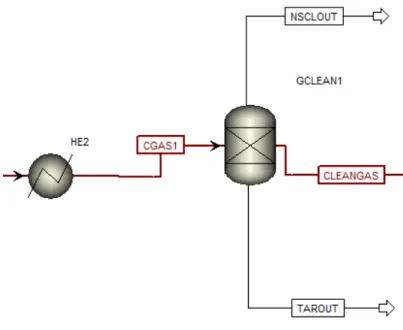
Gas cleaning
After the gasification the syngas from the gasifier it is cooled down with block Heater (HE2). For the cleaning purpose of the syngas from the gasifier block Sep (GCLEAN1) is used which remove all sulphur and nitrogen compounds and solids. The cleaning process simulated in Aspen Plus can be seen in Figure 8.
Figure 8: Cleaning of Gas in Sep (GCLEAN1) in Aspen Plus
3.2.4
Gas upgrading
The gas upgrading process consists of the reaction of the water gas shift, methanation, as well as separation of gases to obtain an end product with mainly CH4. The process can be seen in
Figure 9.
Figure 9: Gas upgrading process simulated in Aspen Plus
Clean cold gas is compressed to 6 bars with block Compr. Compression increases the temperature of the stream. For cooling of the stream to obtain a temperature for water gas
26
shift reaction block Heater (HE3) is used. In Heater 6 bar pressure is used. According to Porubova (et al., 2011), the pressure depends on the network pressure demand. Higher pressure is beneficial for the methanation reaction(optimum at about 30 bar).
3.2.4.1. Water gas shift reaction
Water-gas shift reactor upgrades the hydrogen to carbon monoxide for a successful methanation reaction. Water gas shift reaction is modeled by RGibbs reactor (WGS). The simulation of water gas shift reaction can be seen in Figure 9.
3.2.4.2. CO2 Removal/Scrubber
Removal of carbon dioxide takes place in a separator to purify the gas before methanation, as shown in Figure 9. The scrubber for CO2 removal is modeled using Sep block.
3.2.4.3. Methanation
The pre-heated mixture enters RGibbs reactor where methanation occurs. For heating of the mixture, the block Heater is used and the temperature is kept at 250°C. After methanation, wet gas is cooled to remove condensed water in block Heater after which additional drying follows in block Sep (DRYER) separator. The methanation process can be seen in figure 9.
3.3
Efficiencies
The two efficiencies used in the evaluation of the process of gasification are the cold gas efficiency (ƞrs) and the thermal efficiency of the plant (ƞV). The energy flows going into and
leaving the process of gasification are required to calculate the efficiency of the process.
3.3.1
Cold gas efficiency
The energy efficiency of the process of gasification is the ratio between the syngas energy in the stream leaving the gasifier and the biomass energy fed into the process. PG (product gas) contains CO2, CO, H2 and traces of N, S and Cl bound components (Barrera, Salazar, &
F.Pérez, 2014). The equation used to calculate the cold gas efficiency can be seen in Equation 15.
ƞrs =ṁ ṁvwxvwyz{vw