No. 68 ~ 19.82 . " ' _ . . . * 7 _ *" " . Statensväg-loch trafikinstitut (VTI) - 58101 linköping . ,.
» y '- . _ ' - ' . ' ' ' . ~ A National Road &Traffic R esearcfh Institute-958101 linköping-Sweden
f VthheEffectsof
SpeedL|m|tsonTraf cAcadents
Sigg/finSweden
,
,
. by
GoranN||sson
.
he|anuenceonS
peedandFuel
nsumptlon - - ' *
_ ofhangedSpeedlelts
-*
; ' då I ' Udrunaber:
_ ,
..
»
_
"iquulpmentforMeasurm:
f-ehlcleSpeeds _ .
'
..__j_Å,-?Å_7'.; ...Repr|nts
ofpaperspresentedattheInternatmnalOECDSymposmm
.;
&
,_
_
'TheEffet"? "silof Speederltson Traf cAccndents
&TransportEnergyUse
.. fjf i' f ' '
_"
Iublm,IrelandOctober 6 81981
_ _ -
» _ .
N0. 68 ' 1982
68
Statens väg- och trafikinstitut (VTI) - 581 01 Linköping
National Road &Traffic Research Institute - S-581 01 Linköping - Sweden
The Effects of Speed Limits on Traffic Accidents
in Sweden
by Göran Nilsson
The Effects of Speed Reduction in Coordinated
Traffic Signal Systems
by Ulf Hammarström
The Influence on Speed and Fuel Consumption
of Changed Speed Limits
by Gudrun Öberg
Equipment for Measuring Vehicle Speeds
and Journey Times
by Christer Dahlquist
Reprints of papers presented at the International OECD Symposium The Effects of Speed Limits on Traffic Accidents &Transport Energy Use';
Dublin, Ireland, October 6 8 1981.
C O N T E N T S
THE EFFECTS OF SPEED LIMITS ON TRAFFIC ACCIDENTS IN SWEDEN
by Göran Nilsson
Abstract Background
Traffic safety results
Vehicle speeds and accident rates
Relationship between accident rate and speeds Literature
THE EFFECTS OF SPEED REDUCTION IN COORDINATED TRAFFIC SIGNAL SYSTEMS by Ulf Hammarström Abstract Background Purpose Method Results
THE INFLUENCE ON SPEED AND FUEL CONSUMPTION OF CHANGED SPEED LIMITS by Gudrun öberg
Abstract Background
Measurements
Result from speed measurements Fuel saving calculation
References
EQUIPMENT FOR MEASURING VEHICLE SPEEDS AND JOURNEY TIMES by Christer Dahlquist Abstract Background General description Principle ll l2 l2 l2 l3 l5 l6 l6 16 l9 22 23 24 24 26
The effects of speed limits on traffic accidents in Sweden
by Göran Nilsson
National Swedish Road and Traffic Research Institute (VTI)
5-581 01 LINKÖPING Sweden
ABSTRACT
Speed limits differentiated according to the standard of the roads have existed in Sweden since 1968. In the course of these trials, the entire road network has been regulated by
speed limits indicated by road signs, with roads of good standard being permitted higher
speed limits than roads of poor standard. The speed limits tested on motorways are 130
and 110 km/h. On two lane roads the speed limits tested were 110, 90 and 70 km/h. The
speed limits represent maximum limits.
In the beginning, the objective with speed limits was traffic safety but in 1979 the
Government decided, only for reasons of saving energy, that the maximum speed limit
should be 90 km/h during the summer period.
Concerning the total number of accidents each reduction in the speed limit has been found to be associated with a reduction in the number of accidents as well as a decrease
in resultant injuries.
The change of the speed limit from 90 to 110 km/h on two lane road of very high standard has led to an increase in the accident rate - with about #0 96. Reduction in the
speed limit from 90 to 70 km/h has led to a decrease in the accident rate corresponding
to 22 96 and the reduction in the speed limit on motorways from 130 to 110 km/h has led to a decrease in the accident rate with 30 96. Speed measurements carried out in
connexion with the various trials showed that a reduction in the speed limit with 20 km/h
led to an average speed reduction of 6 to 8 km/h.
The effects of speed limits on traffic accidents in Sweden
by Göran Nilsson
National Swedish Road and Traffic Research Institute (VTI)
S-581 01 LINKÖPING Sweden
Background
During the Christmas holiday 1960 and the New Year holiday 1960/61 speed limits were
introduced for the first time in Sweden outside built-up areas.
The background for that measure was an increase in fatal accidents in November 1960. Until the change from left to right hand traffic in 1967 this kind of temporary speed limits were expanded to other holiday periods and to summer periods. In wintertime
holidays the Speed limit was always 80 km/h and during other holiday periods 90 km/h (in
a few cases 100 km/h). General speed limits were also used during a period after the
change to right hand traffic (60, 70 and 80 km/h). From 1968 trials with speed limits
differentiated according to the standard of the road have been run in Sweden.
In these trials the entire road net work has been regulated by speed limit indicated by
road signs, with roads of high standard being permitted higher speed limits than roads of poor standard.
The speed limits tested were on motorways 130 and 110 and on two-lane roads 110, 90
and 70 km/h.
For the summer 1979 the government decided that the maximum speed limit should be 90
instead of 110 km/h in order to save energy.
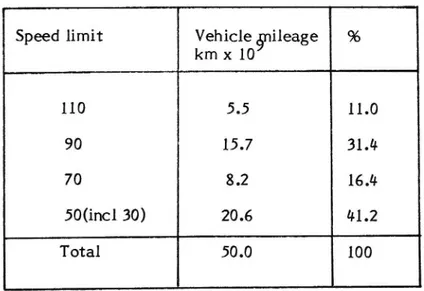
After this, the speed limit has remained unchanged during 1980 and 1981. The distribution of vehicle mileage on different speed limits is illustrated in the table below.
Table 1. Distribution of total vehicle mileage in Sweden on different speed limits 1980 1981.
Speed limit Vehicle §nileage 96 km x 10 110 5.5 11.0 90 15.7 31,4 70 8.2 16.11 50(incl 30) 20.6 01.2 Total 50.0 100
Traffic safety results
All changes of speed limits decided by the government have been investigated. As most of this decisions were short termed it has not been possible to make planned experiments
with speed limits. However, the main results indicate are that the traffic safety situation has been improved when the speeds has decreased, as a result of an introduction
of a speed limit or a change in speed limit. The Opposite experience is also valid - if
speeds increase the traffic safety situation deteriorates.
In the following figure the results on accident rates (number of police reported accidents per million vehicle kilometers) in trials with differentiated speed limits 1968 - 1972 on
experimental roads and control roads are illustrated.
Accident rate NO Speed km/h lelt 9G Before After Figure l. No Speed åm9h lelt
l
l
Experimental Roads Control RoadsAccident rates on experimental and control roads before and after changes of Speed limits 1968-1972 in Sweden.
After the introduction of the speed limits of 90 and 110 km/h instead of unrestricted
speed the accident rate decreased with 16 96 on 90-roads but increased with 4 96 on
110-roads.
A change in the speed limit from 90 to 110 km/h on two-lane roads of very high standard and with a low traffic volume resulted in an increase in accident rate with over 40 96 and on two-lane roads in northern Sweden of good standard and with a low traffic volume the accident rate increased with 6 96.
A change in the speed limit from 90 to 70 km/h resulted in a reduction in the accident
rate with 22 96 and a change in the speed limit from 130 to 110 km/h on motorways
resulted in a reduction in the accident rate with 30 96.The control roads which were included in the different experiments show that when the
speed limit of 90 km/h remained unchanged, no significant change in the number of
accidents between the periods studied could be found. As the method of analysis is based on before and after-studies, other traffic safety measures can also influence the results. This means that the changes cannot be attributed only to the changes in speed limits. This can partly be seen in the results obtained for the control roads, the study of which was made in order to illustrate the influence of other factors between the periods
studied. The changes in accident rate on the control roads were not in any case of the same size as those obtained on roads for which the speed limit was changed between the
two periods.
The Speed limit reductions on two-lane roads reduced the number of personal injury accidents more than the total number of accidents. Whenever possible changes in the number of persons killed or injured was also studied. These changes in per cent were
always larger than the corresponding figures for the number of personal injury accidents which illustrates the injury-reducing effect of speed restrictions.
Regarding the accident types studied nothing was found which showed that any particular
accident type changed more than the others. The effect on the different accident types
of the speed limits agree on the whole with the effects obtained for the total number of
accidents.
The effect of speed restrictions seems to be of the same size during both day and night. There is, however, some evidence - when control roads were available - that a change in
speed limits, especially from 90 to 70 km/h, had a larger effect on the number of accidents during the winter half year than during the rest of the year.
As regards weekdays (Monday-Friday) and weekends (Saturday-Sunday) the results show
that the effect of the studied speed limit changes studied was largest for weekends.
As regards road width, the experiments did not supply sufficient information on which conclusions could be drawn regarding the effect on accidents due to the fact that the
different speed limits are related to the road width.
The speed measurements carried out in connexion with the different experiments show that a lowering of the speed limit by 20 km/h resulted in an average reduction of real
speeds by 6 to 8 km/h. This means that the lower the speed limit the more drivers exceed this speed limit.
The next figure is an attempt to compare the traffic safety situation in the summer 1979 with the summer 1978 as a result of the reduction of the maximum speed limit from 110
to 90 km/h.
number of accidents 1979 _ 1) hunger of accidents 1978
Change in percent = 100 (
TOTAL NUMBER OF EATAL AND SEVERE + 20 _- PERSONAL INJURY PERSONAL INJURY
ACCIDENTS ACCIDENTS + 10 _ 40 _ _50_ 60 ' _70.. 110 90 90 90 70 70 110 90 90 90 70 70 110 90 90 90 70-70
Figure 2. Change in percent of police reported personal injury accidents between the two periods 1978-06 21--10-15 and 1979-06-21--10-15 for roads where the
speed limit was changed from 110 to 90 km/h (110 90) roads with the speed
limit 90 km/h during both periods (90-90) and roads with the speed limit 70
km/h during both periods (70-70). The presented intervals are 95 percent
confidence intervals for the change in percent.The comparison between police reported accidents with personal injury on the national
roads during the periods l978-06-21--10-15 and 1979-06-21--10-l5, shows that the
total number of personal injury accidents decreased with 12 %. The number of fatal accidents decreased with 20 96 and the number of severe personal injury accidents
(including fatal accidents) with 12 96.
On roads where the speed limit was changed from 110 to 90 km/h the total number of
personal injury accidents decreased with 25 96. The reduction is significant.
On roads which both periods had the speed limit of 90 km/h the number of police
reported personal injury accidents decreased with 13 96 (significant) and on roads whichboth periods had the speed limit of 70 km/h the decrease was 6 96.
Concerning fatal accidents the decrease on 110-roads was 52 96 (significant) on 90-roads
13 96 and on 70-roads 12 96.The decrease of fatal accidents and severe personal injury accident was on llO-roads
34 96 (significant), on 90-roads 16 96 (significant) and on 70-roads 5 96.
Regarding accident types the single accidents decreased with 20 96 on 110-roads and
10 96 on 90-roads. The reduction of multivehicle accidents on 110-roads and 90-roads was 25 96 and on 70 roads 6 96.
The number of accidents involving unprotected road users and the accident group "varia" have the highest reductions on llO-roads, while the changes on 90- and 70-roads are small.
Since the amount of traffic has been the same during the two periods, the changes in
number of accidents presented correspond to the changes in accident rates on the national road net work between the two periods.
Speed measurement made by the National Swedish Road and Traffic Research Institute
before and after the 21th of June, which has been reported in Meddelande 190, VTI, 1980, shows that the mean speed for private cars during the first part of the speed limit period
(to August) was 12 km/h lower on motorways than before the change of the speed limit
(from 107 to 95 km/h). On two lane 110-road the mean speed decreased with 7 km/h
(from 98 to 91 km/h). These differences are significant.
Vehicle speeds and accident rates
In 1975 and 1976 the National Road and Traffic Research Institute carried out random
measurements of vehicle speeds and traffic flows for different vehicle categories on the
National road network in four counties of Sweden.
Table 2 shows the median speeds as registered over a twenty-four-hour period and the
TableZ Median speeds, proportion of vehicles exceeding the speed limits for different road widths.
Speed limit Passenger cars Lorries Motorcycles
/ Median % exceeding Median % exceeding
Median % exceeding
Road Wldth Speed speed limit speed speed limit
speed speed limit
km,/h
km/h
km/h
70/6,5 77 75 75 73 84 7490/6,5
81
23
74
4
']
90/8 9 87 38 78 > 95 63 90/13 94 66 81 19 I110/13, ML
98
17
80
fl 104
37
llO/MV 107 40 81 = expressroad ML MV motorwayMedian passenger car speeds are on an average 30 km/h higher on motorways than on
70 km/h roads of a width of 6,5 m whereas lorry speeds do not vary appreciably
according to road standard or speed limit. Motorcycles are constantly driven at higher speeds than passenger cars on 70 and 90 km/h roads.
A comparison between passenger car speeds in daylight and in darkness shows that on the
investigated roads passenger cars are driven at higher speeds in the dark than in daylight where there are 70 and 90 km/h speed limits. The median speed in the dark was on an
average lkm/h higher, the 75th speed percentile 2 km/h higher and the 90th speed percentile over 3 km/h higher than in daylight. Lorry speeds are independent of light conditions.
For mopeds, a median speed of 31.5 km/h was obtained. The proportion of mopeds
driving at speeds over 30 km/h was 60 %. On the basis of police-reported road accidents
in the investigated counties and of the vehicle mileage expressed in million vehicle kilometres, the accident rates of the different vehicle categories was analysed in terms
of type of accident, light conditions and season. The table below shows the number of passenger cars involved in road accidents per million passenger car kilometres and the number of lorries involved in road accidents, per million lorry kilometres, distributed on
Table ;. Accident rates for passenger cars and lorries for different light conditions and season
Passenger cars Lorries
Daylight Darkness Daylight Darkness
Summer 0.67 1.44 0.56 0.72
Winter 1.00 1.64 0.97 0.92
On the question whether there is an connection between speeds and accident rates for passenger cars, the results obtained from the speed measurements and the accident analysis demonstrate that passenger car speeds are not adjusted to external conditions, expecially darkness conditions. No matter how driver categories may vary from day to night, the higher speeds in darkness as compared with those in daylight conditions, which
were observed on roads of low or normal standard must be regarded as a contributory cause for the high accident rate, especially of single-vehicle accidents, that is
demonstrated in the case of passenger cars driving in darkness. Other factors playing a
role are of course fatigue, alcohol, etc.
Motorcycles was the vehicle category that had the highest speeds. The greatest speed
gaps, however, were found to exist between mopeds and cyclists, on one hand, and motor vehicles, on the other.
Since the investigation refers to the National road network - mainly rural roads the
share of unprotected road users could only be relatively small. Nevertheless, the results
show that accident rates for motorcycles, m0peds and bicycles are significantly greater than for cars.
Relationship between accident rate and speeds
The above results on accidents from different changes of speed limit has been strengthened by speed measurements before and after the change of the speed limits and
in the case that the accident rates have decreased the speeds in terms of median speed or mean speed has decreased. In most cases also the speed distribution pattern is
changed.
The results from different trials outside built-up areas when accident and speed analysis
have been made, indicates that the accident rates are strongly dependent upon the
The experience is also that the severity in the accidents changes. These two effects of decreasing speeds can be expressed by following relationships for different accident
p0pulations.
4
(Fatal accident rate) _ Evl ) (Fatal accident rate)2 _ V2V 3
(Personal injury accident rate)
_
( l )
(Personal injury accident rate)2 _ V2
V 2
(Police reported accident rate) _ ( l )
(Police reported accident rate)2
"
V
2
(1 and 2 stand for different speed limits (regulations)). This means for example that a
decrease in median speed from 100 to 90 km/h will decrease the fatal accident rate with 36 96, the personal injury rate with 27 % and all police reported accident rate with 19 %. This example gives a rough picture of the results of speed limits upon accidents and speeds in Sweden.
lO
Literature
Effects of Speed Limits Outside Bulit-up-Areas. The National Swedish Council of Road
Safety Research Bulletin 10, 1971.
Trials with Differentiated Speed Limits during the years 1968-1972. National Road & Traffic Research Institute VTI Report No 117 A 1977. (abbreviated version of RAPPORT No 88, 1976).
Accident rates and vehicle speeds on rural roads, 1975-1976. National Road and Traffic Research Institute, VTI Rapport Nr 186, 1979.
Change of maximum speed limit from 110 to 90 km/h during the summer period 1979 in
H
The effects of speed reduction in coordinated traffic signal systems
by Ulf Hammarström
National Swedish Road and Traffic Research Institute (VTI) 5-581 01 LINKÖPING Sweden
ABSTRACT
TRANSYT is a method which is frequently used for co-ordinating traffic signals. The method can be used in order to find the signal settings which for example minimize fuel consumption. The institute has used the method in two ways:
0 To study how much fuel that can be saved by adjusting the signal settings in order to
minimize fuel consumption,
0 To study the effects of lowered speed limit in a system of co-ordinated traffic
signals.
A lowering of the speed limit from 70 to 60 km/h reduced the fuel consumption by 5 %.
This was found to be the only case in which, for speed limits < 70 km, lowered speed
limit resulted in lower fuel consumption. '
The speed level in signal systems can also be influenced by advisory speed signals giving the speed with which a stop at the next traffic signal can be avoided. The fuel consumption was measured in an experimental situation. The fuel measured when driving according to the advisory speed signals was compared to the consumption when the speed limit was followed. When driving according to the speed signals the fuel consumption
12
The effects of speed reduction in coordinated traffic signal systems
by Ulf Hammarström
National Swedish Road and Traffic Research Institute (VTI)
5 581 01 LINKÖPING Sweden
Background
Fuel consumption increase with speed in the speed intervall > 50 km/h and decreases with speed in the intervall < 50 km/h. In coordinated traffic signals the resulting fuel
consumption also depends upon other factors than speed, for example stops, speed
changes and idling time. The resulting effect of changed speed depends on the influence
on stops, speed changes and idling time. A critical limit for the speed is 50 km/h. At this point the slope of the curve for fuel consumption versus speed change sign. If the number of st0ps, speed changes and idling times do not rise a lowered speed limit to a value 2 50 km/h should always decrease fuel consumption.
Two ways of lowering the speed are changed speed limits and advisory speed signals. The first method is simple and cheap to introduce. The second is more complicated and
expensive. Speed signals exist in three coordinated traffic signal systems in Sweden.
Purpose
Examine the effect on fuel consumption when decreasing speed limits in signal systems. Two existing speed limits, 50 and 70 km/h, will be examined. In Sweden, about 15 96 of
all coordinated traffic signals have a speed limit of 70 km/h. The rest has 50 km/h.
The effect of speed signals can be defined in different ways. One way is to examine fuel consumption for the traffic in two situations; in one with the signals not working and
one with the signals in operation. The problem with a study like this is to measure fuel
for representative vehicles in the traffic flow. In this study the purpose instead is to
compare fuel consumption for an experiment vehicle in two situations. The situations
are, respectively, following the speed limit and following the speed signals.
Method
Transyt is a computerized method which frequently is used for co-ordinating traffic signals. The method can be used in order to find the signal settings which, for example, minimize fuel consumption. The institute has used the method in two ways:
0 To study the amount of fuel that can be saved by changing the signal settings in order
to minimize fuel consumption.
13
The effect of lowered speed limit is only examined by means of calculations with Transyt. Field measurements have only been performed for existing speed limits in order
to validate the program.
If the existing speed limit is V and the alternative studied is V - then speeds on all
links in the system has been mulgiplied by V /VO. For all speed limilts the existing V and
the alternatives V - fuel consumption have 1been calculated for the signal strategy which
minimizes fuel consumption at that certain speed limit.
Advisory speed signals have been examined in an experimental situation. The driver of the experimental vehicle was instructed to change between following the speed limit and to following the speed recommended by the speed signal. The speed recommended by the
speed signal means no stop at the next traffic signal. Field measurements were performed in two test areas. The speed limit in both areas was 70 km/h.
Results
The fuel consumption increased when the Speed limit was lowered beneath 50 km/h.
Speed limit Percent change in
km/h Fuel Journey Stops
time From To
50 40 + 5 + 11 + 7
50 30 + 14 + 28 + 16
In only one case the fuel consumption decreased when the speed limit was lowered, 70 to
60 km/h.
Speed limit Percent change in
km/h Fuel Journey Stops
time Forn To
70 60 - 5 + 9 + 7
14
A driving manner according to the speed signals in all cases resulted in lower fuel
consumption compared with following the speed limit. This is shown in the table below.
Testroute
Direction
Change (%), following speed signals
compared to following the speed limit
Fuel Journey Stops time A l l - 1.7 - 3.8 ' l#.5 A l 2 -ll.O + 8.5 -l6.5 A 2 l - 7.9 A 2 2 - 9.8 B 1 l SA - 3.6 -46.1 B l 2 -ll.5 - 3.6 -34.0 B 2 l 8.0 -12.4 -34.5 BZ 2
-l7.9
+ 3.9 -64.0
15
The influence on speed and fuel consumption of changed speed limits (110 to 90 km/h)
by Gudrun Öberg
National Swedish Road and Traffic Research Institute (VTI) 5-581 01 LINKÖPING Sweden
ABSTRACT
The speed limit in Sweden was reduced to 90 km/h during the period June 21 - October
15, 1979, on those roads which earlier had a speed limit of 110 km/h. This reduction was one of the measures taken by the Government in connection with the oil crisis.
The National Swedish Road and Traffic Research Institute was commissioned by the Ministry of Communication to measure the influence of the reduced speed limit on
traffic speed. The commission also included a calculation of the effect of the speed
limit change on the total fuel consumption of the country.
Speed measurements were carried out both immediately before the reduction and three times after the reduction during the summer. The last measurement, however, was reduced to the motorways only.
The speed measurements showed that the average speed of passenger cars on motorways went down approximately 12 km/h (from about 107 to about 95 km/h) immediately after the reduction of the speed limit. This reduction remained during August, but around October 1 the average speed had increased to about 100 km/h.
On highways, which earlier had a 110 km/h speed limit, the average speed of passenger cars was reduced some 7 km/h (from about 97 to about 90 km/h) in connection with the
reduction of the speed limit to 90 km/h. This reduction also remained during August. On roads which all the time had the 90 km/h speed limit, the average speed of passenger
cars during the period of reduction decreased by some 2 km/h (from 89 km/h to 87 km/h).
This decrease is not statistically significant.
The fuel saving calculation is based upon many simplified assumptions and is to be
regarded more as a calculating example. The result of this is that the speed limit
reduction has led to a fuel saving of between 12 and 29 million litres during the whole
period of restriction. A reduction of 12 million litres assumes that the obtained effect only derives from the former 110-roads, while a reduction of 29 million litres assumes
that the reduced speed limit also has lowered the speed on 90-roads as well as on 70
roads.
If the fuel saving during a whole year is calculated from the noticed observance of the speed limits during the summer period, the decrease in fuel consumption would amount to between 30 and 88 million litres or 1 2 96 of the total fuel consumption in the country.
16
The influence on speed and fuel consumption of changed speed limits (110 to 90 km/h)
by Gudrun Öberg
National Swedish Road and Traffic Research Institute (VTI) 5-518 01 LINKOPING Sweden
BACKGROUND
The Speed limit in Sweden was reduced to 90 km/h during the period June 21 - August 31,
1979, on those roads which earlier had a speed limit of 110 km/h. This reduction was one of the measures taken by the Government in connection with the oil crisis.
The National Swedish Road and Traffic Research Institute (VTI) was commissioned by the Ministry of Communication to measure the influence of the reduced speed limit on traffic speed. The commission also included a calculation of the effect of the speed limit change on the total fuel consumption of the country.
During August the Government decided to prolong this speed limit until October 15,
1979. During this time there was a discussion in the neWSpapers whether Sweden had to
save oil and therefore if a lower speed limit than usual was justified on some roads. The
Opinion was that the traffic speed level had been higher after the prolongation. Therefore VTI was commissioned by the National Swedish Road Administration (VV) to
measure the traffic speed level on motorways.
MEASUREMENTS
During 1975 and 1976 VTI made a great many traffic measurements in some counties to
learn how the traffic speed changes when traffic flow, road width and speed limit changes (1,2), traffic speed was measured on randomly chosen roads. Some of those
roads were subjectively chosen for this study. The road types are as follow:
A.
3 motorways which had the speed limit changed from 110 km/h to 90 km/h.
B. 5 highways, for which the speed limit changed from 110 km/h to 90 km/h, road
width 212 m.
C. 5 highways which had a speed limit of 90 km/h all the time.
Measurements on roads described under C were made to obtain reference data.
Measurements were made once on all roads before the reduction of speed limit
(measuring time 1) and twice after (measuring times 2 and 3). On motorways there was
also a fourth measurement during the prolongation. For each time and each place the
duration of the measurements were one day and one night and for each road the
measurements were made on the same day of the week.
RESULT FROM SPEED MEASUREMENTS
The results from the speed measurements are shown in the tables below. The average speed of passenger cars on motorways went down approximately 12 km/h (from about 107
to about 95 km/h) immediately after the reduction of the speed limit. This decrease
remained during August, but around October 1 the average speed had increased to about 100 km h.
17
T_algLel. Results from speed measurements in the summer 1979. For each road type
and period there are average speed (v) and standard deviation (SD) in km/h and number of cars (n). M 1 : lst measuring time and so on.
Passenger car Road- M 1 M 2 M 3 M4 type V SD n V SD n V SD n V SD n A 107.5 14.0 25566 95.0 10.5 29287 95.5 10.9 33958 100.6 11.9 26441 B 97.8 13.0 25086 90.0 9.6 30724 90.9 10.3 27365 C 89.4 12.0 16477 87.3 10.4 21190 87.7 10.3 20363
Passenger car with trailer. Highest permitted speed 70 km/h
Road M 1 M 2 M 3 M 4
type V SD n V SD n V SD n V SD n
A 85.4 10.9 1062 80.4 9.3 1779 80.5 9.2 1748 88.0 10.4 621
B 79.7 10.6 1119 76.8 8.6 2441 78.7 9.7 1290
C 79.5 9.8 648 76.2 8.7 1494 77.6 8.6 911
Heavy vehicles. Highest permitted speed 90 or 70 km/h
Road- M 1 M 2 M 3 M 4
type V SD n V SD n V SD n V SD n
Ax 91.7 11.6 1349 89.5 9.7 1247 88.7 10.3 1348 90.1 10.7 1267
B
87.4 11.6 1090 86.1 9.6 900
85.6 9.7 1045
CXX 83.4 11.3 802 83.8 9.5 726 83.3 9.1 774
Heavy vehicles. Highest permitted speed 70 km/h
Road- M 1 M 2 M 3 M 4
type V SD n V SD n V SD n V SD n
A 83.8 8.8 3261 82.5 7.0 2778 81.0 7.0 2620 82.3 6.9 3238 B 83.2 11.7 2163 81.9 9.4 1786 80.1 8.4 1522
C 80.3 10.5 2129 80.8 7.8 1965 78.6 7.4 1562
x Trucks without trailer and buses. Highest permitted speed 90 km/h.
xx
Buses with highest permitted speed 90 km/h and trucks without trailer with
18
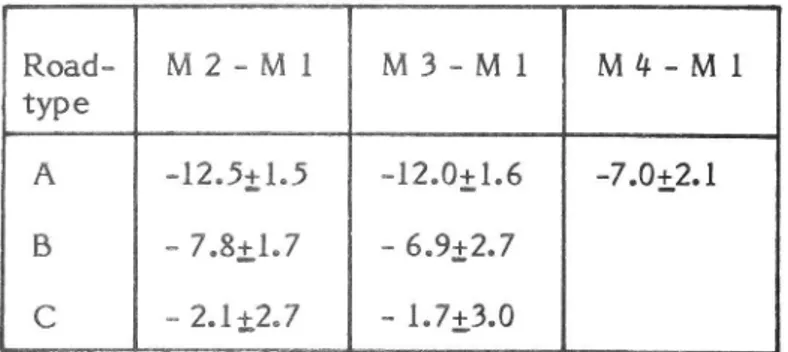
Table 2. Differences in average speed for passenger cars with confidence interval (95 %).
Road- MZ-an MB Ml Mil-Ml
type
A 12.5tl.5 «-12.03L_l.6 -7.012.1 B »» 7.83107 «- 6.9127
C
21+2.7 17+30
On highways which earlier had a 110 km/h speed limit, the average speed of passenger
cars was reduced some 7 km/h (from about 97 to about 90 km/h) in connection with the
reduction of the speed limit ot 90 km/h. This reduction also remained during August. On roads which all the time had the 90 km/h speed limit, the average speed of passenger cars during the period of reduction decreased by some 2 km/h (from 89 km/h to 87 km/h). This decrease is not statistically significant (95 96).The standard deviation in the speed distribution and the difference between speed distri-butions of cars and trucks are smaller under the period with lower speed limit. That this together with the lower speed level will improve traffic safety is known from earlier
projects.
The higher level of speed in October could be a result of the discussion in the news papers. It was said that perhaps it was not necessary to save oil and that the speed limit would increase to 110 km/h on October 16. Therefore some drivers of passenger cars
may have increased their speeds before the speed limit once again became 110 km/h.
Passenger cars with trailer or caravan and heavy vehicles ( >3.5 ton) have lower speed
limits (70 or 90 km/h) because of the vehicle type and therefore they were not directlyaffected by the change of the general speed limit. Table 1 shows that heavy vehicles
lowered the average speed with about l 3 km/h but this difference is not statistically
significant (95 96).
Passenger cars with trailer or caravan have a lower average speed during the vacation
period. This depends upon the higher proportion of caravans together with the fact that
I9
FUEL SAVING CALCULATION
The calculation of fuel saving is an arithmetical example, which assumes many simplified
premises, for example that the lower speed limit has not changed the number and the distribution of traffic on different types of roads. The calculation of fuel saving is based
upon: 1.
3.
An estimate of passenger car mileage (number of vehicle kilometres) during the
period with lowered speed limit, on the roads where the speed changed because of
the lowered speed limit.
A relation between fuel consumption and speed for a typical swedish passenger
car as shown in VTI-report 74 (3)..
Measured speeds before and after the lowering at the speed limit.
This information is used to estimate the mileage of passenger cars.
The annual vehicle mileage for all vehicles (pair of axles). Information from the Road Data Bank.
Changes in vehicle mileage during 1973 79. Information from the National
Swedish Road Administration (VV)
Variation in vehicle mileage during a year. Information from points where VV
counts axles all year round.
The average number of axles for heavy vehicles. Information from speed
measurements done by VTI.
The variation in mileage for heavy vehicles during a year. Information from speed measurements done by VTI.
In VTI-report 74 there is a detailed description of the method of calculation. Two
alternative calculations were made of the fuel saving potential, for two levels of speed
Ta bl e 3. Calc ul at ed fu el sa vi ng . Ca lc ul at ed fuel sa vi ng Ro ad ty pe 21 -3 0 Ju ly Ju ne Au gu st Se p te m b e r 1-14 Oc to be r 21 Ju ne -14 Oc to be r A wh ole ye ar MI M I M l M I M I M I M I % of to ta l fu el co ns um pt io n in Sw ed en A. Mo to r wa y 1. 0-1. 2 2. 8-3. 4 11 04 90 km /h B. 2-la ne ro ad s 2 12 m 11 0-3 90 k m / h 0. 3-0. 5 1. 0-1. 4 D. 2-lane ro ad s <1 2 m No rt he rn S w e den 11 0-99 0 k m / h 0. 3-0. 4 C. 90 -r oa ds 0 1. 0 0-3. 2 E. 70 -r oa ds 0-0.5 0-1. 7 2. 8-3. 3 0. 8 1. 2 0. 2-0. 3 0 2. 6 0 l. 4 1. 6-l. 9 OJ !-0. 6 0. 1 0. 2 0-1. 3 0-0. 7 0. 7-0. 8 0. 2-0. 3 0. 1 0-0. 6 0-0. 3 8. 8-10 .6 2. 8-3. 9 0. 7-1. 1 0-8. 7 04 .6 29 -3 5 2-3 O. 6-O.7
94
0.
05
0-0. 5 0-0. 3 Al l na ti on al Li l 3. 4 CA I-10 .0 ro ad s3. 8-8. 7 2. 14 .7 1. 0-2. 1 12 -2 9 0. 8-1. 9 M I : mill io n li tr es 20
Zl
l. The maximum alternative:
| The observed change in speed distribution on the road types A, B and C has been used.
o For road type D (Roads in Northern Sweden, road width 12 m, with a speed limit of 110 km/h before the lowering of the speed limit.) On these roads older results of the relation between speed, road standard and speed limit has been used.
. On road type E (speed limit 70 km/h) is assumed a decrease of the average speed
with 2 km/h (the same decrease as on roads with a Speed limit of 90 km/h).
2. The minimum alternative:
0 The observed decrease in speed on road type A and B is reduced by 2 km/h. The
motive for this is the observed decrease on roads that had a speed limit of 90
km/h the whole time. This decrease could be a natural seasonal variation.
o The assumed decrease on road type D is reduced by the same amount as road types A and B.
0 The decrease of the speed limit (110 to 90 km/h) is assumed to have no effect on
the speed on roads with a speed limit of 90 or 70 km/h (road types C and E).
The calculation for June, July and August is based on the speed results from measuring times 2 and 3 and the calculation for September and October is based on the result from
measuring time #. During the fourth time measurements were made only on motorways. The calculated fuel saving per passenger car kilometre is about 60 96 of the fuel saving
calculated for the period June 21 - August 31. The saving per passenger cars kilometre on the other road types is therefore reduced by 40 96 during September and October.
The results are shown in table 3.
The table shows that the lowered speed limit has saved 12-29 million litres. The uncertain in the estimate depends mainly upon the question whether the changed speed
limit from 110 to 90 km/h had an effect on roads with speed limits of 90 or 70 km/h the
whole time.
The calculated fuel saving would be 39-88 million litres for a whole year, which is about 1-2 96 of the total fuel consumption in Sweden. This calculation is based upon the measured speeds during June 21 - August 31.
This is a very simplified model of the reality. The relation used between speed and fuel
consumption is based upon tests where cars have been driven with different constant speed. mostly on plain and straight roads. In reality not only the level of speed influences the fuel consumption but also the standard of the road and the accelerations and retardations, when drivers adjust their speed to other cars and to the design of the
road. The model simplifications give an underestimate of the fuel consumption. The
simplified model will have less effect on differences between two levels.
Some present studies at VTI will show how the fuel consumption depends upon different factors of the road and the traffic. These projects will lead to better possibilities for making accurate calculations of how different speed limits influence fuel consumption.
22
REFERENCES
1. Measure points 1975-1976.
National Road and Traffic Research Institute. VTI Meddelande 90, 1978.
Vehicle speed on rural roads, 1975 -76.
National Road and Traffic Research Institute
VTI-report 155, 1978.
Summary in English.
Decrease in petrol consumption due to reduced speed limits. National Road and Traffic Research Institute
VTI-report 74, 1975.
23
Equipment for measuring vehicle speeds and journey times by Christer Dahlquist
National Swedish Road and Traffic Research Institute (VTI)
5-581 01 LINKÖPING Sweden
ABSTRACT
The speed measurement equipment, HM-78, is a camera system for measurement of
journey times and vehicle spot speeds. The information is stored in the picture taken of
the vehicle. This system was developed to meet the demands from the traffic division for a system for traffic measurements of roads with low traffic volumes as well as measurements during winter conditions.
The electronic unit registers the arrival time at the measuring point and the time it
takes for a vehicle to pass two detectors, the passage time. When the vehicle passes the
second detector it is photographed and both arrival time and passage time are displayed at the bottom of the picture. The electrical logic is passed, irrespective of the direction
of the vehicle. When only journey times are measured, it is possible to restrict the
information and only register the arrival time.
The HM-78 consists of a camera unit and an electronic unit. The camera unit was built with a super 8 camera as the central part. The logic which mainly is placed in the electronic unit, consists of circuits with low power consumption (CMOS). There is also
some external equipment for synchronization of two or more units.
Mist and formation if ice, which could cause problems, are both prevented since the
camera window is electrically heated.
Both rubber tubes and IR V-sensors have been used as detectors but any detector can be used as long as it gives a sufficiently distinct pulse for a vehicle passage.
The HM-78 was developed, constructed and produced at the institute. There are 10 complete units.
This paper describes the function and the construction of the HM-78 as it was during
1980.
24
Equipment for measuring vehicle speeds and journey times by Christer Dahlquist
National Swedish Road and Traffic Research Institute (VTI) 5-58101 LINKÖPING Sweden
BACKGROUND
The technique of using the photo as a medium of registration has long been used at VTI.
The most often used photographical equipment is the registration camera RK-l, which
was developed at the institute. The disadvantage with this camera, besides being a 16
mm camera which increases the costs compared to AN 8 mm ONE; is that it only functions for speed- or journey time measurements, when combined with the institute's traffic analyzer DTA-Z.
The filmstrip has to be co-ordinated with the print-out from the DTA-Z. The
HM-78-system has the advantage besides lower costs for film that all information about the vehicle exists in the frame of film. Thus it is possible to observe both vehicle type and
driving direction, when passage time and speed is read. As there was a tendency for a
strong increase in the number of commissions, and when it was an interest to observe
vehicles visually, it was decided in 1978 that the traffic measurement system described below should be developed. In 1980, ten complete units were in operation.
GENERAL DESCRIPTION
The registering speed indicator - PIM-78 is used for measurements of journey times and spot speeds. It is divided into two units, one unit with electronics and one camera unit built around a super-8-camera (figure 1).
7 ]] # Camera
Eiectronics
& Figure l.
25
During a vehicle passage the time of arrival is measured at the measurement point and the time it takes for the vehicle to pass two sensors, see figure 2. The arrival time and the passage time are both reflected at the bottom of a photo, which is taken when the vehicle passes the last sensor.
I V Sensors i
in?!
' ' ;Picture Electro 1,2,3,4,5 2,3,4 ) n'iCS ' v - \ \r1
7'
Camera Arrival Passage time time Figure 2.The logic makes it possible to take the picture, when the vehicle passes the second
sensor, irrespectively of the direction of the vehicle. After the picture has been taken,
the equipment is prepared for a new vehicle. If the vehicle is a long one, this will result
in several pictures of the same vehicle. To prevent malfunctioning of the logic there is a
criterium saying that the passage time has to be shorter than a certain time decided in
advance, the so called resetting time, or no picture will be taken. The options for the resetting time are 0.4, 0.8, 1.0, 2.0, 4.0 and 8.0 seconds.
These times translates into the following speeds, when the sensors are 5 metres apart. 0.4 sec 45.0 km/h 0.8 sec 22.5 km/h 1.0 sec 18.0 km/h 2.0 sec 9.0 km/h 4.0 sec 4.5 km/h 8.0 sec 2.25 km/h
26
The system can be used in two ways:
1. For registration of arrival and passage times with two sensors. The arrival time is registered with six digits and on accuracy of 0.1 sec; the passage time with four digits and a 0.001 sec accuracy.
2. For registration of only the arrival time with one sensor, where a sensor inpuls results in a picture. An accuracy of 0.001 sec can be obtained by using the positions used for passage time in 1.
In order to synchronize time in two or more units, they are set to zero at the same time. After this, they are transported to the measurement locations. The drift of the internal
clocks crystals in the different units is checked by using a synchronizing clock. This
clock, which in the future will be replaced by a newly developed synchronzing device
called KL SO, is placed in front of the camera and the time is registered in a picture together with the time of the internal clock. At the same time both data and spot
identification is photographed.
By a comparison with the synchronizing clock, it is possible to determine the time drift
of the different units. The time drift of the synchronizing clock can be neglected during
the time it takes to check the units in operation. Presently rubber tubes or IR -sensors are used as sensors, but the HM-78 is not solely restricted to these types of sensors, nor is the distance between sensors fixed. 5 metres is a commonly used sensor distance.
PRINCIPLE Sensors Å R//
HM
/
Freezing of . counterSetting
EEttlng
to zero O zero (manually) J ; I 2 3 4 5 6 I 2 3 4Clock for arrival time Ciock for passage time
Figure 3.
27
The HM-78 consists of two clocks (see figure 3). The clock for arrival times has a 0.1
sec accuracy and the clock for passage times a 0.001 sec accuracy. Both clocks can be set to zero and be "frozen", i.e. the time at a certain moment can be shown, while the
time measuring continues. The clock for arrival times can be set to zero either manually or electrically. Normally electric resetting is used, when several units are set to zero at
the same time.
When a vehicle passes, the passage time clock is set to zero. This happens when the
vehicle passes the sensor called A. When the vehicle passes the sensor B, the clocks are "frozen" and the information is reflected at the bottom of the picture, which is taken
simultanously.
The HM-78 has to register vehicles travelling in both direction. Because of this there is
a logic, which always lets the sensor to which the vehicle first arrives to become sensor A. The sensor which "becomes" A is "dead" after the first pulse and remains like this
until there is a pulse from sensor B. A pulse from B resets the logic. The length of a
lorry with a trailer is considerably longer than the distance between sensors. This results
in two or three pictures being taken of the same vehicle, since the logic is reset before
all axles have passed sensor A. This is not much of a problem, as a super 8-cassette consists of 3 500 pictures. However, it is helpful for identification of vehicle types during the examination of the film.
The logic can come out of order because of unusal arrangements of axles or because a
pedestrian stamps on the rubber tube. To prevent the logic from selecting the wrong
sensor as A, there is a special logic for resetting. The clock for passage times starts by an A pulse. If there is no B pulse within a certain time interval, the logic is reset. In other words, the logic is reset either by a B-pulse or because the passage time is too long.
If the HM 78 is used only for registering journey times, a picture is taken for every sensor pulse, independently of which sensor it is. Normally only one sensor is used. When
measuring journey times, the setting to zero for arrival time and passage time is
connected. Both clocks are synchronized, which gives a journey time with an accuracy of 0.001 sec.
201113239.
Maximum time of operation 48 hours for the camera unit and the IR transmitter. As the camera unit, the elec-troncis unit and the IR transmitter have se-parate voltage systems it is possible to re-place the accumulator batteries for the ca-mera and the IR-transmitter, without af-fecting the measurements. The maximum du-ration of opedu-ration is one week for the elec-tronics unit.
One super 8-cassette has 3 500 picture, but
of course it can be replaced during the mea
surements.
Number of pictures per cassette
Temperature range The equipment has functioned without
pro-blems both in very cold weather (-260C) and
Susceptibility to moisture
Time drift
Accuracy when "freezing" the time
Time between sensor pulse and picture
Time for transmitting
information between the
electroncis unit and the
camera unit
Blocking time after sensor pulse
28
The equipment has been used during heavy rainfall and during snowfall
with-out problems. However, the electronics unit
should not be opened during such conditions, but should be started inside.
Within i 2 seconds per 24-hour period. This varies for different units. The drift is con-trolled by using the synchro- nizing clock.
The time between sensor pulse and "free-zing" is at the most 0.0003 seconds
Appr. 0.055 seconds.
Appr. 0.01 seconds.