V'I/rapport
325A 1988
Laboratory and field studies on
the durability of thermoplastic
road marking materials
UIf Isacsson and YlIva Colldin
Vag-och Irafik-
Statens vag- och trafikinstitut (VTI) * 581 01 Linkoping
[IISIIt 181 Swedish Road and Traffic Research Institute * S$-581 01 Linkoping Sweden E
l/TIran
325A
1933
Laboratory and eld studies an
the durability o1' thermoplastic
road marking materials
Ulf Isacsson and Ylva Col/din
Vag-06/]
Statens va'g- och trafikinstitut (VT/l - 581 0 1 Linkb'ping
CONTENTS Page SUMMARY 1 1 INTRODUCTION 1 2 LABORATORY TESTING 3 2.1 Tréger wear 3 2.2 Indentation test 6 2.3 Artificial ageing 9 3 FIELD TEST 11
3.1 The Vikingstad project in general 11 3.2 Preparing the test field 15
4 COMPARISON BETWEEN LABORATORY AND
FIELD RESULTS 24 5 PROPOSAL FOR DIVISION INTO DURABILITY
CLASSES 30
5.1 Discussion 34
5.1.1 Durability class 1 (thick layer materials) 34 5.1.2 Durability class 2 (thick layer materials) 35 5.1.3 Durability class 3 (thick layer materials) 35
5.1.4 Thin layer materials 37 6 STATISTICAL INTERPRETATION OF THE RESULTS
- DISCRIMINANT ANALYSIS 38 GENERAL CONCLUSIONS 42
REFERENCES 44
Laboratory and field studies on the the durability of thermoplastic road marking materials
By Ulf Isacssson and Ylva Colldin
Swedish Road and Traffic Research Institute 5-581 01 LINKCSPING
Sweden
SUMMARY
Laboratory methods have been developed for determining the durability of thermoplastic road marking materials under Scandinavian conditions (low temperature and high frequency of studded tyres).
The wear resistance of 28 different materials at -lO°C has been measured in a Troger apparatus before and after artificial ageing. The equipment is considered to simulate the effect of studded tyres on the
durability of road markings. The hardness of the materials, which also
appears to influence durability, has been measured at 20°C with the aid
of indentation test conforming with DIN 1996.
Durability of the 28 materials in the field has been measured at predetermined intervals over a 2-year period with the aid of special equipment.
The validity of the laboratory methods has been assessed on the basis of
the results obtained.
A classification system for the durability of thermoplastic road marking materials using laboratory tests has been proposed.
I INTRODUCTION
Research into road marking materials (1-15) has been carried on at the
Swedish Road and Traffic Research Institute (VTI) since the end on the
605. Both thermoplastic materials and paints have been studied.
How-ever, two-component materials have generally not been used in Sweden
and experience of this type of material is therefore very limited.
Research has aimed at finding methods for describing the composition and performance of road marking materials. Work has been performed in
the laboratory and in the field, as well as in the VTI Road Machine (1).
Figure l summarises the work completed so far with regard to thermo-plastic materials.
Laboratory methods for determining the composition (binder content,
particle size distribution, titanium dioxide content, glass bead content
and binder IR spectrum) and durability (Troger test and indentation) have
been described in detail in Ref. 10.
With regard to performance, much interest has centred on research into optical properties (4-9, 14, 15). Research into skid resistance has been in
progress for a long time at the VTI (15) and the information obtained has
to some extent been applied to road markings (l, 13).
The durability of a road marking material is naturally also a very significant functional property. Road markings are exposed to mechani-cal forces and influence from various environmental factors. The mecha-nical forces acting on markings originate, especially in the Scandinavian countries, from studded tyres and snow ploughs. Environmental factors contributing to the destruction of road markings are primarily UV light, temperature and precipitation.
The durability of road markings has been evaluated sporadically through field tests. In recent years, however, more systematic tests on the
durability ofthermoplastic materials have been made (10, 13). Labora-tory methods have been developed (10) and their validity evaluated in field experiments (13). Using the results from these experiments, a
classification system for thermoplastic road marking materials based on laboratory tests has been proposed.
Thermoplastic road
marking materials
/
Composition
Performance
Binder Particle Titanium Glass Binder content size- dioxide bead IR
distribution content content spectrum
Durabi- Skid Optical lity resistance properties
Troger Artificial Indentation Retro wear at ageing value at Colour reflection
-10'C +20'C
Troger wear at
- lO'C
Figure 1 Schematic diagram of research concerning tests of
thermo-plastic road marking materials performed at the VTI.
2 LABORATORY TESTING 2.1 Troger wear
In the Scandinavian countries the frequency of studded tyres in
winter-time is high. It has, for example, been calculated that about 80% of the
vehicles on Swedish roads used studdedtyres during the period Novem-ber 1984 - April 1985.
It is reasonable to assume that a considerable proportion of wear on road markings is caused by studded tyres. About 1970, a laboratory apparatus, named the Troger apparatus, was developed in West Germany for simulating the wear from studded tyres on asphalt
pavements (17). This equipment has been used by the VTI since the end
of the 70s for determining the wear resistance of thermoplastic road marking materials. According to the VTI method, tests on road marking materials using a Troger apparatus are performed in the following way
(see figure 2):
A sample of the material is melted down to a temperature similar to that recommended by the manufacturer for applying on the road, after which it is homogenised by stirring and poured into a
steel ring (diameter about 100 mm, height 30 mm).
The sample is conditioned at the particular testing temperature
(normally lO°C) overnight and then placed on a rotating table
where it is held by 3 clamps operated by compressed air. The rotational speed of the table can be varied and is normally 30 rpm. Wear is produced by a vertical group of neddles striking the rotating sample. The group consists of 51 needles with a length of 180 mm and a diameter of 2 mm. The needle gun is driven by compressed air.
Testing comprises 16 periods of 40 s with a 32 s pause after each period. Air is blown over the surface of the sample throughout the test. The air temperature is the same as the testing temperature
(normally 40°C).
The sample is weighed before and after testing. Troger wear is defined as the loss of mass in grams.
Compressed air for
driving fhe pis rol/
Cold air for lher
mostatic control of
sample surfaces/
Sample
Figure 2VTI REPORT 325 A
3-"!
'3' a) '. .' Io v i.-u j). I" ."iER Needles
iiffy/If,
F0 EChVe
7 __
cover
"an
Rotating
VIn developing the method (10), the influence of testing temperature and storing time on Troger wear was studied in greater detail. The
separability of the sample was also investigated.
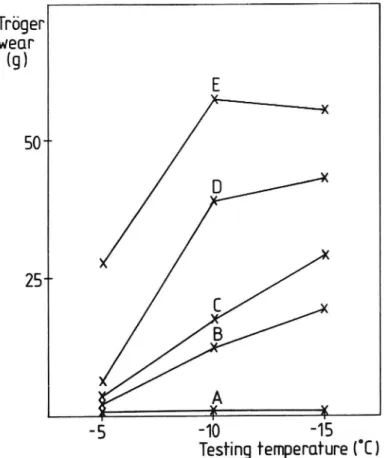
Testing temperature is of great significance for the result, as is
illustrated in figure 3 for 5 different materials. At -lO°C and -l5°C,
the difference between the materials is evident. Since the difficulty of tempering increases with falling temperature (the temperature diffe-rence between the sample and the surroundings increases), -100C was chosen as the testing temperature for further experiments. It should be
noted in this connection that when testing at +200C, the materials investigated all showed very low wear (_<_0.2 g) as is also indicated in figure 3. One reason may be that at 20°C, the materials are so soft that
they yield to impact from the needles. When testing the wear resistance of thermoplastic materials, it is thus inappropriate to perform testing at room temperature, since it is then impossible to distinguish the
different materials from each other.
Troger
wear
(9)
E
50 L
D
25"
C
B
.A
f *
17*
t?
-5
-10
~15
Testing temperature ('C)
Figure 3 Troger wear at different testing temperatures for 5 types of thermoplastic road marking materials.
The results regarding the significance of storing time are not as clear as for testing temperature. Although somewhat greater wear was
obtained for all 5 materials after about 4 days, adaption at ~100C than after about I day's adaption, the increase in wear varies between the different materials. However, one conclusion that can be drawn from these experiments is that the adaption time may be significant for the wear result and this must therefore be standardised. For practical
reasons, an adaption time of 15-20 hours (overnight) has been chosen in
this case.
In order to gain an idea of whether a given material separates, i.e. whether the coarser particles gravitate towards the bottom, a number of experiments were performed in which each sample was exposed to Troger wear on both the top and bottom surfaces. The unambiguous tendency could be established in these tests, even if wear in the majority of cases was somewhat higher on the bottom than on the top. In subsequent experiments, however, abnormally large difference in Troger wear have been in one case obtained between the top and bottom, which may be due to the material in this case being more separable. To ensure that the results obtained in testing the t0p surface are representative, the bottom should also be analysed, at least for one of the samples.
2.2 Indentation test
As indicated in the previous section, the hardness of therm0plastic road marking materials may be significant for their durability. This aspect has been demonstrated more tangibly in the field tests described in the
following section. If the durability of a thermoplastic road marking
material is to be predicted in the laboratory, it is therefore reasonable to assume that the hardness of the material must be tested in some
way.
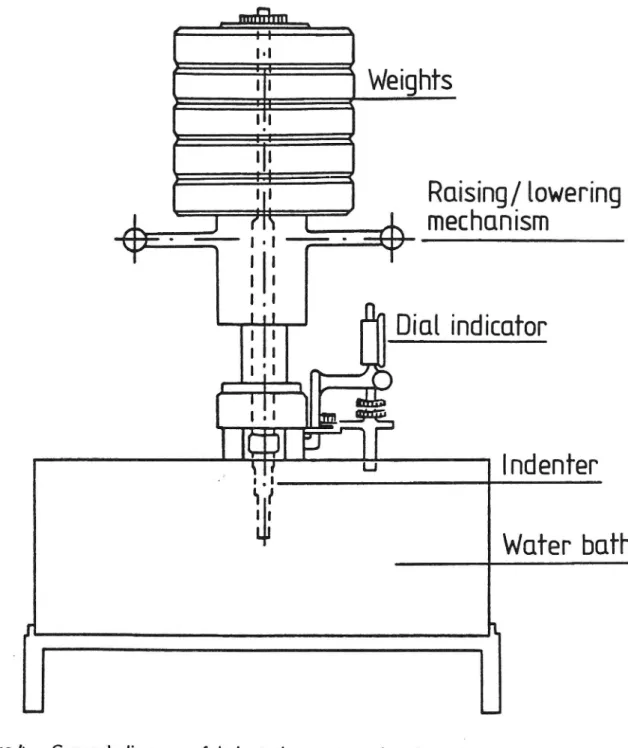
At the VTI, a German method (18) for testing bituminous materials such
as mastic asphalt has been used for determining the hardness of thermoplastic road marking materials. Briefly, determination of the indentation value is performed in the following way:
The sample is heated to the application temperature recommended by the manufacturer and then cast in moulds to form two 7 cm cubes of the sample. When a cube has reached room temperature, it is removed from the mould, turned so that one of the sides is at the bottom and then clamped back in the mould for temperature adaptation (see Figure 4) for l - 1.5 hours at the testing
tempera-ture (normally +200C).
The cube (clamped in the mould) is placed beneath the stamp
(Figure 4) and the total load applied with the aid of a raising and
lowering mechanism until it reaches the surface of the cube at a distance of at least 20 mm from the edge of the sample. The force then acting on the sample is 24.5 N. The dial indicator is set to zero. By slowly turning the raising/lowering arm, the total force (515 N) is brought to bear on the sample and the clock is started. At the same time, the arm is rotated 2 - 3 turns so that the load is completely free.The time for 10 mm depression is recorded and
termed the indentation value.
Measured indentation values at 20°C may vary from 5 s to more than 12
minutes (13). Repeatability is good. In tests on 5 different materials (10), coefficients of variation (standard deviation divided by the mean)
were < 5% when testing at 20°C (range of variation 10 - 80 s).
Wei his
Roising/ lowering
mechanism
Dial indicator
Ind en rer
Wafer bufh
Figure 4 General diagram of indentation test conforming with DIN
1996.
2.3 Artificial ageing
Thermoplastic materials contain various types of binders, generally
termed resins, plasticizers, rubbers and plastics. Small additions of
antioxidants, UV absorbers, suspension agents etc may also be used.
Resins in thermoplastic materials are generally hydrocarbon resins or ester resins. Hydrocarbon resins usually consistof complex hydrocarbon polymers of various sizes and structures. Ester resins are esterified hydrocarbon compounds. The ester resins include for instance maleic resins. Plasticizers are resin-soluble hydrocarbons added primarily so that the binder and thereby also the material become softer and easier to work. Plasticizers often consist of various types of oils.
Polymers are often added in order to improve the durability of the material. Examples of polymers that may be added to thermoplastic materials are butyl rubber, styrene-butadiene-styrene rubber, natural rubber, ethylene vinyl acetate and polypropylene, polybutene and
poly-thene.
These hydrocarbon products deteriorate with time and may be broken down by oxygen, UV light and heat. Oxygen causes slow oxidation. The reaction rate is accellerated by higher temperature and by UV light. The oxidation process may lead to a change in material prOperties, such
as brittleness.
Depending on the binder components used, thermoplastic road marking materials may therefore deteriorate to a greater or lesser extent during storage, heating or on the road. In order to counteract decomposition, certain chemicals (UV absorbers, antioxidants) may be added.
At the VTI, the susceptibility to ageing of thermoplastic road marking
materials has been studied through determination of Troger wear before and after ageing in a Xenotest 250 weather simulator. Ageing was
carried out in accordance with ISO 14892, which in this case involved UV radiation at 250C with 18 minutes "rain" every other hour. The thermoplastic material was applied in a 3 mm thick layer on a Marshall
test specimen (diameter about 100 mm, height about 30 mm) consisting
10
of asphalt concrete. The sample surface was illuminated directly from
above. The samples were aged up to 1000 hours, which under the
specified conditions is considered to correspond to l - 3 years on the
road.
Examples of the results of these ageing tests are given in Figure 5. As
can be seen, the susceptibility to ageing of the studied materials varies.
In the case of the most sensitive material, Troger wear increased by about 5 g at 1000 hours ageing.
Tr'dger
wear (9) 1 5 a4 "
15
20 3 ..Z
2 -_ 1 ,1 24NJ/
1% 56
333
106001)
Figure 5 Troger wear at ~10°C before and after 13, 56, 333 and 1000
hours of artificial ageing (13).
11
The results show that UV light may be of great significance for the durability of a thermOplastic material on the road. The effect may be greater in reality than our analysis reveals after artificial ageing, since
ageing on the road takes place at the same time as wear and under environmental conditions that may be harsher than in the weather
simulator. For instance, the temperature during summer is often higher
than 25°C.
A comparison between Troger wear on cores (Section 3) and Troger
wear after artificial ageing indicates that 1000 hours' ageing in the Xenotest 250 corresponds to l - 2 years on the road. For all materials
aged artificially, the Troger wear on the core was at least as great as the Troger wear on a Marshall specimen covered with material and aged
1000 hours. The road marking material had lain in place on the road for two years when the cores were taken up.
3 FIELD TEST
3.1 The Vikingstad project in general
During 1983-85, a project has been carried out at the VTI with primary aim of validating present laboratory methods for assessing the dura bility of thermoplastic road marking materials (Section 2) on the basis
of field tests.
In the project, a total of 28 thermoplastic materials from 6 manufac-turers (4t Swedish, 1 West German and 1 Dutch) have been examined. All
the materials are white and contain premixed glass beads. 6 of the
materials are "thin layer" materials, i.e. intended for application with a thickness of 1.5 - 2 mm. The other, materials are "thick layer" materials (thickness about 3 mm).
The manufacturer of each product has supplied a technical description with information on binder, glass beads, pigment, bulk density etc. The large variation in the composition of the materials can be illustrated by
some figures. For thick layer materials (22 materials) binder content
varies between 141 and 25 percent by weight, while the corresponding range for thin layer materials (6 materials) is 19 - 28 percent by weight.
12
19 (of 28) materials have a premix content of glass beads of 20 percent
by weight, 4 materials contain 30 percent by weight and remaining
materials 11 - 16 percent by weight.
The test field is located on road 636 just outside Vikingstad 10 km south-west of Linkoping (Figure 6). The pavement was laid in 1977. The
average number of vehicles per day (le-hour period) in 1984 was 5000.
Maximum permitted speed is 90 km/h.
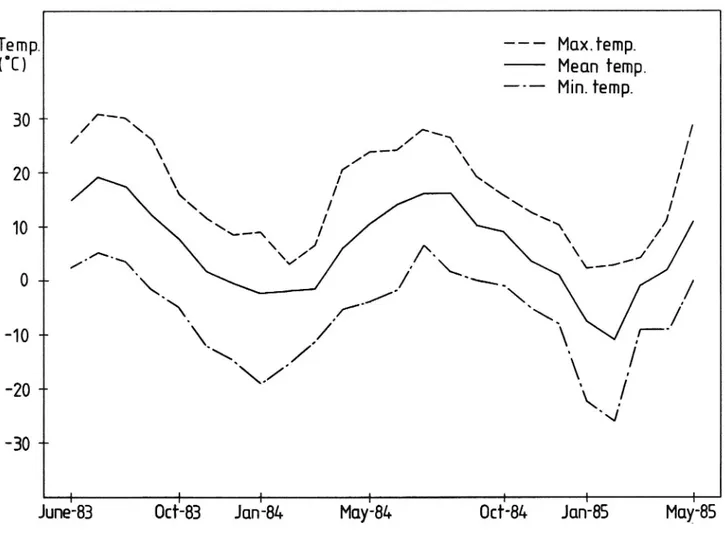
During the period of the study, the air temperature varied as shown in
Figure 7.
The test field was salted during winter and the local road management was requested to exercise caution when clearing snow from the road. No damage to the road from snow ploughs, for example, has been
observed.
13 N STOCKHOLM eh LINKOPING
41»
GUTEBORG 7 :23 / MALM 0 100 200 390 km a Figure 6 VTI REPORT 325 Al4
Temp.
--- Mox.femp.
( C)
- Mean rernp.
-
Min. temp.
I LA) 0 1 I
June-83
Oct-83
Jud-84
Maj-84
Oct-84
Jud-85
Moi-85
Figure 7 Variation in air temperature at Malmslatt (about 10 km
from the test site) during the period June 1983 - May 1985.
15
Preparing the test field 3.2
The test field is designed as a patchwork (Figure 8) consisting of 392
stripes. Each stripe measures 0.2 m x 3 m and the test field has a total length of 8!! m. 14 stripes of each material are distributed randomly
over the test field.
Link'dping
A X , m 3.45 <@
n
n
l
n
l
n
I
E
I
H
E
E
E
E
E
H
E
E
E
I
a
l
l
n
m
l
a
I
E
E
E
E
H
E
I
E
I
E
E
H
l
g
m
m
a
l
l
a
a
a
m
g
] ] ] ] ] [ [ [ [ [ [ r l l LI
l
l
a
g
I
m
r
n
n
a
a
a
g
l
l
m
a
l
I
g
a
n
a
l
a
l
l
g
l
n
g
m
a
a
m
E
E
E
E
E
E
E
E
E
E
I
E
E
I
n
a
l
a
l
e
l
E
E
l
A
50
%
l
W I I I J ]I
n
g
a
?
Ja
a
a
Wheel trucks Wheel trucks Wheel trucks Wheel frocksGeneral diagram of the test site.
Fi ure 8
16
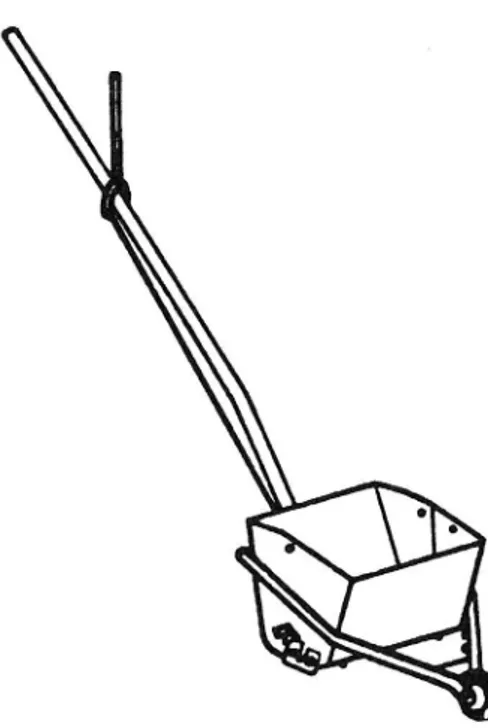
The verges have been provided with markings so that the road user cannot fail to cross the test field, either consciously or unconsciously. All materials were supplied to the VTI in the form of blocks. The materials were applied over a period of four days in June 1983 using a commercial striping equipment (Figure 9). No drop-on beads were used.
The temperature of the materials was controlled continuously during
melting and application.
Prior to laying, the layer thickness was determined with the aid of metal sheets which were weighed before and after application of
material to the sheet.
From these measurements, the thickness of the stripes can be assumed
to be between 2.8 and 3.2 mm (thick layer materials) and 1.7 -l.8 for
thin layer materials. Each stripe was left for at least ten minutes
before traffic was allowed over it.
Figure 9 General diagram of the striping equipment.
17
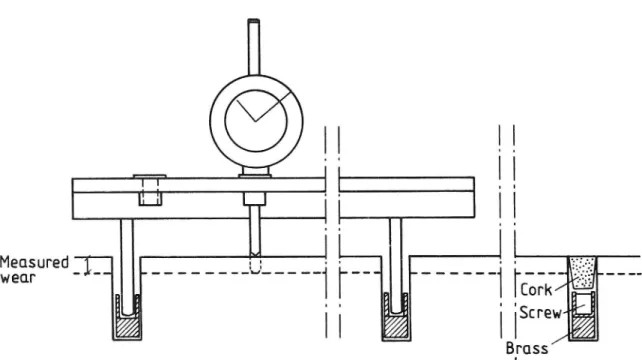
Wear measurement has been performed with the aid of a "straightedge" and dial indicator (Figure 10). When measuring, the straightedge is placed across the test area with two supports attached to fixes moulded
into the pavement. The fixes consist of brass sleeves with a flat
internal bottom forming a reference surface for the measurements and moulded in place with a plastic cement (Figure 11). The distance to the marking is measured. The dial indicator has a readout accuracy of 0.01
mm (18).
Two series of measurements have beenmade on each marking about 0.5
m from the short sides of the test area (see Figure 12). About 392 (2 x
14 x 14) readings were therefore obtained for each marking material
per measuring occasion, of which about 25% were from the wheel
tracks (Figure 8).
Figure 10 "Straightedge" for on-site measurement of wear.
18 i 1
Li!
J
J
L
L
Measured Jweor
'
1 r"
- - - ' " r---'
CorkI |
' Screw
Bross sleeveFigure 11 General diagram of measuring equipment and fixes.
+
U1 3 I+o
,2
m+
T
b 5: -3,0 m AFigure 12 General diagram of measuring point position when measu-ring wear on a marking.
19
Measurements were made during spring and autumn from autumn 1983
to spring 1985. The data comprise about 50000 measurements and have been evaluated with the aid of a special computer program.
The results are illustrated in Figures 13 - 16.
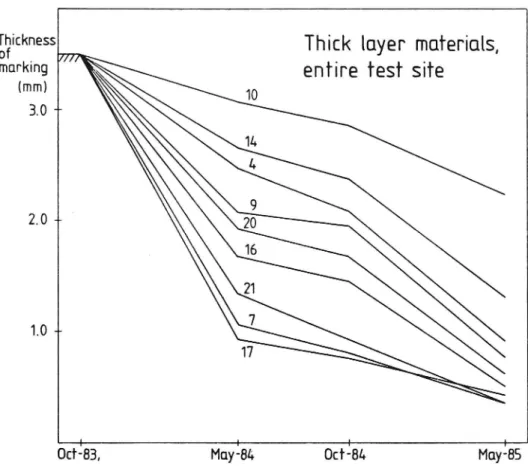
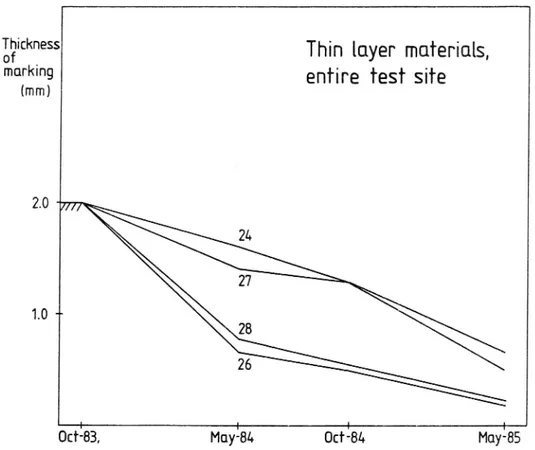
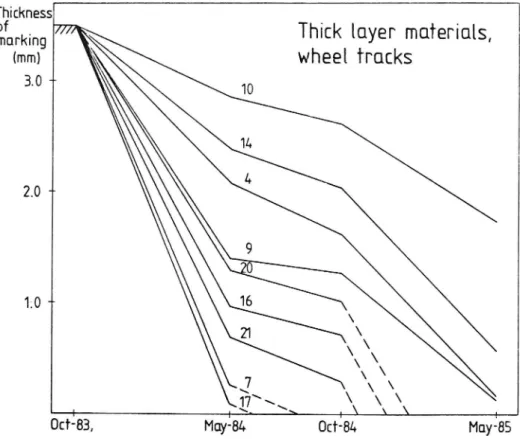
Figures 13 and 14 show how the mean thickness for some of the materials decreases with time. The mean for each product is calculated from all markings in the test field. Figures 15 and 16 show the corresponding measurements in wheel tracks. The difference in wear resistance can be seen most clearly in Figures 15 and 16.
Winter wear differs considerably between materials. The poorest mate rials are worn away in the wheel tracks after only one winter, While about half the thickness of the best materials still remains after two
winters.
As expected, summer wear is very much lower than winter wear. Summer wear is about 0.1 to 0.4 mm and is relatively constant for one
and the same material over the whole test field.
High winter wear does not necessarily mean high summer wear. For example, the best two materials were worn 0.24 and 0.40 mm in wheel tracks during summer 1984, while one of the poorer materials was worn only 0.1 mm.
20
Tigickness
Thick layer materials,
0 o o
marking
entire test SITE
(mm)
3.0 -~
2.0 i
1.0 »
\
Oct-:83,
Muylat.
Octiar
MuyIBS
Figure 13 Examples showing how thickness of thick layer markings decreases with time. Means for entire test site.
21
Eyckness
Thin layer materials,
mum ?!
entire test site
(mm)
2.0-21+
27
1.0 ~-
28
26
0ct183,
May184
actiaa
Mayias
Figure 14 Examples showing how thickness of thin layer markings
decreases with time. Means for entire test site.
22
th ckness . .
O
marking
Y
Thick layer materials,
(mm)
~
wheel Trucks
3.0
2.0
--1.0 "
% g \- \\ § \ \ \ :
Oct-83,
May-84
Oct-84
May-85
Figure 15 Examples showing how thickness of thick layer markings decreases with time. Means for wheel tracks.
23
WWW- 55
Thin layer mu reriuls,
0 .
mm ?!
(mm)wheel frocks
2.0 24 27 1.0 0 28 26 \ 41 § . \ 1*Oct-83, May-8L Oct-84 May BS
Figure 16 Examples showing how thickness of thin layer markings decreases with time. Means for wheel tracks.
24
4! COMPARISON BETWEEN LABORATORY AND FIELD RE-SULTS
Troger wear has been determined at -lO°C in. accordance with the method described earlier (section 2.1). The results vary greatly between materials: from O to over 80grams.
Troger wear has been compared with "actual" wear measured in wheel tracks after one winter (Figures 17 and 18).
Figure 17 shows that a material with Troger wear >35 grams also
demonstrates comparatively poor resistance to wear in the field. After one winter the marking has worn about 2 mm or more in wheel tracks
and after two winters it has disappeared (or is barely visible). Only one of the materials remaining to its original thickness after one winter shows comparatively high Troger wear. If this material is excluded, it can be seen from figures 17 and 18 that materials with Troger wear >20 grams have comparatively poor resistance to wear.
The five materials with the highest Troger wear are also comparatively
hard (indentation values between 78 and 751 seconds).
Figures 17 and 18 also show that low Troger wear does not necessarily mean low wear in the field. For 17 materials with Troger wear < 5 grams, wear in wheel tracks varies greatly after one winter (between 0.6 and 2.2 mm). The materials which "despite" low Troger wear have
poor resistance to wear in the field are either comparatively hard and/or deteriorate with time on the road.
Trager
r
Thick layer materials
70 4-
.
so
50
-30 -b
'
20 -h
10 "
o . . o In I J J J u 3 n J1.0
2.0
3'0 Wear in wheel
frucks(rnm), May-84
Figure 17 Tréger wear for thick layer materials as a function of wear in wheel tracks after one winter.
26
Trb'ger
wear
I
(g)
| Thin layer materials
I
l
|
|
I
50
-*
_ ' 1
30 ~
20
+-10 4' ol
I
l
l
l
|
l
O . 1 Q I1:0
2.0
Wear in wheel trucks (rnrn),
May-84
0
Figure 18 Tréger wear for thin layer materials as a function of wear in wheel tracks after one winter.
27
A comparison has also been made between the indentation value and
wear in wheel tracks after one winter (Figures 19 and 20). The diagrams
show that all materials with indentation values >45 seconds (9
mate-rials) also show comparatively poor durability in the field. (These 9
materials include 5 of those mentioned above with Troger wear >35
grams).
Figures 17 - 20 show that both Troger wear and indentation value are of great significance for the durability of a road marking material in the field.
According to this investigation, Troger wear >35 grams can be regarded as an "extremely" high value and means poor durability in practice (at low temperatures and wear from studded tyres). The indentation value is then of less importance, i.e. even if the indentation value is low, the material will probably have poor durability.
An indentation value >¢l5 seconds can be regarded as an "extremely" high value and indicates according to this investigation poor durability
on the road.
The significance of the indentation value is shown by the comparison between for example, materials 3 and 4 (see Table 1). According to
Troger analysis, the two materials are equally wear-resistant, almost equally age-susceptible, but different with regard to indentation value (50 and 7 seconds respectively). According to field measurements, material 41 (indentation value 7 seconds) is also more durable than material 3 (wear 1.4 and 2.2 mm respectively in wheel tracks after one winter).
Troger wear and indentation value thus give together an indication of the durability of thermoplastic materials on the road under the
condi-tion that the material does not age on the road. The problem of ageing
has already been discussed and certain results before and after
arti-ficial ageing are presented (section 2.3).
An idea of the significance of ageing with regard to durability can be
gained if a comparison is made between, for example, materials 1 and
10 (see Table 1).
Material 10, which is unaffected by ageing, is considerably more durable in the field than, for example, material 1, which is more susceptible. The two materials have similar indentation values (11 and 6
seconds respectively) and low Troger wear values (3.5 and 1.9 grams respectively). Because of ageing, however, Troger wear increases by
about 5 grams for material 1, while the wear properties of material 10
are unaffected by the artificial ageing.
Indentation value (sec) . -> -> . D 0 .
T
l
" o IThick layer materials
l
90 " I
.0 .-
,
g
70 -~
:
6° *
l
50 " o I40 --
I
20 4-
I
l
l
10 "l
J
1.0 2:0 3b Wear in wheel tracks (mm), May '81»Figure 19 Indentation value for thick layer materials as a function of measured wear in wheel tracks after one winter.
29
Indentation value
(sec) .D
Thin layer materials
100 -~
90
j80
7o
-60+
I
I
I
20 o II
I
I
1.0
2.0 Wear in wheel tracks (mm),
May -84
Figure 20 Indentation value for thin layer materials as a function of
measured wear in wheel tracks after one winter.
30
5 PROPOSAL FOR DIVISION INTO DURABILITY CLASSES A proposal for classification of thermoplastic materials with regard to
durability (at low temperatures and in exposure to traffic using studded
tyres) has been made. The classification is based on results obtained in
laboratory tests. The laboratory results have been validated through
field experiments. Tests in the laboratory comprise determination of the indentation value at 20°C and Troger wear at -lO°C before and after ageing.
According to the proposal, a thermoplastic material is placed in a
Troger wear class (Tw class I-V), an indentation value class (Iv class 1-111) and an ageing class ( ATw class I-III). After joint weighting of the
three classes, the particular material is finally placed in one of three
durability classes (1-3).
Figure 21 defines the classes. Figure 22 describes the sequence in which the analyses are to be performed in practice.
The materials in this study have beenclassified in accordance with the
proposed system (Table l).
31
Tr'oger wear on "fresh" thermOplastic material at 4009
Tw class I II III IV V
Wear (g)
0-5
5-10
10-20
20-35
>35
Indentation value at 2009
Iv Class I II III Time (5) 5-20 2045 >45
Difference in Trdger wear before and after artificial ageing for 1000
hours*
ATw class I II III
Difference
in wear (3)
0-1
1-4
>4
*) Testing is carried out before and after ageing in accordance with the method described in section 2.1, but the sample consists of a Marshall specimen with a 3 mm thick layer of thermoplastic material.
Durability class (Tw + class II III IV 3V A Tw classI l 2 2 3 II 2 3 3 3 III 3 3 3 3
*) Thermoplastic material in Iv class III is placed independently of Tw and A Tw classes in durability class 3. Apart from the above require ments, placing in durability class 1 requires a Tw, Iv and/or A Tw value which is not near the borderline between two classes. If so, the material
is placed in durability class (1-2).
Fi ure 21 Division into Tréger wear (Tw), indentation value (Iv), ageing I A Tw) and durability classes.
'32
Laboratory
sample
W
1
class
Trager wear
Tw class 21!
_
3
Tw class (HZ)
lTw class SDI
Indentation value
Iv class III
__
3
'V Class (I m)
(Tw+lv) class >1SZ
llTw-rlv) class SN
Trager wear before
T
I
m
and after ageing
A w c 055
4.
3
ATW class lI-I )
lTw+|vl classII
_
2
ATW class TllTw-rlv) class IIIor El.
3
lTw+lvl class II
ATw classI
J
'
1
|(Tw+lv) class Moria
Figure 22 Flow diagram for classification of thermoplastic materials
into durability classes based on laboratory tests.
33
Table 1 Laboratory tests and classification of thermoplastic
mate-rials into durability classes.
Laboratory tests Classification
Material Tw ATw Iv I'w Iv ATw Durability No. class class class class
(3)
(g)
(s)
'
1 1.8 4.9 6 I I III 3 2 1.9 - l6 1 I - a) 3 0.1 1.8 50 I III II 3 4 0.0 1.9 7 I I II 2 5 30.5 - 5 IV I - 3 6 2.0 <0 30 I II I 2 7 17.8 - 28 III II - 3 8 4.7 - 12 HI I - b) 9 65.4 - 100 V V - 3 10 3 . 5 <0 1 1 I I I 1 11 3 . 3 1.0 38 I II I 2 12 l l . 7 - 16 III I - c) 13 2.7 - 18 I Hi - d) 14 2.7 <0 18 I HI I 1-2 15 2.0 <0 5 I I I l e) 16 66.3 - 78 V V - 3 17 81.3 - 227 V V - 3 18 53.1 - 215 V V - 3 19 68.5 - 751 V V - 3 20 0.8 3.2 28 I II II 3 21 6.8 2.8 325 II III II 3 22 1.2 3.3 8 I I II 2 23 TSM* 45.1 - 7 V I - 3 24 " 1.1 0.4 19 I Hi I 1-2 25 " 0.2 0.9 15 I I I-II 1-2 26 " 1.0 <0 >600 I III I 3 e) 27 " 1.8 0-1 8 I I II 1-2 f) 28 " 9.0 - 58 II III - 3*) TSM stands for thin scredd markings (thickness 1.5-2 mm)
a) After two years' storage, considerably higher Troger wear has been obtained (>35 3). In I'r6ger analysis on cores, the material was also worn down to the pavement. Probable placing in durability class 3. b) Troger analysis on a core indicates probable placing in ATw class I
or II and durability class 2.
c) In Trdger analysis on a core, the material was worn down to the pavement. Probable placing in durability class 3.
34
d) Troger analysis on a core indicates ATw class >1. Probable placing
in durability class 2.
e) Higher Troger wear values have been obtained after 1 2 years'
storage.
f) The material shrank towards the centre of the sample in ageing and
Troger wear could not be determined completely in accordance with the prescribed method. Also, later Trb ger tests on a stored
material have shown higher values (corresponding to Tw class II). 5.1 Discussion
2, 6 and 16 materials (of 28 tested) have been placed in durability classes 1, 2 and 3 respectively. 4 materials are on the borderline
between classes 1 and 2.
5.1.1
ngability_cla§_s_1_(_t_h_i_c_lg layeg materials)
Materials 10 and 15, which have been placed in durability class 1, have
both achieved the best placing in all classes (classes Tw, Iv and A Tw).
According to laboratory tests, they are highly durable at 40°C (Troger wear at even lower temperatures has, however, not been determined)
and did not deteriorate notably under the influence of UV light.
On the other hand, determination of Troger wear after just over 2 years' laboratory storage has shown that material 15 deteriorated somewhat during this time. According to field measurements, material 10 is more wear-resistant than material 15, which is more similar to the materials placed in durability class 2. The difference between materials 10 and 15 is most noticeable after two winters, which may be explained by somewhat poorer ageing properties for material 15.
Like materials 10 and 15, material 14 achieved the best placing in the Tw and A Tw classes but with an indentation value of 18 seconds it is near the borderline (20 seconds) between Iv classes 1 and 11, so that material 14 is probably somewhat poorer from the wear resistance aspect. Material 14 was placed in durability class 1-2 and in wear
35
measurements in the field also shows somewhat poorer durability than
materials 10 and 15.
5.1.2
ngability_cl_a§_s__2_(:c_hic5 layer mategials)
According to laboratory tests, material placed in durability class 2 is
somewhat less wear-resistant at -100C (material 8), has a somewhat higher indentation value (materials 6, 11 and 13) or deteriorates somewhat in ageing (materials 4 and 22). According to wear measure-ments in the field, materials which deteriorate somewhat in ageing (4
and 22) have somewhat poorer durability than other materials in the
same class (6, 8, 11 and 13).
Materials assigned to class 2 have been worn 1 - 1.5 mm in wheel tracks
after one winter and are all measurable after two winters.
Materials placed between durability classes 1 and 2 are close to the borderline between two Tw, Iv or ATw classes.
According to this study, durability classes 1 and 2 contain good quality materials, as is shown by all field measurements. On a road with an AADT of 5000 or less, such materials should be effective for at least two years under Scandinavian conditions.
5.1.3
Qugability_cla§s_3_(thi_c5 layeg r_n_a_t_e_r_i§_1§)
The majority of materials in this study (16 of 28) belong to durability
class 3. Quality within this class varies considerably. The Tw, Iv and
A Tw classes range from the highest to the lowest class.
All materials with Troger wear >35 grams (Tw class V) and/or
indenta-tion value >05 seconds (Iv class III) have been placed in this durability
class (materials 3, 9, 16, 17, 18, 19, 21, 23, 26 and 28). According to field measurements, wear in wheel tracks varies for these materials from about 1.7 mm to complete disappearance after one winter.
With some reservations, materials with Troger wear between 20 and 35 grams are placed in durability class 3, regardless of indentation value
36
and age susceptibility. Troger wear values between 20 and 35 grams are not, however, considered extreme although they may indicate poor durability in wintertime if the temperature is especially low. Only one
material in this study has a Troger wear value between 20 and 35 grams (material 5). However, high Troger wear (30.5 grams) is "compensated"
for here by a very low indentation value (5 seconds). In this particular case, the age susceptibility of the material would be of interest. However, the Tw class has not been judged since this determination
cannot be performed on material with Troger wear > 10-15 grams. A
comparison between Tréger results on a core and material applied to a Marshall specimen indicates good ageing properties for material 5. Wear measurement in the field shows that the durability of material 5 agrees with the durability of those materials placed in durability class 2. Owing to the comparatively high Troger wear, the material is regarded as "uncertain" and placing in durability class 3 is therefore considered appropriate. Materials which "resemble" material 5 (Tw class IV and Iv class I) may be considered for special testing in order to assess age susceptibility. Troger analysis will then be performed under less stringent conditions (e.g. lower pressure and/or higher testing
temperature).
The two materials (7 and 17) found least durable in the field tests have
Troger wear of about 18 and 81 grams respectively and an indentation
value of 28 and 227 seconds respectively. Both materials have been placed in durability class 3 after "joint weighting" of the respective new value classes (Tw and Iv classes). The total of the "new value classes" is V and X for materials 7 and 17 respectively. The fact that the total of
the "new value classes" is very much higher for material 17 than for
material 7 does not indicate in this case that material 17 is inferior. Material 7 is probably very age susceptible. However, the ageing class has not been determined for materials where the total of the new value classes is IV or more, since the material is then placed in class 3
regardless of age susceptibility.
One material that has been placed in durability class 3 because of its ageing properties is material 1. This material has excellent new values
(Tw class I and Iv class I) but the highest ageing class ( Tw class III).
According to wear measurements in the field, this material has worn
37
more than the materials in durability class 2 after one winter and is completely worn away in wheel tracks after two winters.
If there is a demand for the marking to be effective for at least two years on a road with an AADT of 5000 under Scandinavian conditions
(low temperature and studded tyres), materials in durability class 3
cannot be recommended according to this study. A material in this class may, however, be satisfactory under more "favourable" conditions.
5.1.4 lh_i_n_l_ay_e_r_m_ateria_l_s
According to this study, a thin layer material (thickness 1.5 - 2 mm) with durability class I can be expected to last for one winter under
Scandinavian conditions and with an AADT of about 5000.
Three out of six thin layer materials have been placed in durability
class (1 - 2) (materials 24, 25 and 27) and the others in durability class 3 (materials 23, 26 and 28). According to wear measurements in the field,
the thin layer materials in durability class (1-2) differ considerably from each other with regard to wear resistance.
Most wear resistant is material 24, which has the best Tw and Tw
class but is near the borderline between Iv classes I and II (19 seconds).
Poorest of the three is material 25 which, according to the laboratory
tests, is also the most age susceptible. The age susceptibility of a material is naturally more significant if the material is laid in a thin
layer than a thick layer.
Materials 23, 26 and 28 all have extremely high indentation values or Troger wear values, which has been highly influential on durability.
In the test field, the most wear resistant thin layer material (24) has worn about as much as the most wear resistant thick layer material
(10), but being thin it has a shorter life on the road. A thin layer
marking of this quality can be expected to last about half as long as a thick layer marking placed between durability classes 2 and 3.
38
6 STATISTICAL INTERPRETATION OF THE RESULTS -DISCRIMINANT ANALYSIS
The "subjective" proposal for the classification system for the durabi-lity of road marking materials described in Chapter 5 contains 3 classes. The classification of a material is determined in the laboratory
according to a predetermined testing program (Figure 21). How well do
the laboratory results agree with the results obtained in the field? To answer this question, a classification based on wear in the road must be made. On the basis of the results from the Vikingstad project, the
following classification is possible: (Table 2).
Table 2
Class Mean wear (mm) in wheel
tracks after one winter
1 <1
2 1.0-1.5
3 >1.5
Materials belonging to Class 1 could then be said to have "very good" durability properties, materials in Class 2 "good" durability and
mate-rials in Class 3 "fair" durability. According to this table (Table 2), of
the 22 thick layer materials, one material (No.10) would belong to Class 1, 9 materials to Class 2 and 12 materials to Class 3. If this result is compared with the results from classification (cf Table 3 with comments) based on laboratory testing, 3 materials will be classified "incorrectly":
legals;
Material No. Durability Class Durability class
according to la- according to boratory test field test
5 3 2
l4 1 2
15 l 2
39
It should be noted that materials 14 and 15 are "borderline cases" (wear
in the field was 1.12 and 1.02 mm respectively; the proposed limit is 1.0 mm).
On the basis of this comparison, 3 of 22 materials would be incorrectly classified in laboratory testing. The classification system is "subjective" in the sense that it has been produced through direct comparison between field and laboratory results. Is it possible to arrive at approxi-mately the same conclusion in a more objective manner through some form of statistical analysis? To answer this question, discriminant analysis has been performed.
To be able to make as direct as possible a comparison of the described results with the results from the discriminant analysis, it would be desirable to classify the materials in the way indicated in Table 1. Unfortunately, as mentioned above, only one material has a mean wear of less than 1 mm in the wheel tracks. Therefore it is not possible with a statistical analysis with three classes. Instead, the discriminant analysis described below constitutes an attempt to descriminate between "good or very good" materials (mean wear _<_1.5 mm) and "fair" materials (>1.5 mm).
Discriminant analysis assumes the existance of a number of individuals
(materials) for which the true class affiliation ("good or very good" and
"fair") is known. One or more measures, x1, x2 ...., xP are available for each material which can explain the classification to some extent. In
this particular case, we have Troger wear (Tw) and indentation value (Iv) for all 22 materials, but unfortunately the ageing properties (ATw)
are known only for 11 of the materials.
In the case of two classes, a discriminant function is created
D : + + oooo
which is calculated for each individual. The constants a0, ...., aP are set
so that the two classes are separated as widely as possible, i.e. so that the greatest possible distance is obtained between the D values belonging to Class 1 and the D values in Class 2. In the simplest case, it
40
is then possible to set a discriminant value D0 which means that if D<Do, the individual belongs to class 1 ("good or very good" while if
D>Do, it belongs to Class 2 ("fair" material). The class boundary of Tw has been set at 10, partly because of the relationships observed and partly, possible even primarily, because Tw can only be measured if Tw<lO.
The calculated discriminant function will be:
D -.- -o.912 + 1.72x1 + 0.00317x2
and a material will be classified as "fair" if D>Do ' ' 0.0
Unfortunately, a complication arises in our case, since ageing ( Tw) has
not been measured for all materials. In practice, this can never be done
since Tw can only be measured if Tw<lO with the current testing
method. We are therefore forced to perform discrimination in two stages. However, this can be an advantage since the Tw measurements are relatively expensive to carry out.
In Stage I of the discriminant analysis, we use only the Troger wear (Tw)
and value (Iv) on all 22 materials. The idea is to perform a "rough
sorting" so that many of the "fair" masses can be eliminated. The
materials belonging to Group 1 ("good or very good") and "accepted" in
Stage I are passed on to Stage 2, where Tw is used to sort them into "good or very good" and "fair" materials.
A closer study of Tw shows that there is a relationship with wear in the road, but that the relationship is far from linear. As expected, materials
with high Tw-values wear heavily in the road. On the other hand, low Tw values are in practice no guarantee for long life. It is therefore natural
to divide the Tw variable into two classes.
Stage 1 in the discriminant analysis is therefore performed on all 22
materials with regard to the explanatory variables:
41
x1: 0 if Tw <10 1 if Tw :10
and x2 = Iv
The consequence of the discriminant function will be that all materials
with x1 = 1 (Le. TwZIO) will be placed in Group 2 ("fair"), while
materials With X1 = 0 will be classified as unacceptable if the stamp
load value is 3290 5. If x1 = 0 and x2<290, the materials will be passed
to Stage 2 for further classification.
The result of Stage 1 is that materials 5, 7, 9, 12, 16, 17, 18,19 and 21 are classified in Group 2 ("fair")! Material 5 will then be given an erroneous classification, while the other 8 are correctly classified. Almost all the materials will be placed in Group 2 because x1 = 1. Only material 21 has x1 = 0, but then x2>290 instead.
When this statistical discrimination has been made, it will be possible to compare the outcome with the classifications actually observed.
After Stage 1, there remain in principle 13 materials for further
classification with the aid of Tw. For reasons of cost, measurements have been omitted on some of the materials. Consequently, Tw has
not been recorded for materials 2, 8 and 13. Material 2 belongs to group
2 ("fair") while the other two are in Group 1 ("good or very good"). The
following analysis in Stage 2 must exclude three materials, and the
discriminant analysis in this case is only performed on 10 materials. In Stage 2, all the materials have x1 = 0, so discrimination can only be performed on
X2 : IV
x3 : Tw
The discriminant function will then be: D = -1.56 + 0.0719x2 + 0.711X3
and if D>DO the material will be placed in Group 2 ("fair"). All other
42
materials must be considered to belong to Group 1 ("good or very good"). The result from Stage 2 is that materials 1, 20 and 22 are placed in
Group 2, while materials 3, it, ll, 14 and 15 are placed in Group 1. Material 22 is classed too low since it is "acceptable" on the road.
Material 3 has been placed 1 Group 1, although in reality it is "fair". The
other materials have been classified correctly.
It is interesting to observe that as soon as X3 = ATw is greater than 2.5,
all materials are placed in Group 2. Even at a stamp load as high as x2 =
50, it is sufficient for X3 to be less than 2.0 for the material to be placed
in Group 1, If x2_>_250, the material will be placed in Group 2 regardless
of the value of X3,
What can be said about the results of the discriminant analysis? We have in fact only classified 19 materials (in both stages) and of these, 3 were incorrectly placed. If a purely random classification had been made, the probability of at most 3 erroneous placings is 0.2%. This classification system developed thus appears clearly superior to a random classifica
tion. However, it should be observed that both the adaption and the random check were performed on the grime material, and 3 erroneous
placings should have a probability clearly greater than 0.2%, although this is really rather low.
7 GENERAL CONCLUSIONS
It must be emphasized that this proposal for a system of classification into durability classes can only be applied under Scandinavian conditions, i.e. when exposed to low temperatures and traffic with studded tyres. Under "summer conditions" wear measurements on materials in the field have shown small differences in wear resistance. Using the proposed classification system, more wear resistant materials (belonging to classes 1 and 2) can be distinguished from less wear resistant materials (class 3).
The examined materials (28) have been classified in accordance with this
system. The result of the classification agree well with the field
measurements.
43
In order to predict durability on the road from laboratory tests, the
materials must be laid exactly as directed. Also, long storage periods
must be avoided.
In laying the materials, the maximum heating temperature and time must not be exceeded. A material that is heated too hot and/or too long deteriorates to a greater or lesser degree depending on its composition.
Good durability also requires good adhesion between the pavement and the marking. A wet or oily surface or old marking material leads to poor
adhesion.
The material must not be stored longer than necessary from the time when durability testing is performed to the time when it is used. It is suggested that the storage time should not exceed one year. Renewed durability testing should then be performed.
Extensive tests are necessary during the next few years for further validation of the suitability of the proposed classification system. These activities comprise laboratory tests and a systematic follow-up in the field of marking materials.
44
8 REFERENCES
l. Persson, E. Tests of Road Marking Materials in the Test Road
Machine at the Swedish Road and Traffic Research Institute. VTI Rapport nr 89, 1972.
2. Persson, E. Field Tests of different Road Marking Materials 1960-1970. A follow-up study. Swedish Road and Traffic Research Institute. VTI Rapport nr 93, 1972.
3. Persson, E. Investigation of Functional Properties of Road Marking Materials. Background to on-going tests at the Swedish Road and
Traffic Research Institute. VTI Rapport nr 165, 1974.
4. Forsberg, A., Dahlstedt, A. och Laurell, H. Influence of Surfacings
on Visibility Distance to Road Markings in Sunlight. Swedish Road
and Traffic Research Institute. VTI Meddelande nr 34, 1977.
5. Forsberg, A. Optical Guidance on Roads Illuminated by Vehicle
Headlamps. Swedish Road and Traffic Research Institute. VTI Rapport nr 152, 1978.
6. Helmers, G. Visual Guidance in Night Driving. Swedish Road and
Traffic Research Institute. VTI Meddelande nr 115, 1978.
7. Lundkvist, S-O, Helmers, G. and Ytterbom, U. Specific luminance
measurements of road markings and road surfaces in the field.
Comparisons between instruments. Swedish Road and Traffic
Research Institute. VTI Rapport nr 188A, 1980.
8. Lundkvist, 5-0 and Sbrensen, K. Reflection properties of road
markings in vehicle headlight illumination. Swedish Road and
Traffic Research Institute. VTI Rapport nr 189A, 1980.
9. Helmers, G. Detection of Obstacles and Optical Guidance by Vehicle Headlights. Lysteknik Laboratorium och Lysteknik Selskab,
Danmark (I981).
10. 11. 12. 13. 1 4. 15. 16. l7. l8. 19. 45
Isacsson, U och Colldin, Y. Thermoplastic Road Marking Material. Laboratory Tests and Description of Preliminary Methods. Swedish Road and Traffic Research Institute. VTI Meddelande nr 210, 1980. Isacsson, U. och Colldin, Y. Road Marking Paint. Laboratory Tests and Description of Preliminary Methods. Swedish Road and Traffic Research Institute. VTI Meddelande nr 3 13, 1983.
Isacsson, U. och Colldin, Y. Road Marking Paints. Laboratory
Tests. Swedish Road and Traffic Research Institute. VTI
Meddelan-de nr 347, 1983.
Colldin, Y. och Isacsson, U. Laboratory and Field Tests on the Durability of Thermoplastic Road Marking Materials. Swedish Road and Traffic Research Institute. VTI Meddelande nr l£82, 1986.
Lundkvist, S-O och Nilsson, B. Specific Luminance of Road Marking
Variation depending on Season. Swedish Road and Traffic Research Institute. VTI Meddelande nr l+67, 1985.
Lundkvist, S-O. Reflection properties of roadmarkings. Swedish
Road and Traffic Research Institute. VTI Meddelande nr 510, 1987. Ohlsson, E. "Friction Measurements on Runways and Roads".
Swedish Road and Traffic Research Institute. VTI Rapport nr 177 (1979). In Swedish.
Troger, H. och Helfrich, H. Uber den Widerstand bituminoser Deckschichten gegen Verschleiss. Strasse und Autobahn l, 1971,
p 18.
Din 1996 blatt 13. Priifung bituminoser Massen fiir Strassenbau und
Verwandte Gebiete. Eindruckversuch mit ebenen Stempel.
Lilja, B. Effect of Coarse Aggregate Content on different Asphal-tic Concrete Surfacings. Swedish Road and Traffic Research
Insti-tute. VTI Rapport 161, 1978.