Faculty of Forest Sciences
Southern Swedish Forest Research Centre
Growth and timber quality evaluation of
33 European beech (Fagus sylvatica L.)
provenances from a site in Southern
Sweden
John Bergkvist
Growth and timber quality evaluation of 33 European beech
(Fagus sylvatica L.) provenances from a site in Southern
Sweden
John Bergkvist
Supervisor: Jorge Aldea, SLU, Southern Swedish Forest Research Centre
Assistant supervisor: Mateusz Liziniewicz, Skogforsk, Ekebo
Examiner: Jörg Brunet, SLU, Southern Swedish Forest Research Centre
Credits: 30 credits
Level: Advanced level A2E
Course title: Master thesis in Forest Science
Course code: EX0928
Programme/education: Euroforester
Course coordinating department: Southern Swedish Forest Research Centre
Place of publication: Alnarp
Year of publication: 2019
Cover picture: Rosalie Selhorst
Online publication: https://stud.epsilon.slu.se
Abstract
This study aims to shed more light on the differences in growth and timber quality characteristics between European beech provenances at its northern distribution margin. Data was collected from a provenance trial established in 1998 in southern Sweden to determine the growth and development of 33 provenances of European beech (Fagus sylvatica L.) originating from within Europe. A generalized linear mixed model with a post-hoc Tukeys' test was used to analyze survival, growth and tree structural traits that define timber quality in plantation forestry. Several provenances performed well with re- spect to height increment, stem crookedness, mortality, and the tendency to produce double stems and lateral branches in the lower or upper part of the stem.
Results showed higher survival rates for 'Brumov-Sidonie' and ‘Val di. Sella’ from Czech Republic and Italy respectively. No difference was found be- tween provenances in basal area increment (or diameter), but a good perfor- mance for native provenance ‘Torup’ from Sweden in height increment was found. The Austrian provenance ‘Hinterstoder’ showed the lowest stem crookedness. ‘Perche’ provenance from France and ‘Alsted F.413’ from Den- mark had the lowest tendency to develop double stems below 4,5 m. Prove- nances 'Farchau (SH)' and 'Urach (BW)' both showed the lowest tendency to develop double stems above 4,5 m on the stem. Tree tendency to develop lateral branches below 4,5 m was lowest for 'Farchau (SH)' provenance from Germany. No significant differences were found between provenances for the frequency of lateral branch divisions above 4,5 m on the stem.
The results show that even though beech can be considered a plastic species with a good adaptive response to varying environmental conditions, the genetic background has an important role in shaping stand development. Establishment of specific beech provenances can lead to better quality development in Southern Sweden and should be considered.
Acknowledgements
A deep and sincere thank you to Jorge Aldea, who has given irreplaceable help with R, and who has supported and encouraged me to progress and de- velop my scientific understanding with great feedback.
A big thanks also to Mateusz Liziniewicz who has been vital with his help and support with trial site navigation, variable definitions, and feedback. My gratitude to the Southern Swedish Forest Research Centre for allowing me to do this work and being part of the Euroforester programme. Thanks to Skogforsk for supplying the experiment, measurement tools and trial site.
Table of contents
Abbreviations 8
1 Introduction 9
1.1 European beech in a changing climate 9 1.2 Past and future of European beech in Sweden 11 1.3 The European beech provenance trials in Southern Sweden 12
2 Objectives of the thesis 13
3 Material and Methods 15
3.1 Beech – the studied species 15
3.2 The site 17
3.3 Data collection 19
3.4 Statistical analysis 21
4 Results 25
4.1 Survival 25
4.2 Basal area increment & final diameter size 26 4.3 Height increment & total height 27
4.4 Stem crookedness 29
4.5 Double stem (< 4,5 m) 29 4.4 Double stem (> 4,5 m) 30 4.5 Lateral branch division (< 4,5 m) 31 4.4 Lateral branch division (> 4,5 m) 32
5 Discussion 35
5.1 Survival, growth and timber quality features of European beech at the trial site 35 5.2 The consequences of differences among European beech provenances 36
6 Conclusions 38
References 39
Appendix 1 – Supplementary figures 45
Abbreviations
AIC Akaikes’ Information Criterion BAI Basal area increment
GLMM Generalized Linear Mixed Model NPP Net primary production
1
Introduction
1.1 European beech in a changing climate
Tree growth and species distributions are expected to be impacted by anthropogenic climate change. Projected climate change scenarios include an increase in annual temperatures of 2-6 °C, and a decrease in precipitation of up to 40 % (Christensen et al 2007). Increasing risks of drought and heat-induced tree mortality emerge as potential associated risks for forests (Bosela et al 2018). The balance of the forest ecosystem depends on the environmental conditions, and as these conditions change, the equilibrium of the forest will be affected as well (Thuiller et al 2008; Robson et al 2018). Climate change will thus have significant implications for both natural forests and plantation forests globally (Kirilenko et al 2007).
The projected climate change scenarios presents challenges for Scandinavia with associated impacts on biodiversity and on the functioning of ecosystems (Felton et al 2010; Dury et al 2011; Kirilenko et al 2007). The effect of increasing carbon dioxide concentrations coupled with increasing temperatures could also have posi- tive effects on plantation forestry with an associated increase in Net primary pro- duction (NPP) (Kirilenko et al 2007; Dury et al 2011). Accordingly, current indica- tions are that Swedish forests are experiencing a growth increase due to longer growing seasons and warmer climate conditions (SCCV 2007; Kirilenko et al 2007; Michelot et al 2012). The estimated effect could result in a growth increase of 20- 40 % for Norway spruce, Scots pine, and birch by the end of this century (SCCV 2007).
However, the increase in carbon allocation depends on the water and nutrient avail- ability which might be limited under future climate change scenarios as well (Eilmann 2014; Bravo et al 2017).
The direct evolutionary pressure that climate change presents on European forests occurs within a timeframe that can be considered very short when put in relation to natural selective pressure (Bravo et al 2017). The natural adaptation ability of a tree
species to grow and develop depends on the genetic composition within the individ- ual (Kramer 2007; Paffetti et al 2012; Bravo et al 2017).
The frequency and severity of extreme events and wind storms are expected to in- crease (IPCC 2013). Understanding of its implications and identification of the most severe risks posed for tree growth and survival becomes important (Felton et al 2010). The long-term response and resilience of tree species to extreme weather events are not fully understood (Malcolm et al 2002) as the ecosystems form com- plex interactions with the climate (Bravo et al 2017). In Sweden, since 1988, warm years with higher temperatures and precipitation rates of lower than normal have been increasingly common throughout the country. The summer of 2018 saw fre- quently occurring drought and several forest fires also in the northern parts of the country (SMHI (Swedish Meteorological and Hydrological Institute), 2019). Broadleaves have recently received increasing attention in Sweden because of sev- eral traits considered advantageous as the forestry sector faces climate change re- lated challenges. Establishing broadleaves has been promoted a possible option for decreasing climate change related risks that may affect the ecological values of the forest (Felton et al 2016). Beech has so far shown good ability to cope with wind- storm damage when established in a mixed forest with Norway spruce in Southern Sweden (Bolte et al 2010).
Anthropogenic climate change has implications also for changes in migration and colonization rates of forest tree species, which are projected to occur within this century (Malcolm et al 2002; Hamrick 2004; Bosela et al 2018). European beech (Fagus sylvatica L.) is likely to migrate further northward as the climate warms, the length of the growing season rises and late frost becomes less of limiting factor for recruitment (Bolte et al 2010; Bosela et al 2018). Beech may at the same time lose habitat at the southern edge of its distribution (Kramer et al 2010). Although Euro- pean beech in particular is considered to have good adaptational response to abiotic and biotic stress, the expected changes in local temperature (Stömme et al 2018) and water regimes (Frank et al 2017) is still considered major threats to the species (Bravo et al 2017).
Understanding of the degree of influence of genetic predisposition as opposed to the environmental factors becomes increasingly important. Especially as sufficient information about development at the northern distribution limit is scarce (Stener, 2008). Thus, gathering knowledge of the adaptational ability of beech at its northern distribution margin could lead to further understanding of the future development and suitability of beech in a changing climate in Sweden.
1.2 Past and future of European beech in Sweden
European beech stands have in the past been considered to be of recent origin in southern Sweden. Historical evaluations from the 17th and 19th centuries show that beech dominated forest stands which covered large areas of southern Sweden during the Middle Ages (Brunet 1995). Beech could have started to form forest communi- ties in southern Sweden as early as 1,500 years BC (Brunet & Fritz 2011). Socio- economic changes during the 19th century initiated a change in the Swedish forest landscape that transformed wood pastures into managed dense forests for timber production. This change led to an increment of the total amount of forested areas and standing timber stock, but also led to a decrease in relative shares of broadleaved trees. This altered the habitat conditions for many sensitive species associated with temperate broadleaved trees (Brunet et al 2012).
The current beech distribution in Sweden is characterized by stand structures in de- cline of old beech trees, with lower habitat availability for many specialised epi- phytic and saproxylic species as a result (Brunet et al 2012). Several protected na- ture areas have been created which has helped to preserve old growth beech stands and their high biodiversity values. One example is the Söderåsen National Park, which was formed in 2001 and covers 1,625 hectares of broadleaved deciduous for- est, consisting mainly of old beech trees (Sveriges Nationalparker, 2019).
The broadleaf component of Swedish forests has between 1985 and 2010 increased with 32 % (Nilsson & Cory 2018). The contribution of European beech to Swedish forests is modest with 2,5 % of all standing stock, including natural forest cover (Nilsson & Cory 2018). The beech forest stands are all located in southern Sweden. This region is characterized by lowland areas of average annual temperatures of 8 °C, with yearly mean precipitation rates of 700-800 mm (SMHI 2018).
The Swedish forest sector is preparing for continued exposure to extreme weather events and wind storms from forecasted climate change (SCCV, 2007). Conse- quently, Sweden has changed part of its forest policy and developed a strategy to increase the proportion of broadleaves in the landscape (Lodin et al 2017). By in- troducing a grant to forest owners the aim has been to increase the attractiveness of reforestation with deciduous species by lowering the cost of planting and of seedling protection. However, interest in broadleaf establishment from forest owners has so far been low (Lodin et al 2017). Possibly, alternative establishment of broadleaves could present a risk adverse choice in regions prone to the hazards of wildfires as well (Terrier et al 2013) and may act as important barriers to limit the fire spread (Girardin et al 2015).
Increasing the share of beech in mixed species stands in plantation forestry could also provide a possible risk reduction strategy as weather conditions become more extreme (Bolte et al 2010). The possible introduction of more southern provenances
of beech in Swedish forestry also constitute a possible risk adverse adaptation strat- egy (Löf et al 2012). This study aims to contribute with additional information on European beech provenances growth and development in Sweden.
1.3 The European beech provenance trials in southern
Sweden
The regeneration material of many broadleaved species (including beech) from Swedish indigenous forestry is scarce, which is compensated by importing material mainly from Poland and Germany (Stener 2008). At the same time, the knowledge about northern transfer effects on survival, vitality and growth is limited. Gaining knowledge of these effects might be crucial since the northern limit of natural dis- tribution for European beech is found in southern Sweden. To increase the knowledge of the transferring effects of beech material within Europe two series of international beech provenance trials (1993/95 and 1996/98) were established throughout Europe. One trial in each of the series was established in southern Swe- den (Figure 1.).
The genetic origin of beech can be traced to several regions in Europe of differing climate conditions. In these areas, the species has adapted in response to the local selective pressure and the limits imposed by environmental conditions (Weigel et al 2018). Currently, the entire beech distribution in Europe is represented in 217 prov- enances (Robson et al 2018). 33 of these European provenances have been estab- lished at a trial in Trolleholm, southern Sweden (coordinates: 55°56'01.0"N 13°19'31.0"E, altitude 100 m a.s.l.). This trial is the basis for the data used in this thesis to determine the development and growth of beech at its northern distribution margin. The provenance trial was established in 1998 as part of a European collab- orative research project to gain further understanding of beech development under changing climate conditions, and supply northern Europe with suitable regeneration material in the future (Stener 2008, Robson et al 2018).
The scientific base for the above mentioned approach is however, not fully devel- oped, and although much research has been conducted so far (two inventories have been carried out in 2001 and 2007), the understanding of the response of various beech provenances to climatic conditions in southern Sweden is still limited.
2
Objectives of the thesis
The main objective of this work is to study the degree of influence of genetic pre- disposition on growth and development of European beech at the northern distribu- tion margin of the studied species, situated in Southern Sweden. The 33 beech prov- enances included in this study originate from vastly different latitudes and altitudes, together making up a genetically diverse establishment. As the climate in the future will change it is of interest to find new plant material that originates from outside of Sweden that is well adapted to future growth conditions, and may continue to pro- duce high quality timber. Results from the present study aim to improve and add to the understanding of the adaptability of European beech to Swedish growth condi- tions.
The results from the last inventory performed in 2007 by Skogforsk at this trial site concluded that additional growth and development was needed for further conclu- sions to be drawn about the studied variables. In this thesis, data was collected eleven years later (twenty years from establishment). The main survival and growth differences between provenances established in southern Sweden is assessed, with comparisons between inventories 2018/19 and 2007.
The specific objectives are:
(1) To identify differences among European beech provenances on survival rate.
(2) To evaluate the differences in growth (basal area, diameter and height) among European beech provenances from the last inventory in 2007.
(3) To identify general trends and correlations in the timber quality characteristics from the tree shape of beech provenances along a Europe-wide geographical gradi- ent of climate and elevation.
The following hypotheses were tested:
(1) The mortality rate of south-eastern European beech provenances could be lower since they have adapted to harsher climate conditions and environ- ments in the early stages of growth.
(2) Swedish beech provenances could have better growth since they are natu- rally adapted to exploit resources at these latitudes.
(3) Traits of the tree structure that included increased crookedness and devel- opment of double stems may lead to a decrease in growth.
The hope is to supply northern Europe with further information on the suitability of regeneration material in the future, with emphasis on the probable climate change scenarios and the projected northwards movement of beech populations.
3
Material & Methods
3.1 Beech – the studied species
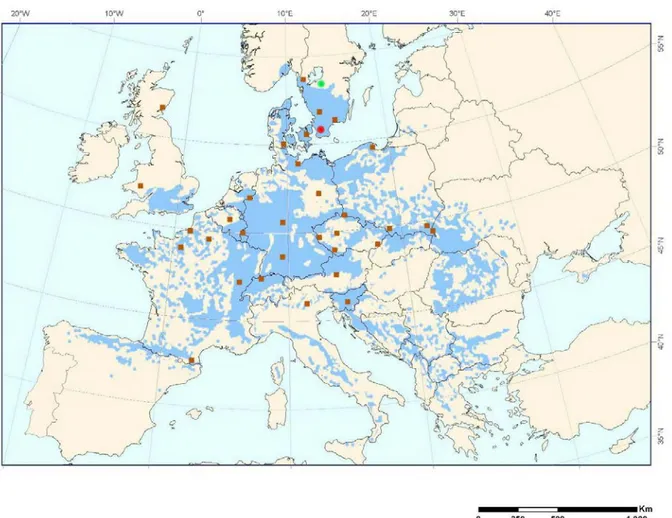
Beech constitutes one of the most widespread tree species in Europe (Figure 1.), with a natural distribution range from Spain in the west to the Black Sea in the east. The southern limit of its distribution can be found in Sicily, stretching up to southern Sweden and southern Norway (Houston Durrant et al 2016). It is considered a plas- tic species with high genetic variability, a beneficial trait for adaptation to environ- mental disturbances (Paffetti et al 2012).
As a large deciduous tree species, beech normally reaches heights of up to 35-40 m. Contrary to many other broadleaves, it has the ability to grow well even towards the later stages of its life cycle. Beech dominates the temperate forest zone, where mois- ture availability is not a limiting factor for growth. In the south, dry conditions limit forest expansion. In Spain, beech is only found growing at altitudes of 1000 m or more (Houston Durrant et al 2016).
Compared to broadleaf species in lowland areas, beech can be considered a late flusher in areas of warm climate, where elevation is below 500 m. The bud burst date varies to some extent with temporal and spatial patterns, but not as much as for oak or larch (Vitasse & Basler 2013). On higher altitudes of over 1500 m, budbreak has shown to commence earlier than for example oak, sycamore and ash (Vitasse & Basler 2013). On high altitudes the bud burst date has shown to be regulated to a greater extent by temperature than by photoperiodism (Strömme et al 2019). Beech is the most shade-tolerant tree species in the temperate zone and may regen- erate well in full shade. For this reason, silvicultural systems with continuous crown coverage can be used with beech that relies on natural regeneration for the estab- lishment of the new crop (Matthews 1989). The shelterwood system is commonly used in Germany, Sweden and Denmark. The shelterwood system is beneficial as it limits frost exposure (Agestam et al 2003), drought, and exposure to cold winds for
the regeneration. It also lowers the risk of growth of weeds that can compete with the trees for resources (Matthews 1989).
European beech is not demanding of soil conditions and can be found on both acidic and alkaline soils, with a pH ranging from 3,5 to 8,5. However, as a late successional species, beech dominates areas of moderately fertile soils. Its growth is optimal on humid, nutrient-rich soft soil. It does not grow however, in areas where flooding is common during parts of the year, or where soils are very compact and the root sys- tem is unable to penetrate into the ground properly (Houston Durrant et al 2016). The root system of beech is quite shallow in comparison to that of other broadleaves, making it susceptible to drought at lower latitudes of its distribution (Bosela et al 2018). Beech is considered quite sensitive to late frost when the first leaves have flushed (Principe et al 2017). Late frost currently constitutes a limiting factor for
Figure 1. The current European beech distribution in Europe. The red circle indicates position of the Trolleholm trial site. The green circle indicates the position of Rånna trial site. The brown squares represent the locations of origin for the 33 provenances of
natural northward expansion in southern Scandinavia (Hofmann et al 2015). It is often found growing on slopes or in hilly terrain where cold air does not linger. In the area of Götaland, Southern Sweden, beech constitutes 2,5 % of all standing stock (Nilsson & Cory 2018). Old-growth beech forest contributes as habitat for several species of lichens and bryophytes (Fritz et al 2009) and has important con- servation value for several red-listed species.
Beech is commonly grown in forests in Germany, Belgium and Denmark and is important for the timber production in Europe. In Sweden, it can be found in plan- tation forestry to a very small extent. The wood after harvesting is fine-grained and hard, with few knots present. It has many different usages including furniture, boat- building, construction of musical instruments, flooring, stairs and for plywood (Houston Durrant et al 2016).
3.2 The site
The data was collected during autumn/winter 2018/2019 in a beech provenance trial situated at Trolleholm, Skåne (coordinates 55°56'01.0"N 13°19'31.0"E, altitude 100 m a.s.l.). The field trial was created as part of an international collaboration studying beech provenance trials throughout Europe (Robson et al 2018). In the trial 33 beech provenances were planted and they likely correspond to variations in gene expres- sion towards growth and phenological expression. They also originate from areas of different environmental conditions (Table 1.). The experiment in Trolleholm is one out of two created in Sweden (see Figure 1.). The second trial is situated in Rånna, 58º 27’N, 13º 50’E, altitude 85 m.
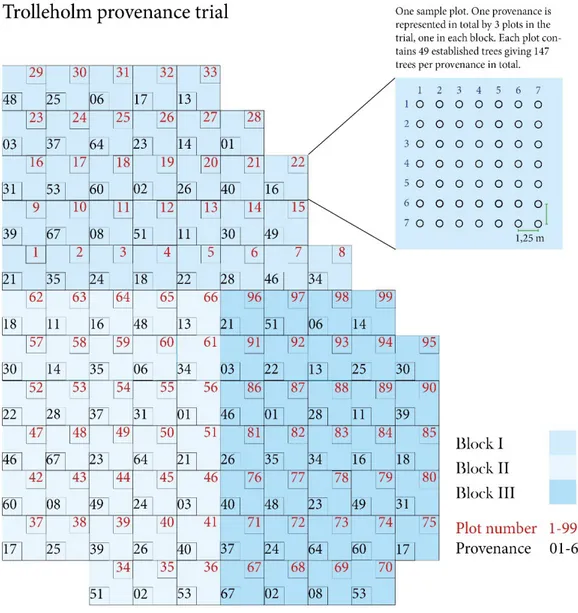
The provenance trial at Trolleholm was established in spring 1998 on former agri- cultural land through planting of two year-old bare-root seedlings in a randomized block design with three blocks and 33 plots in each block. In total 99 plots were planted over 1 ha of even terrain, where each provenance was represented in 3 ran- domly distributed plots over the area (see Figure 2.) Each plot contains 7 rows with 7 trees in each row, giving a total of 49 trees per block. Initial tree planting distance was 1,25 m between each tree and between rows. In total, 4 851 seedlings were established as part of the trial. The seedlings were brought up at the Institute for Forest Genetics and Forest Tree Breeding in Grosshansdorf, Germany (see Table 1. for detailed description of provenances).
The soil at the site consists of deep, fertile glacial till containing particles of 0,2 to 0,02 mm. The soil had at establishment been ditched, presenting mesic water hold- ing conditions. Average annual precipitation for the local area during years 1998- 2018 were 755 mm. Rainfall during the period of growth (May-Sept) was 335 mm (44% of annual amount), indicating that drought has been infrequent in these parts.
Figure 2. An overview of the trial site area.
Average annual temperature for 1998-2018 was 8,2 °C, with monthly max of 17,4 °C (July) and monthly minimum of 0 °C (January) (SMHI, 2018b). The trial site is surrounded by two rows of beech trees to prevent edge effects. The surrounding forest stands consist of mixed species of Norway spruce (Picea abies), Scots pine (Pinus sylvestris), Red oak (Quercus rubra) presenting moderate shelter against ex- posure to strong winds.
was performed with additional measurements of diameter, height, mortality rate, lateral branch division, stem crookedness and phenological expression (Stener 2008).
3.3 Data collection
Since 2007, stand development has been unrecorded until autumn/winter 2018/2019, when the data for this thesis was collected. The following variables were measured in the trial: survival, stem diameter, height, stem crookedness, amount of double stems above and below 4,5 m, and amount of lateral branch divisions above and below 4,5 m.
a) Survival (Surv) Scored as 1 if alive and 0 if dead for all trees (n =4851) b) Stem diameter (dia18) was recorded for all living trees (n=2844) on a
continuous scale (in mm) with a Haglöf DP II measuring caliper connected to an Allegro 2 Field Computer.
c) Tree height (H18) describes the total height, and was recorded for 101 randomly sampled trees (in dm) with a Haglöf Vertex IV with a T3 transponder, also on a continuous scale. Height increment was then calculated from the last data recorded in 2007 by Skogforsk.
d) Stem crookedness (Crk) of the trees was determined subjectively on a scale
from 0, 1, 2 through visual inspection from two perpendicular viewpoints for all living trees (n=2844). A zero indicates a stem form that is straight from two onlooking angles, 1 indicates crookedness from one of the two onlooking angles, and 2 indicates poor stem quality where crookedness is found from both points of view.
e) Double stem (DstmU and DstmL). The frequency of double stems was
measured for all living trees (n=2844). Here, a double stem is defined as a branch larger in diameter than 1/3rd of the main stem it is branching off from. Double stems found in the lower portion of the trunk (DstmL , below
4,5 m height) were recorded separately from double stems present on the trunk above 4,5 m (DstmU). For both of these two variables, the amount of
double stems was recorded ranging in value from 0 to 4.
f) Lateral branch division (FrkL and FrkU) was measured on a discrete scale
counting number of lateral branch divisions for all living trees (n=2844). Branches forking off from the lower part of the stem (FrkL , below 4,5 m)
were recorded separately from the branches growing from the upper part of the stem (FrkU , above 4,5 m). If the tree had several stems, lateral branches
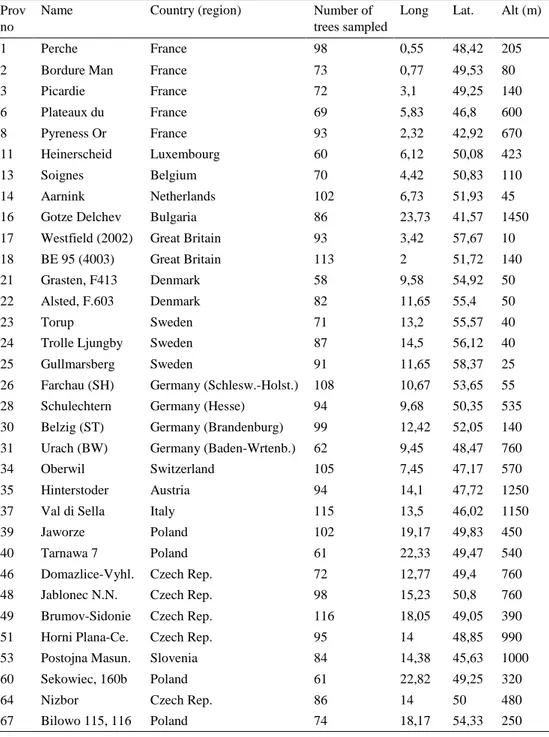
Table 1. Established provenances at Trolleholm trial site
Prov no
Name Country (region) Number of trees sampled
Long Lat. Alt (m)
1 Perche France 98 0,55 48,42 205 2 Bordure Man France 73 0,77 49,53 80 3 Picardie France 72 3,1 49,25 140 6 Plateaux du France 69 5,83 46,8 600 8 Pyreness Or France 93 2,32 42,92 670 11 Heinerscheid Luxembourg 60 6,12 50,08 423 13 Soignes Belgium 70 4,42 50,83 110 14 Aarnink Netherlands 102 6,73 51,93 45 16 Gotze Delchev Bulgaria 86 23,73 41,57 1450 17 Westfield (2002) Great Britain 93 3,42 57,67 10 18 BE 95 (4003) Great Britain 113 2 51,72 140 21 Grasten, F413 Denmark 58 9,58 54,92 50 22 Alsted, F.603 Denmark 82 11,65 55,4 50 23 Torup Sweden 71 13,2 55,57 40 24 Trolle Ljungby Sweden 87 14,5 56,12 40 25 Gullmarsberg Sweden 91 11,65 58,37 25 26 Farchau (SH) Germany (Schlesw.-Holst.) 108 10,67 53,65 55 28 Schulechtern Germany (Hesse) 94 9,68 50,35 535 30 Belzig (ST) Germany (Brandenburg) 99 12,42 52,05 140 31 Urach (BW) Germany (Baden-Wrtenb.) 62 9,45 48,47 760 34 Oberwil Switzerland 105 7,45 47,17 570 35 Hinterstoder Austria 94 14,1 47,72 1250 37 Val di Sella Italy 115 13,5 46,02 1150 39 Jaworze Poland 102 19,17 49,83 450 40 Tarnawa 7 Poland 61 22,33 49,47 540 46 Domazlice-Vyhl. Czech Rep. 72 12,77 49,4 760 48 Jablonec N.N. Czech Rep. 98 15,23 50,8 760 49 Brumov-Sidonie Czech Rep. 116 18,05 49,05 390 51 Horni Plana-Ce. Czech Rep. 95 14 48,85 990 53 Postojna Masun. Slovenia 84 14,38 45,63 1000 60 Sekowiec, 160b Poland 61 22,82 49,25 320 64 Nizbor Czech Rep. 86 14 50 480 67 Bilowo 115, 116 Poland 74 18,17 54,33 250
3.4 Statistical analysis
A Generalized Linear Mixed Model (GLMM) was used to analyze the effect of ‘Provenance’ on each of the studied variables in section 3.3. A random effects struc- ture was included in the model to consider spatial dependence of measurements. Block, plot (nested in block) and tree (nested in plot), and block random effects were added to the model, affecting the intercept of regression. This made it possible to consider within stand variation that could not be explained only by the included independent variables (Winter 2013).
To determine the best random structure, different random structures were fitted by maximizing the restricted log-likelihood in a beyond optimal model (Zuur et al 2009). The random structures were then compared with each other, and the random structure with the lowest value of the Akaike information criterion (AIC) was then selected as the most parsimonious one.
In addition to ‘Provenance’, other fixed effects such as the traits of the tree structure as double stem, stem crookedness and lateral branch division were also included as independent variables to evaluate their effect on response variables. This allowed estimation of the main objective of the thesis: to estimate differences among beech provenances in survival, growth and the traits of the tree structure which define tim- ber quality (Table 2.). The model is summarized as follows:
𝑦𝑦𝑖𝑖𝑖𝑖𝑖𝑖 = 𝛼𝛼0+ 𝛼𝛼1∗ 𝑓𝑓(𝑡𝑡𝑡𝑡𝑡𝑡𝑡𝑡𝑡𝑡𝑡𝑡) + 𝛼𝛼2∗ 𝑃𝑃𝑡𝑡𝑃𝑃𝑃𝑃𝑃𝑃𝑃𝑃𝑡𝑡𝑃𝑃𝑃𝑃𝑃𝑃 + 𝑤𝑤𝑖𝑖+ 𝑢𝑢𝑖𝑖𝑖𝑖+ 𝑃𝑃𝑖𝑖𝑖𝑖𝑖𝑖+ 𝜀𝜀𝑖𝑖𝑖𝑖𝑖𝑖 [1]
where yijk is the studied variable for tree i in plot j and block k; 𝜶𝜶𝒊𝒊 represent the param-
eter regression covariate coefficients; f(traits) is linear function of traits of the tree structure variables. Provenance represents the dummy variable for beech prove-
nances; 𝑤𝑤𝑖𝑖~N(0, σk) is the block random effect; 𝑢𝑢𝑖𝑖𝑖𝑖~N(0, σjk) is the plot random
effect, 𝑃𝑃𝑖𝑖𝑖𝑖𝑖𝑖~N(0, σijk) is the tree random effect and εijk~N(0, σe) is the error term.
A post-hoc analysis was then performed with multiple comparisons of means using Tukey’s contrasts to determine differences between beech provenances. In order to preserve model accuracy a visual inspection of residuals was also performed to de- termine the degree of heteroscedasticity of residuals. This was detected when the residual variance was not homogeneous. This was solved by fitting a variance func- tion with weights to control the variance of residuals, when necessary (see 'Appen-
dix 2 - Tables' for details) (Pinheiro & Bates 2000). Different error distributions
were used to fit the final models depending on the possible values of the response variable (Table 2.).
The packages ‘nlme’ (Pinheiro et al 2015) and ‘multcomp’ (Hothorn et al 2008) were used for the statistical analysis. All analyses were performed in the software
Survival
The data describing the ‘Survival’ variable was binary, where a 0 indicated a dead sample and a 1 indicated a living sample. The GLMM used a binomial error distri- bution to represent this in the model.
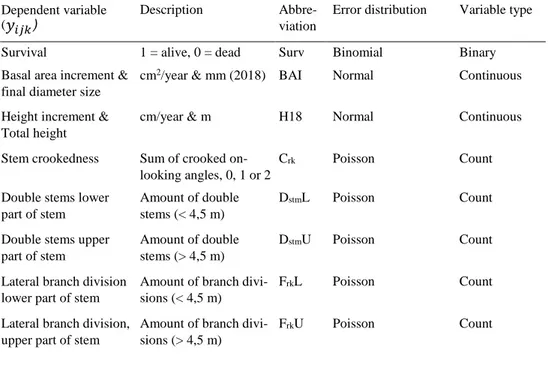
Table 2. The eight variables studied in this thesis, their abbreviations and the error distributions.
Dependent variable (𝑦𝑦𝑖𝑖𝑖𝑖𝑖𝑖)
Description Abbre- viation
Error distribution Variable type
Survival 1 = alive, 0 = dead Surv Binomial Binary Basal area increment &
final diameter size
cm2/year & mm (2018) BAI Normal Continuous
Height increment & Total height
cm/year & m H18 Normal Continuous
Stem crookedness Sum of crooked on- looking angles, 0, 1 or 2
Crk Poisson Count
Double stems lower part of stem
Amount of double stems (< 4,5 m)
DstmL Poisson Count
Double stems upper part of stem
Amount of double stems (> 4,5 m)
DstmU Poisson Count
Lateral branch division lower part of stem
Amount of branch divi- sions (< 4,5 m)
FrkL Poisson Count
Lateral branch division, upper part of stem
Amount of branch divi- sions (> 4,5 m)
FrkU Poisson Count
Basal area increment & final diameter size
Following the recommendations of Garcia (2018), the stem diameter measurements were not included in the mixed linear regression as an independent variable. Ac- cording to the author, when the aim is to model new growth development under changing environmental conditions, stem diameter and basal area should be omitted from the fixed effects. This is because these variables simplify a complex natural growth pattern. For this reason, the current size of the trees should not be included as an independent variable as there is no causal relationship between existing tree size and increased growth (Garcia 2018). Rather, the relationship is such that in- creased growth leads to greater tree size.
The diameter values recorded in 2018 were used to calculate basal area increment for each tree. Mean BAI was calculated based on a cylindrical tree shape in cm²/year. The six recorded variables DstmL, DstmU, FrkU, FrkL, Crk and ‘Provenance’ were then
included in the fixed effects of the generalized linear mixed model to describe any potential effects on the basal area increment BAI. The random structure included plot nested in block and tree nested in plot and block.
Height increment and total height
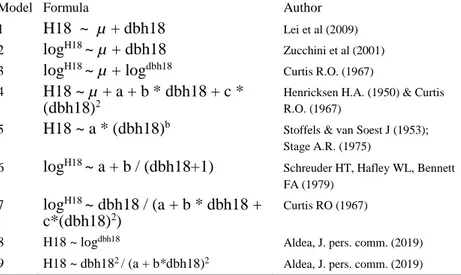
Only a subsample of trees and provenances were recorded for practical reasons in 2018/19. In order to predict the height accurately for the remainder of the trees, nine models describing the height-diameter relationship were made based on suggestions from previous literature (Table 3.). The height increment (HI) was then calculated for the period 2007-2018. Included in the random structure was tree nested in plot and block, and plot nested in block, as well as only block.
Table 3. Models suggested by previous literature describing the relationship between height and di- ameter fitted to a linear regression.
Model Formula Author 1 H18 ~ µ + dbh18 Lei et al (2009)
2 logH18 ~ µ + dbh18
Zucchini et al (2001)
3 logH18 ~ µ + logdbh18 Curtis R.O. (1967)
4 H18 ~ µ + a + b * dbh18 + c * (dbh18)2
Henricksen H.A. (1950) & Curtis R.O. (1967)
5 H18 ~ a * (dbh18)b
Stoffels & van Soest J (1953); Stage A.R. (1975)
6 logH18 ~ a + b / (dbh18+1)
Schreuder HT, Hafley WL, Bennett FA (1979)
7 logH18 ~ dbh18 / (a + b * dbh18 +
c*(dbh18)2)
Curtis RO (1967)
8 H18 ~ logdbh18 Aldea, J. pers. comm. (2019)
9 H18 ~ dbh182 / (a + b*dbh18)2 Aldea, J. pers. comm. (2019)
Stem crookedness
Stem crookedness was evaluated on a scale from 0,1,2 as the sum of onlooking an- gles where crookedness was found. A generalized linear mixed model with Pois- son error distribution was used to describe differences among beech provenances and the effect of traits that describes the tree structure as independent variables. The random structure included only block.
Double stem
The tendency of beech to develop double stems was also analysed among prove- nances. Here, the data was fitted to a generalized linear mixed model with poisson distribution. For double stems on the upper part of the tree, five independent varia- bles ‘dia18, ‘DstmL’, ‘FrkL’, ‘Crk’ and ‘Provenance’ were included in the fixed ef-
fects. Block was included in the nested random effects.
Lateral branch division
The tendency of the tree to develop several branches in the lower (< 4,5 m) and in the upper ( > 4,5 m) portion of the stem can give an indication of timber quality for specific provenances. Two generalized linear mixed models were used to fit the re- lationship between amount of forks and several independent variables. For the
model describing forks at the lower part of the stem, block and plot were considered whereas only block was used in the final random effect structure.
4
Results
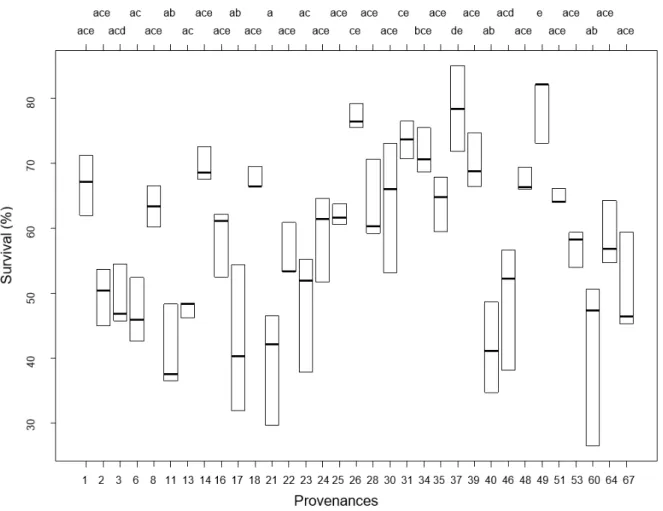
4.1 Survival
Overall stand mean survival was 58,7 % in 2018 which was lower in comparison to measurements taken in 2007 when mean survival was 77%. A Tukey’s pairwise comparison revealed also a high performance for provenances ‘Farchau (SH).’ from Germany, and ‘Val. Di Sella’ from Italy. Highest survival was found for the Czech provenance ‘Brumov-Sidonie’ where survival was 78,9 % (Figure 3).
The Danish provenance ‘Grasten F413’ had the highest mortality with stand sur- vival of 39,5 %. Provenances ‘Heinersheid’ from Luxembourg, ‘Sekowiec 160b.’ and ‘Tamawa’ from Poland had also high within-stand mortality. Swedish prove- nances showed modest results: ‘Torup’, ‘Trolle-Ljungby’, and ‘Gullmarsberg’ had together 56,5 % as a mean value for survival. See Appendix 2 – Supplementary Table
Figure 3. Survival provenance differences at 2018. Different letters denote significant differences at 0.05 significance level. The black lines indicate the mean value for the specific provenance.
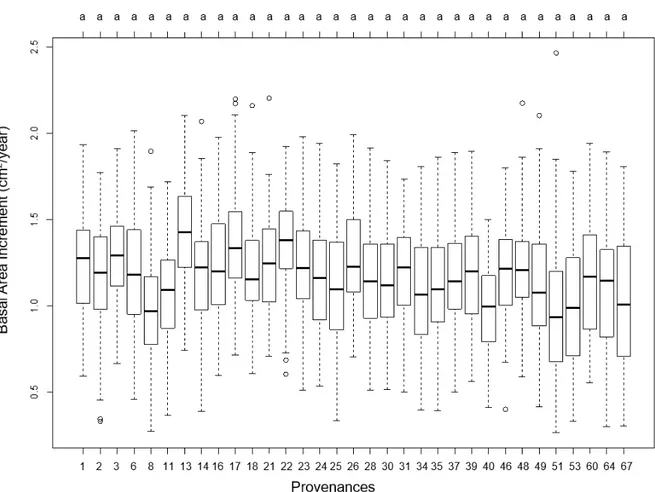
4.2 Basal area increment & final diameter size
A pairwise comparison revealed that no significant differences between prove- nances could be found for BAI or diameter size at 2018/19 (Figure 4 & Supplemen-
tary figure 2). The general tree growth was quite even despite the varying genetic
backgrounds of the plant material.
The six recorded variables DstmL, DstmU, FrkL, FrkU, Crk and ‘Provenance’ showed
to be significant independent variables in the mixed linear regression model that described the basal area increment BAI (Appendix 2 - Supplementary Table 2). BAI was negatively correlated with increased crookedness, indicating that straight tree stems had higher diameter growth. BAI increased double stems above & below 4,5 m, as well as lateral branch division above and below 4,5 m.
The average stem diameter for the whole stand was 8,1 cm at 2018, compared to 2007 when the diameter was 7,1 cm. The mean diameter for specific provenances at 2007 and 2018 are presented in Figure 5.
Figure 4. Differences in basal area increment for provenances in 2018. Different letters denote significant differ- ences at 0.05 significance level. The black lines indicate the mean value for the specific provenance.
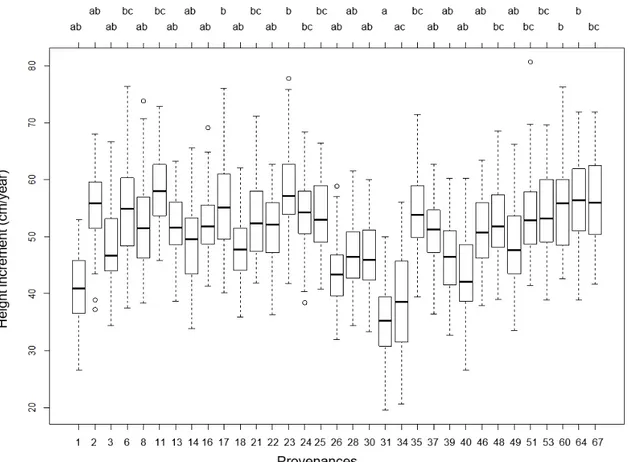
4.3 Height increment & total height
Mean stand height for 2018 was 9,60 m (n=101). In comparison, the mean height of 2007 was 4,01 m (n=3744). Pairwise comparisons revealed the provenances ‘Westfield’ from Great Britain, ‘Torup’ from Sweden, ‘Sekowiec, 160b’ from Po- land and ‘Nizbor’ from Czech Republic as superior in height performance. The Ger- man provenance ‘Urach (BW)’ and the Swiss provenance ‘Oberwil.’ had lower height increment (Figure 6.).
The frequency of double stems in the lower and upper part of the stem (DstmL, DstmU)
and the amount of lateral branch divisions in the lower and upper part of the stem (FrkL, FrkU) showed to be positively correlated with height. Height was affected
negatively by increased stem crookedness (Appendix 2 - Supplementary Table 3). The height-diameter curve for model 6 is presented in Appendix 1 – Supplementary
Figure 1. Akaikes Information Criterion was used to evaluate the 9 height-diameter
models (see Table 3). AIC selected number 6 as the most parsimonious. This model was used for predicting height values for 2018 and finally to calculate height incre- ment from 2007.
Figure 5. The mean stem diameter for each provenance at breast height in 2007 (orange) and 2018 (blue).
Provenance D ia m e te r a t b rea s t he igh t 2 01 8 ( mm )
The frequency of double stems in the lower and upper part of the stem (DstmL, DstmU)
and the amount of lateral branch divisions in the lower and upper part of the stem
4.4 Stem crookedness
The level of stem crookedness is an indicator for quality in wood production of beech. The provenance ‘Hinterstoder’ (Austria) had the lowest stem crookedness
(Figure 7.). The German provenance ‘Urach B.W.’ and the Swiss provenance
‘Oberwil.’ showed the most crooked stems. Higher frequency of double stems in the lower part of the stem (< 4,5 m) increased stem crookedness (Supplementary
Table 4, Appendix 2) an indication of poor quality for wood production.
4.5 Double stem (< 4,5 m)
Provenances ‘Perche’ from France and ‘Alsted F.413’ from Denmark showed su- perior performance following post-hoc comparisons with a statistically significant low value, indicating higher quality for future wood production (Figure 8.). Prove- nances ‘Heinerscheid’ from Luxembourg, ‘Aarnink’ from the Netherlands, ‘Urach
(BW).’ from Germany, and ‘Bilowo 115,116’ from Poland had a high tendency to
develop double stems.
Figure 6. Differences in height increment for provenances in 2018. Different letters denote significant differences at 0.05 significance level. The black lines indicate the mean value for the specific provenance.
Figure 7. Differences in stem crookedness for provenances in 2018. Different letters denote significant differences at 0.05 significance level. The black lines indicate the mean value for the specific provenance.
4.6 Double stem (> 4,5 m)
‘Farchau (SH)’ and ‘Urach (BW)’, both from Germany, presented lower tendency of developing double stems. The French provenance ‘Plateaux du.’ showed higher number of double stems on the upper part of the stem (Figure 9.). The tree tendency to develop double stems above 4,5 m height was increased with increased diameter and crookedness (Appendix 2 - Supplementary Table 6).
Figure 8. Differences between provenances for the tendency to develop double stems below 4,5 m on the stem in 2018. Different letters denote significant differences at 0.05 significance level. The black lines indicate the mean value for the specific provenance.
4.7 Lateral branch division < 4,5 m
The amount of branches on the stem can give an indication of the amount of knots present in the wood. Large number of branches may increase the knot formation which can lead to decreased wood quality. ‘Farchau (SH)’ (Germany) had low ten- dency to develop large branches. Provenance ‘Postojna Masun.’ (Slovenia) devel- oped significantly more branches (Figure 10).
The frequency of forks present below 4,5 m height on the tree increased with tree diameter and increased crookedness but decreased with the frequency of double stems below 4,5 m indicating that trees with fewer double stems have more low branches (Appendix 2 - Supplementary Table 7).
Figure 9. Differences between provenances for the tendency to develop double stems above 4,5 m on the stem in 2018. Different letters denote significant differences at 0.05 significance level. The black lines indicate the mean value for the specific provenance.
4.8 Lateral branch division > 4,5 m
There were no differences between provenances for the tendency to develop lateral branches above 4,5 m (Figure 11.). Diameter at breast height increased number of lateral branches, but double stems and forks at lower part of the stem was nega- tively correlated with frequency of forks at upper parts (Appendix 2 - Supplementary
Figure 10. Differences between beech provenances for the mean number of lateral branches at lower part of the stem (< 4.5 m). Different letters denote significant differences at 0.05 significance level. The black lines indicate the mean value for the specific provenance.
Figure 11. Differences between beech provenances for the mean number of lateral branches at the upper part of the stem (> 4.5 m). Different letters denote significant differences at 0.05 significance level. The black lines indicate the mean value for the specific provenance.
5
Discussion
5.1 Survival, growth and timber quality traits of European
beech at the trial site
The first specific objective of this thesis was to identify differences among European beech provenances on survival rate. Results show that provenances with low sur- vival varied distinctly in latitude and altitude, revealing no clear pattern that could explain the higher mortality rates or support for the first hypothesis. The Swedish provenances generally showed lower survival in comparison to more southern prov- enances. The analysis of survival also showed similar results in 2008, with the Ital- ian provenance ‘Val di. Sella’ and German provenance ‘Farchau (SH)’ as having low stand mortality during this first assessment as well.
The Swedish provenance ‘Torup’ had a very good growth performance with respect to height increment, indicating that the Swedish genetic material is well adapted to growth conditions at these latitudes. This partially supported the second hypothesis of this thesis. No differences could be found between provenances for stem diameter or basal area increment. In order to make as accurate recommendations as possible it is essential to get more information about traits associated with the establishment for growth.
The third objective of the thesis was to identify general trends and correlations in the traits of the tree structure and growth of beech provenances along a Europe-wide geographical gradient of climate and elevation. A general trend in the tree structural traits could be identified as the results show a negative effect of stem crookedness and frequency of double stems on tree growth (Appendix 2 - Supplementary Table
3.). The results from this thesis correlate well with results from 2008 concerning
stem crookedness. The Austrian provenance ‘Hinterstoder’ showed low values for stem crookedness at the time as well.
5.2 The consequences of differences among European
beech provenances
Future climate change will have implications for the management of plantation for- ests (Felton et al 2016; Strömme et al 2019). The current regeneration of European beech in Sweden will at the end of its rotation experience significantly different growing conditions then at establishment (Kirilenko et al 2007). Having climati- cally well adapted regeneration material becomes increasingly important to reduce potential economic loss (Stener et al 2008). Climatic adaptation is therefore of importance for a successful establishment and to maintain a high quality production in beech plantation forestry.
The degree of plasticity and the adaptive response of European beech to environ- mental change will have an important role in shaping future forest development (Thuiller et al 2008). Seedling growth, phenological development, drought tolerance and frost sensitivity will all play vital roles in the future northern distribution of the species (Eilmann et al 2014; Vitasse & Basler, 2013; Strömme et al 2019).
Due to anthropogenic climate change, the environmental changes with associated fluctuations in local temperature, water and nutrient availability in Sweden will lead to a need for assessment of the suitability of the regeneration material.
Trees in particular have a high inherent genetic diversity within individuals (Bravo et al 2017). Studies show that beech forest cover is projected to decrease in the southern range of its distribution and increase its northward spread with current cli- mate change model projections (Sykes and Prentice 1996; Kramer et al 2010.). The results of studied height increment for the Swedish provenance ‘Torup’ indicate that this native genetic material performs well.
Leaf photosynthesis is the main factor determining radial growth increase in beech (Michelot et al 2012). Contrary to growth in other deciduous species such as oak, radial growth starts at the time of budburst in beech (Michelot et al 2012) and reaches maximum when leaves have developed to their full extent (Principe et al 2017). As the timing of spring flushing varies between provenances (Eilmann et al 2014; Vitasse & Basler 2013; Stener 2008), there is differing potential for carbon assimilation between provenances during one season of growth established at one single site. Provenances from maritime regions have a tendency to flush later in comparison to provenances from continental regions, resulting in a shorter period for potential stem diameter increment (Stener, 2008).
Low water availability and associated physiological stress could become a limiting factor for growth in the future. Southern beech provenances have previously shown better performance under water stress conditions (Eilmann et al 2014). However, no significant influence on basal area increment could be determined in this study that would support specific establishment of a more southern provenance. However, the
results from this study show that the frequency of tree branches above 4,5 m in- creased basal area increment. This might be because more high-positioned branches allow increased exposure of high leaves to sunlight. Reliable recommendations re- quire additional studies of growth and development in the coming decades to deter- mine the influence of provenance on traits related to growth.
The environmental controls of bud break are still not fully understood for beech (Vitasse & Basler, 2013; Strömme et al 2019), but susceptibility to frost damage has shown to vary between provenances as it is related to the timing of budburst (Hof- mann et al 2015). Additional studies of the phenological development of European beech at the northern distribution limit may also prove vital to supply further infor- mation on the effect of late frost on stand development.
6
Conclusions
The results show that even though beech can be considered a plastic species with a good adaptive response to varying environmental conditions, the genetic back- ground has an important role in shaping stand development for several timber qual- ity characteristics. The native provenances performed well or better in some cases compared to Mediterranean and Central European provenances with respect to height increment, as seen in the Swedish provenance ‘Torup’. However, South and Central European beech provenances established at this northern location showed high plasticity and ability to adapt to Swedish growth conditions. This resulted in high survival ratios, and better timber quality features.
The interaction between the environmental controls of growth and the genetic pre- disposition is complex. Therefore, preserving as many populations of beech prove- nances as possible may prove an important means to keep future desirable traits to cope with climate change.
Comparison of growth between provenances at different sites can hopefully lead to better understanding of the effect of climate change in the future.
References
Agestam, E., Ekö, P.-M., Nilsson, U., Welander, N.T. 2003. The effects of shelterwood density and site preparation on natural regeneration of Fagus sylvatica in southern Sweden. Forest Ecology and Management. 176: 61–73. Allen, Craig D., Macalady, A. K., Chenchouni, H., Bachelet, D., Mcdowell, N., Vennetier, M., Kitzberger, T., Rigling, A., Breshears, D. D., Hogg, E.H.,
Gonzalez, P., Fensham, R., Zhang, Z., Castro, J., Demidova, N., Lim, J-H., Allard, G., Running, S.W., Semerci, A., Cobb, N. 2010. A global overview of drought and heat-induced tree mortality reveals emerging climate change risks for forests. Forest Ecology and Management. 259: 660-684.
Bolte, A., Hilbrig, L., Grundmann, B., Kampf, F., Brunet, J., Roloff, A. 2010. Climate change impacts on stand structure and competitive interactions in a southern Swedish spruce–beech forest. European Journal of Forest Research. 129: 261-276.
Bosela, M., Lukac, M., Castagneri, D., Sedmák, R., Biber, P., Carrer, M., Konôpka, B., Nola, P., Nagel, T. A., Popa, I., Roibu, C. C., Svoboda, M., Trotsiuk, V., Büntgen, U. 2018. Contrasting effects of environmental change on the radial growth of co-occurring beech and fir trees across Europe. Science of the Total Environment. 615: 1460–1469.
Bravo, F., Lemay, V., Jandl, R., Von Gadow, K. (Editor), Pukkala, T. (Editor), Tomé, M. (Editor), Bravo, F.(Editor), Lemay, V. (Editor), Jandl, R. (Editor). 2017. Managing forest ecosystems: the challenge of climate change. 2nd ed. Cham: Springer International Publishing. Web.
Brunet, J. 1995. Sveriges bokskogar har gamla rötter. Svensk Botanisk Tidskrift. 89: 1-10.
Brunet, J., Fritz, Ö. 2011. Swedish beech forests distribution and conservation status. BfN - Skripten (Bundesamt für Naturschutz). 297. 21-32.
Christensen, J. H., and Christensen, O. B. 2007. A summary of the PRUDENCE model projections of changes in European climate by the end of this century. Climatic Change. 81: 7-30.
Curtis, R. O. 1967. Height-diameter and height-diameter-age equations for second-growth Douglas-fir. Forest Science. 13.4: 365-375.
Dury M., Hambuckers A., Warnant P., Henrot A., Favre E., Ouberdous M., François L. 2011. Responses of European forest ecosystems to 21st century climate: assessing changes in interannual variability and fire intensity. iForest: Biogeosciences and Forestry. 4: 82-99.
Eilmann, B., Sterck, F., Wegner, L., De Vries, S. M. G., Von Arx, G., Mohren, G. M. J., Den Ouden, J., Sass - Klaassen, U., Mäkelä, A. 2014. Wood structural differences between northern and southern beech provenances growing at a moderate site. Tree Physiology. 34: 882–893.
Felton, A., Ellingson, L., Andersson, E., Drössler, L., Blennow, K. 2010. Adapting production forests in southern Sweden to climate change: constraints and opportunities for risk spreading. International Journal of Climate Change Strategies and Management. 2: 84-97.
Felton, A., Gustafsson, L., Roberge, J.-M., Ranius, T., Hjältén, J., Rudolphi, J., Lindbladh, M., Weslien, J., Rist, L., Brunet, J., Felton, A.M., 2016. How climate change adaptation and mitigation strategies can threaten or enhance the
biodiversity of production forests: Insights from Sweden. Biological Conservation. 194: 11–20.
Frank, A., Pluess, A., Howe, G., Sperisen, C., Heiri, C. 2017. Quantitative genetic differentiation and phenotypic plasticity of European beech in a
heterogeneous landscape: indications for past climate adaptation. Perspectives in Plant Ecology, Evolution and Systematics. 26: 1-13.
Fritz, Ö., Brunet, J., Caldiz, M. 2009. Interacting effects of tree characteristics on the occurrence of rare epiphytes in a Swedish beech forest area. The Bryologist. 112: 488–505.
Garcia, O. 2018. Reverse causality in size-dependent growth. Mathematical and Computational Forestry & Natural Resource Sciences. 10: 1.
Girardin, M., and Terrier, A. 2015. Mitigating risks of future wildfires by management of the forest composition: an analysis of the offsetting potential through boreal Canada. Climatic Change. 130: 587–601.
Hamrick, J. L. 2004. Response of forest trees to global environmental changes. Forest Ecology and Management. 197: 323-335.
Henricksen, H. A. 1950. Height–diameter curve with logarithmic diameter. Dansk Skovforenings Tidsskrift 35: 193-202.
Hofmann, M., Durka, W., Liesebach, M., Bruelheide, H., 2015. Intraspecific variability in frost hardiness of Fagus sylvatica L. European Journal of Forest Research 134: 433–441.
Hothorn, T., Bretz, F., Westfall, P. 2008. Simultaneous inference in general parametric models. Biometrical Journal. 50: 346-363.
Houston Durrant, T., de Rigo, D., Caudullo, G. 2016. Fagus sylvatica L. and other beeches in Europe: distribution, habitat, usage and threats. In: San-Miguel-Ayanz, J., de Rigo, D., Caudullo, G., Houston Durrant, T., Mauri, A. (Eds.), European Atlas of Forest Tree Species. Publ. Off. EU. Luxembourg.
IPCC. 2013. Summary for policymakers. In: climate change 2013: The physical science basis. Contribution of working group I to the fifth assessment report of the intergovernmental panel on climate change. CEUR Workshop Proc.
Kirilenko, A.P. 2007. Climate change impacts on forestry. Proceedings of the National Academy of Sciences of the United States of America. 104: 19697– 19702.
Kramer, K. 2007. Resilience of European forests: towards a non-equilibrium view for the management of diversity. Climate change and forest genetic diversity: Im- plications for sustainable forest management in Europe. Rome, Italy, 15-16 March 2007.
Kramer, K., Degen, B., Buschbom, J., Hickler, T., Thuiller, W., Sykes, M. T., de Winter, W. 2010. Modelling exploration of the future of European beech
(Fagus sylvatica L.) under climate change—range, abundance, genetic diversity and adaptive response. Forest Ecology and Management 259: 2213-2222. Lei , X., Peng, C., Wang, H., Zhou, X. 2009. Individual height–diameter models for young black spruce (Picea mariana) and jack pine (Pinus banksiana) plantations in New Brunswick, Canada. The Forestry Chronicle. 85: 43-56.
Lodin, I., Brukas, V., and Wallin, I. 2017. Spruce or not? Contextual and atti- tudinal drivers behind the choice of tree species in southern Sweden. Forest Policy and Economics 83: 191–198.
Löf, M., Brunet, J., Hickler, T., Birkedal, M., Jensen, A. 2012. Restoring broadleaved forests in southern Sweden as climate changes. A goal-oriented approach to forest landscape restoration. Springer, Dordrecht. p. 373-391.
Malcolm, J. R., Markham, A., Neilson, R. P., Garaci, M. 2002. Estimated migration rates under scenarios of global climate change. Journal of Biogeography 29: 835–849.
Matthews, John D. 1991. Silvicultural systems. Oxford University Press. Michelot, A., Simard, S., Rathgeber, C., Dufrêne, E., Damesin, C., Mäkelä, A. 2012. Comparing the intra-annual wood formation of three European species (and) as related to leaf phenology and non-structural carbohydrate dynamics. Tree Physiology 32: 1033–1045.
Nilsson and Cory. 2018. Forest statistics 2018 - Official Statistics of Sweden. Swedish University of Agricultural Sciences, Umeå 2018 Skogsdata. Insti- tutionen för skoglig resurshushållning.
Paffetti, D., Travaglini, D., Buonamici, A., Nocentini, S., Vendramin, G. G., Giannini, R., Vettori, C. 2012. The influence of forest management on beech (Fagus sylvatica L.) stand structure and genetic diversity. Forest Ecology and Management. 284: 34–44.
Pinheiro, J. C., and Bates, D. M. 2000. Linear mixed-effects models: basic con- cepts and examples. Mixed-effects models in S and S-Plus. p. 3-56.
Pinheiro J., Bates D., DebRoy S., Sarkar D. R Core Team. 2015. nlme: linear and nonlinear mixed effects models. R package version 3.1-120.
Príncipe, A., van Der Maaten, E., van Der Maaten-Theunissen, M., Struwe, T., Wilmking, M., Kreyling, J. 2017. Low resistance but high resilience in growth of a major deciduous forest tree (Fagus sylvatica L.) in response to late spring frost in southern Germany. Trees 31: 743–751.
Robson, T. M., Garzón, M. B., Miranda, R. A., et al. 2018. Phenotypic trait variation measured on European ge-netic trials of Fagus sylvatica L. Scientific Data. 5: 180149.
Schreuder, H. T., Hafley, W. L., and Bennett, F. A. 1979. Yield prediction for unthinned natural slash pine stands. Forest Science. 25: 25-30.
Stage, A. R. 1975. Prediction of height increment for models of forest growth. Res. Pap. INT-RP-164. Ogden, UT: US Department of Agriculture, Forest Service, Intermountain Forest and Range Experiment Station. 20 p.
Stener, L-G. 2008. Study of survival, height growth, external quality and phe- nology in a beech provenance trial in southern Sweden. Uppsala: Skogforsk. Stener, L-G. 2002. Study of survival, height growth, external quality and spring phenology in two beech provenance trials in southern Sweden. Uppsala: Skogforsk.
Stoffels, A., and Van Soest, J. 1953. The main problems in sample plots. Ned Boschb Tijdschr. 25: 190-199.
Strømme, C. B., Schmidt, E., Olsen, J. E., Nybakken, L. Climatic effects on bud break and frost tolerance in the northernmost populations of Beech (Fagus
Swedish Commission on Climate and Vulnerability (SCCV). 2007. Sweden facing climate change - threats and opportunities. SCCV SOU. 2007:60.
Sykes, M. T., Prentice, I. C., and Cramer W. 1996. A bioclimatic model for the potential distributions of north European tree species under present and future climates. Journal of Biogeography. 203-233.
Valinger, E. 2006. Analys av riskfaktorer efter stormen Gudrun. Skogsstyrelsen. Rapport 8:2006.
Terrier, A., Girardin, M. P., Périé, C., Legendre, P., Bergeron, Y. 2013. Potential changes in forest composition could reduce impacts of climate change on boreal wildfires. Ecological Applications. 23: 21-35.
Thuiller, W., Albert, C., Araújo, M. B., Berry, P. M. Cabeza, M., Guisan, A., Hickler, T., Midgley, G. F. Paterson, J., Schurr, F. M., Sykes, M. T. Zimmermann, N. E. 2008. Predicting global change impacts on plant species’ distributions: future challenges. Perspectives in Plant Ecology, Evolution and Systematics. 9: 137-152.
Vitasse, Y., and Basler, D. 2013. What role for photoperiod in the bud burst phenology of European beech. European Journal of Forest Research 132: 1–8. Weigel, R., Muffler, L., Klisz, M., Kreyling, J., Maaten-Theunissen, M.,
Wilmking, M., Maaten, E. 2018. Winter matters: sensitivity to winter climate and cold events increases towards the cold distribution margin of European beech (Fagus sylvatica L.). Journal of Biogeography. 45: 2779–2790.
Winter, B. 2013. Linear models and linear mixed effects models in R with linguistic applications. arXiv preprint arXiv:1308.5499.
Zucchini, W., Schmidt, M., and Von Gadow K. 2001. A model for the diameter- height distribution in an uneven-aged beech forest and a method to assess the fit of such models. Silva Fennica 35: 169-183.
Zuur A.F., Ieno E.N., Walker N.J., Saveliev A. A., Smith, G. M. 2009. Mixed effects models and extensions in ecology with R. Springer. New York
Internet sources
EUFORGEN (2019). Distribution map of Beech (Fagus sylvatica). CC BY-SA
2.0. Available at: http://www.euforgen.org/fileadmin/templates/euforgen.org/up- load/Documents/Maps/JPG/Fagus_sylvatica.jpg [2019-06-07]
R Core Team (2015). R: A language and environment for statistical computing. R Foundation for Statistical Computing, Vienna, Austria. Available at:
SMHI (2018). Klimatdata. Avaliable at: http://www.smhi.se/klimatdata/meteor- ologi/nederbord [2019-05-16]
SMHI (2018b). Climate data for weather station Hörby A, 1998-2018. Avaliable at: http://www.smhi.se/klimatdata/meteorologi/ladda-ner-meteorologiska-observa- tioner/#param=precipitation24HourSum,stations=all,stationid=53530 [2019-05- 25]
SMHI (2019) “Året väder – 2018” Available at:
https://www.smhi.se/klimat/2.1199/aret-2018-varmt-soligt-och-torrt-ar-1.142756 [2019-06-06]
Sveriges Nationalparker (2019). ”Om Söderåsens nationalpark.” Available at: http://www.sverigesnationalparker.se/park/soderasens-nationalpark/nationalparks- fakta/ [2019-05-25]
Appendix 1 – Supplementary figures
Supplementary Figure S2. Differences between provenances in diameter at breast height (mm) at 2018. Different letters denote significant differences at the 0.05 significance level
Supplementary Figure S3. Provenance differences in height (m) at 2018. Different letters de- note significant differences at the 0.05 significance level.
Appendix 2 – Supplementary tables
Supplementary Table 1. Model-fitted coefficients for survival. n.s.: not significant.
Parameter Coefficient p-value
α0
(Provenance 1) 0.706 0.047α2
(Provenance 2) -0.720 0.039α2
(Provenance 3) -0.747 0.032α2
(Provenance 6) -0.830 0.017α2
(Provenance 8) -0.154 n.s.α2
(Provenance 11) -1.085 0.002α2
(Provenance 13) -0.802 0.021α2
(Provenance 14) 0.124 n.s.α2
(Provenance 16) -0.356 n.s.α2
(Provenance 17) -1.035 0.003α2
(Provenance 18) 0.027 n.s.α2
(Provenance 21) -1.150 0.001α2
(Provenance 22) -0.469 n.s.α2
(Provenance 23) -0.776 0.026α2
(Provenance 24) -0.326 n.s.α2
(Provenance 25) -0.215 n.s.α2
(Provenance 26) 0.511 n.s.α2
(Provenance 28) -0.149 n.s.α2
(Provenance 30) -0.109 n.s.α2
(Provenance 31) 0.328 n.s.α2
(Provenance 34) 0.226 n.s.α2
(Provenance 35) -0.123 n.s.α2
(Provenance 39) 0.149 n.s.α2
(Provenance 40) -1.058 0.003α2
(Provenance 46) -0.749 0.032α2
(Provenance 48) 0.0166 n.s.α2
(Provenance 49) 0.647 n.s.α2
(Provenance 51) -0.096 n.s.α2
(Provenance 53) -0.414 n.s.α2
(Provenance 60) -1.076 0.002α2
(Provenance 64) -0.356 n.s.α2
(Provenance 67) -0.691 0.047σ
jk(Plot) 0.305ε
ijk (error) 0.599Supplementary Table 2. Model-fitted coefficients for basal area increment. n.s.: not significant.
Parameter Coefficient p-value
α0
(Provenance 1) 0.707 <0.001α1
(Dstm_L) 0.095 <0.001α1
(Dstm_U) 0.221 <0.001α1
(Frk_L) 0.121 <0.001α1
(Frk_U) 0.301 <0.001α1
(Crk) -0.081 <0.001α2
(Provenance 2) -0.251. n.s.α2
(Provenance 3) 0.037 n.s.α2
(Provenance 6) -0.177 n.s.α2
(Provenance 8) -0.321 n.s.α2
(Provenance 11) -0.294 n.s.α2
(Provenance 13) 0.046 n.s.α2
(Provenance 14) -0.167 n.s.α2
(Provenance 16) -0.0158 n.s.α2
(Provenance 17) 0.1145 n.s.α2
(Provenance 18) -0.0241 n.s.α2
(Provenance 21) 0.0497 n.s.α2
(Provenance 22) 0.0916 n.s.α2
(Provenance 23) -0.0905 n.s.α2
(Provenance 24) -0.0917 n.s.α2
(Provenance 25) -0.137 n.s.Parameter Coefficient p-value
α2
(Provenance 26) 0.0864 n.s.α2
(Provenance 28) -0.073 n.s.α2
(Provenance 30) -0.138 n.s.α2
(Provenance 31) -0.0398 n.s.α2
(Provenance 34) -0.110 n.s.α2
(Provenance 35) -0.0778 n.s.α2
(Provenance 37) -0.116 n.s.α2
(Provenance 39) -0.0831 n.s.α2
(Provenance 40) -0.1895 n.s.α2
(Provenance 46) -0.0484 n.s.α2
(Provenance 48) 0.0134 n.s.α2
(Provenance 49) -0.0457 n.s.α2
(Provenance 51) -0.291 n.s.α2
(Provenance 53) -0.326 n.s.α2
(Provenance 60) -0.0578 n.s.α2
(Provenance 64) -0.1826 n.s.α2
(Provenance 67) -0.212 n.s.σ
k (Block) <0.001σ
jk(Plot) 0.134
σ
ijk(Tree) <0.001
σ
e (error) 0.350δ
1* 0.100*Variance function parameter used to model variance residual structure to correct heteroscedasticity as an exponential value of the variance covariate covariate (𝑔𝑔𝑖𝑖𝑖𝑖𝑖𝑖): 𝑉𝑉𝑡𝑡𝑡𝑡�𝜀𝜀𝑖𝑖𝑖𝑖𝑖𝑖� = 𝜎𝜎𝑒𝑒2· 𝑃𝑃(2𝛿𝛿1𝑔𝑔𝑖𝑖𝑖𝑖𝑖𝑖)