Postal address: Visiting address: Telephone:
Box 1026 Gjuterigatan 5 036-10 10 00 (vx)
Factors that Impact Inventory Levels in a
Supermarket System Supplying a
Manufacturing Line
Hampus Dahlin
Martin Pihl
Bachelor Thesis 2014
Industrial Organisation and Management
Postal address: Visiting address: Telephone:
Box 1026 Gjuterigatan 5 036-10 10 00 (vx)
This exam work has been carried out at the School of Engineering in Jönköping in the subject area of logistics and management. The work is a part of the three-year Bachelor of Science in Engineering programme. The authors take full responsibility for opinions, conclusions and findings presented.
Examiner: Per Hilletofth Supervisor: Roy Andersson Scope: 15 credits
Abstract
Purpose - The purpose of this thesis is to identify factors that have an impact on
supermarket inventory levels that supply a manufacturing line and investigate how the impact of these factors can be controlled. In order to fulfill the purpose it was broken down into two research questions.
1. What factors have an impact on supermarket inventory levels supplying a manufacturing line?
2. How can the impact of these factors be controlled?
Method - To answer the research questions a literature study and a case study were
conducted. The empirical findings from the case study and the literature study were used to find the answer to the first research question. The identified factors in the first research question were then analysed with the theoretical framework in order to answer the second research question. Different techniques have been used in order to collect necessary data including documentation studies, interviews, observations and basic training in the case company’s procurement system (GILM).
Findings - Total safety lead time, firm time and shortage impact were discovered during
the case study. These factors were not to found during the literature study because they were specific parameters that are predetermined in the case company’s procurement system. Internal material handling and supermarket order quantity were factors also found during the case study. The identified factors are divided after which tool or method that can be used to gain control over the factor. Four different tools have been identified as solutions to gain control over the internal material handling. The factors that only have one identified tool as a solution are either case specific or not attentive in the theoretical framework as the other tools.
Implications - The identified factors from the literature study are considered as
common factors that can be applied for companies that have a supermarket inventory. If manufacturing companies are facing problems with their supermarket inventory levels they can increase control by investigating the tools and methods presented in this thesis.
Contributions - The factors that were identified during the case study have contributed
with new discoveries in the field of study, since there is limited research done in this subject regarding supermarket systems.
Research limitations - More case studies could have been performed at similar
companies, in order to investigate how generalizable the answers to both research questions are.
Key words - supermarket system, inventory control, material flow, factors, material
Sammanfattning
Sammanfattning
Syfte - Rapportens syfte är att identifiera faktorer som påverkar ett supermarket system
som försörjer en tillverkningslina samt hur dessa faktorers påverkan kan kontrolleras. Rapportens syfte har därefter delats in i två frågeställningar.
1. Vilka faktorer har en påverkan på supermarket systemets lagernivåer som försörjer en tillverkningslina?
2. Hur kan dessa faktorers påverkan kontrolleras?
Metod - För att kunna besvara frågeställningarna har en litteraturstudie och en fallstudie
utförts. Insamlad data har sedan jämförts med det teoretiska ramverket för att besvara den första frågeställningen. Den andra frågeställningen har besvarats genom att utgå från det teoretiska ramverket. Olika metoder har använts för att samla in data såsom dokumentstudier, intervjuer, observationer och grundläggande upplärning i fallföretagets beställningssystem (GILM).
Resultat - Under fallstudien upptäcktes det att total säkerhetsledtid, frystid och
materialbrist var påverkansfaktorer som inte gick att finna under litteraturstudien. Detta beror på att faktorerna är specifika för fallföretaget, samt hur deras beställningssystem är utformat. Den interna materialhanteringen och påfyllnadskvantiteten till supermarket systemet var interna faktorer som även de identifierades under fallstudien. För att öka kontrollen över den interna material hanteringen identifierades fyra verktyg som lösningar på problemet. De faktorer som enbart hade ett verktyg som lösning ansågs vara specifika för fallföretaget eller att de inte inkluderats i det teoretiska ramverket.
Implikationer - De faktorer som identifierades under litteraturstudien anses vara
generella för företag som har ett supermarket system. De metoder och verktyg som presenterades som lösningar för att kontrollera faktorernas påverkan kan appliceras för tillverkande företag som har liknande problem.
Originalitet - De identifierade faktorerna har bidragit med nya upptäckter för
ämnesområdet, då inga tidigare studier gjorts mot ett supermarket system.
Begränsningar - Om fler fallstudier av liknande karaktär hade utförts på flera företag
hade en jämförelse resultatet av dessa och denna studie kunnat göras för att undersöka hur generaliserbart resultatet är.
Nyckelord - supermarketsystem, lagerstyrning, materialflöde, påverkansfaktorer,
Contents
1
Introduction ... 1
1.1 BACKGROUND ... 1
1.2 PROBLEM DESCRIPTION ... 2
1.3 PURPOSE AND RESEARCH QUESTIONS ... 2
1.4 SCOPE AND DELIMITATIONS ... 3
1.5 OUTLINE ... 4
2
Theoretical framework ... 5
2.1 CONNECTION BETWEEN RESEARCH QUESTIONS AND THEORY ... 5
2.2 SUPPLY CHAIN ... 5
2.3 INVENTORY CONTROL ... 6
2.4 WAREHOUSING ... 8
2.5 EIGHT KINDS OF WASTE ... 9
2.6 JUST-IN-TIME... 11
2.7 POSTPONEMENT ... 12
3
Method and implementation ... 13
3.1 CONNECTION BETWEEN RESEARCH QUESTIONS AND METHOD ... 13
3.2 WORK PROCESS ... 14
3.3 RESEARCH APPROACH ... 15
3.4 CASE STUDY ... 15
3.5 DATA COLLECTION ... 15
3.6 DATA ANALYSIS ... 17
3.7 RELIABILITY AND VALIDITY ... 18
4
Empirical data ... 19
4.1 CASE COMPANY DESCRIPTION ... 19
4.2 INTERNAL MATERIAL FLOW ... 19
4.3 GILM ... 20
5
Empirical analysis ... 22
5.1 RESEARCH DIMENSIONS ... 22
5.2 RESEARCH QUESTION I ... 24
5.3 RESEARCH QUESTION II ... 25
6
Discussion and conclusions ... 28
6.1 DISCUSSION OF RESULTS ... 28 6.2 IMPLICATIONS ... 30 6.3 LIMITATIONS ... 30 6.4 CONCLUSIONS ... 33 6.5 FURTHER RESEARCH ... 33
References ... 34
Appendix ... 36
Index of Figures and Tables
Tables of Figures
FIGURE 1:SCOPE OF THIS THESIS ... 3
FIGURE 2:CONNECTIONS BETWEEN THEORY AND RESEARCH QUESTIONS ... 5
FIGURE 3:CONNECTION BETWEEN RESEARCH QUESTIONS AND METHOD ... 13
FIGURE 4:TIME SCOPE ... 14
FIGURE 5:DATA ANALYSIS ... 18
FIGURE 6:INTERNAL MATERIAL FLOW ... 19
FIGURE 7:TOTAL LEAD TIME PART 1003 ... 21
Table list
TABLE 1:INTERVIEWS WITH THE EMPLOYEES. ... 16TABLE 2:OBSERVATIONS AT THE FACTORY ... 17
TABLE 3:TIME DIMENSION ... 22
TABLE 4:SAFETY DIMENSION ... 22
TABLE 5:ORDER DIMENSION... 23
TABLE 6:DEMAND DIMENSION ... 23
TABLE 7:INTERNAL DIMENSION ... 23
TABLE 8:THEORETICAL AND EMPIRICAL FINDINGS ... 25
1 Introduction
This chapter includes background, problem description, research questions, delimitations and outline of the thesis. The objective of this chapter is to give the thesis a specific focus to the field of study. The focus is to formulate a purpose, which will be broken down into research questions.
1.1 Background
Today’s customer demands improved products with shorter and more precise deliveries at a lower cost (Srinivasan, 2012). In order to respond to these demands manufacturing companies have to be competitive in several dimensions, such as cost efficiency, quality, delivery time and process flexibility (Olhager, 2013). According to Porter (1980) there are three different competitive strategies for manufacturing companies to choose from. They are differentiation, cost leadership and focus. These strategies are based on combinations of cost, time, service and quality. Manufacturing companies can use one of these strategies to achieve a competitive advantage (Lysons & Farrington, 2012). Miltenburg (2005) states that when a manufacturing company can defend and attract customers it has competitive advantage, which today is crucial for manufacturing companies’ survival (Bovée, Mescon & Thill, 2006).
The perception of inventory has changed over the years (Battini, Faccio, Persona & Sgarbossa, 2009). A couple of decades ago it was an asset to the company, but today manufacturing companies regard unnecessary inventory as a waste (Liker & Meier, 2006; Lumsden, 2012). The reason is that most products kept in stock don’t increase in value (Liker & Meier, 2006). Also the time dimension has become more important since the customer’s demands for shorter delivery times and more precise deliveries have increased. Today it is more interesting for companies to compete with shorter lead times (Srinivasan, 2012).
Serdarasan (2013) claims that supply chains increase in complexity when the number of relations, activities and processes increase. Logistic activities are exposed for unplanned events, which exposes supply chains to uncertainties. These uncertainties need to be minimized in order for supply chains to work in a cost effective way. When the number of activities in the supply chain increases it also exposes the quality and precision of the delivery to more uncertainties (Lumsden, 2012; Bhatnagar & Sohal, 2005). Jonsson and Mattsson (2011) distinguish between two methods of minimizing uncertainties for manufacturing companies’ material flow. They are quantity hedging and time hedging regarding safety stock dimensioning. Material flows that utilize a supermarket system can achieve smoother and more efficient material flows (Abdulmalek & Rajgopal, 2006). A supermarket system is a buffer or storage area, which supplies manufacturing
processes, mainly storing goods1 with high inventory turnover rate (ITR). Because of the
high ITR goods stored in the supermarket, they should be easily accessible without the use of a forklift or other devices. Supermarket systems can also be referred to as a replenishment system (Abdulmalek & Rajgopal, 2006). According to Battini et al., (2009) manufacturing companies that have identified problems in their replenishment processes can experience efficiency and flexibility problems.
1
Introduction
1.2 Problem description
Manufacturing companies facing problems in their replenishment processes force upstream suppliers to build excessive stock (Battini et al., 2009; Srinivasan, 2012). To be able to compete in today’s global market manufacturing companies need to have control over their inventory levels (Yuanjie, 2013). The more stock manufacturing companies keep the more exposed they are to uncertainty costs associated with warehousing. High inventory levels can lead to scrap, outdated products, increased inventory carrying costs and warehousing costs (Jonsson & Mattsson, 2011). If manufacturing companies have low levels of stock it may lead to delivery problems and production stoppages (Miltenburg, 2005). On the other hand manufacturing companies strive to have the lowest level of inventory possible but still be able to respond to customer demands (Slack & Lewis, 2011; Pong & Mitchell, 2012). If customer demands are not met, manufacturing companies may lose money due to lost sales. Therefore, it is important for manufacturing companies to have control over their inventory levels (Pong & Mitchell, 2012).
Interdependent trends have led to increased uncertainties in recent years (Sheffi & Rice, 2005). Because of this, manufacturing companies need to be more resilient in order to recover quickly from changes and unexpected disruptions (Christopher & Peck, 2004). The authors believe that it is important for manufacturing companies to understand which factors have an impact on supermarket inventory levels that supply a manufacturing line. In order to stay competitive manufacturing companies need to be aware of the impact that these factors cause (Miltenburg, 2005).
In previous discussions, it was stated that manufacturing companies today strives to keep their inventory levels as low as possible. This works well for manufacturing companies that have years of experience with inventory reduction (Slack & Lewis, 2011). But when this trend comes to manufacturing companies where this phenomenon is new, they lack knowledge and skill to be able to handle it. Manufacturing companies that recently started to reduce their inventory levels may not have full control over the internal and external factors that have an impact on their inventory levels (Heizer & Render, 2011; Slack & Lewis, 2011). If the manufacturing company does not have control over factors such as procurement system, material handling, and inventory control, it may lead to undesired effects in the supermarket inventory level (Heizer & Render, 2011). What makes this thesis interesting and up to date is that a lot of manufacturing companies stand before this change (Liker, 2004) and may need some guidelines in their process of gaining control over their supermarket inventory levels. Based on the author’s knowledge there is limited research regarding supermarket inventories, which makes this subject interesting to investigate.
1.3 Purpose and research questions
In the previous section, it was discovered that companies lack control in several factors. This could result in undesired variations in manufacturing companies’ supermarket inventory levels. This study wants to highlight the importance for manufacturing companies to be in control of their supermarket inventory levels. Thus the purpose of this thesis is:
To identify factors that have an impact on supermarket inventory levels that supplies a manufacturing line and investigate how the impact of these factors can be controlled.
In order to fulfill the purpose the authors have broken it down into two research questions. First, the factors that have an impact on the supermarket inventory levels need to be identified. Thus the first research question is:
What factors have an impact on supermarket inventory levels supplying a manufacturing line? When the factors have been identified relevant methods and tools can be used to gain control of the impact from these factors. Thus the second research question is:
How can the impact of these factors be controlled?
In order to answer the research questions a case study will be conducted at a company with a supermarket inventory supplying a manufacturing line. The case study will be made to collect data and cross-reference it with a theoretical framework, hence answering the research questions will fulfill the purpose of this thesis.
1.4 Scope and delimitations
The focus of this thesis is to identify factors that have an impact on supermarket inventory levels supplying a manufacturing line. Therefore, following aspects had to be investigated: the company’s procurement system and the supermarket inside the factory. The scope of this thesis is shown in Figure 1 as the shaded shapes.
Figure 1: Scope of this thesis
The answer to the first research question will only focus on the most crucial factors that impact supermarket inventory levels. This thesis will only focus on the quantitative aspect of the inventory levels hence costs will be overlooked. The authors assume that the level of inventory is the same on the shelf as in the inventory system.
Introduction
1.5 Outline
This thesis is divided into five main chapters. At the beginning of each chapter there is a short introduction text that sums up what can be found in the chapter. This thesis starts with an Introduction to the field of study. The purpose of this chapter is to give the reader an overview of the Problem description and how the structure of this thesis is outlined. The following chapter is Theorethical Framwork where important and relevant theories are described. The authors have chosen to divide this chapter with regards to each research question to create a more coherent structure. After the Theoretical Framework is the Method and Implementation chapter. This chapter includes what kind of techniques and methods were used to gather and analyze data, a step necessary to fulfill the purpose of this thesis. Reliability and validity will also be described in order to increase the credibility of used methods.
In Finding and Analysis the authors will begin with a description of the case company and the supermarket system used within the factory. A presentation of collected data will be analyzed in relation to the Theoretical framework. The result of the research questions will be presented in this chapter. The last chapter is Discussion and conclusions where the authors’ recommendations to the case company and a discussion of method will be presented along with conclusions. The final part of this thesis will give suggestions to future research in the field of study.
2 Theoretical framework
In this chapter the result of the literature study is presented. The chapter is divided after each research question and starts with factors that may have an impact on supermarket inventory levels. Theories regarding the second research question are presented in the later part of this chapter.
2.1 Connection between research questions and theory
The objective of this chapter is to create a theoretical framework, which connects relevant theories to each research question. Figure 2 assists the reader to understand how the theory and research questions are connected. Furthermore there are sub-chapters to every headline. These theories will form the theoretical framework of this thesis.
Figure 2: Connections between theory and research questions
Due to the background of this thesis it has been established that supermarket inventory levels are affected by numerous factors. To understand what these factors could be it is important to understand the characteristics of the input and the output of supermarket inventories. Therefor have these theories been selected: Supply Chain, Inventory control and Warehousing. The authors have chosen to further explain these theories based on this thesis delimitations. Some factors discovered in the first research question can also be the solution for research question two.
Based on the answers from the first research question relevant theories were selected during the literature study as a starting point for the second research question. Methods and tools based on the author’s prerequisites consist of theories that possibly could increase the control of the supermarket inventory level. The headlines are: Eight kinds of waste, Just-In-Time and Postponement.
2.2 Supply Chain
The definition of a supply chain is a network of organizations, both upstream and downstream, that produces value in the form of either products or services (Lysons & Farrington, 2012). Upstream relates to companies backwards in the supply chain in other words the suppliers and the suppliers‘ suppliers. Downstream is the other way around, it is from the company towards the customers. The purpose of a supply chain is to cooperate with the companies involved in it to improve the flow of information and material both downstream and upstream (Srinivasan, 2012). If this is done properly it will create a win-win situation and that should be the goal for all participating companies (Lumsden, 2012; Jonsson & Mattsson, 2011).
What factors have an impact on supermarket inventory levels supplying a manufacturing line? 2.2 Supply Chain 2.3 Inventory control 2.4 Warehousing
How can the impact of these factors be
controlled?
2.5 Eight kinds of waste 2.6 Just-In-Time 2.7 Postponement
Theoretical framework
2.2.1 Supply chain vulnerability
The supply chain can be exposed to both internal and external risks. The internal risks are associated with organizations in the supply chain such as Chaos risks and Decision risks. Chaos risks are based on mistrusts between companies in the supply chain. The mistrust may lead to distorted information and in a worst-case scenario it may lead to a Bullwhip Effect, which is described in the next section, upstream in the supply chain. Decision risks are associated with the problem of making every one in the supply chain satisfied regarding new decisions (Lysons & Farrington, 2012).
2.2.2 The Bullwhip Effect
The Bullwhip Effect is a phenomenon caused by fluctuations in demand. Small customer demand changes may lead to large impacts on the companies upstream in the supply chain (Miltenburg, 2005). Because the information is passed up in the supply chain, every company involved creates higher variations in the call-offs to ensure that they won´t suffer from a backlog. The most common reason why the Bullwhip Effect occurs is the lack of communication in the supply chain (Srinivasan, 2012). Factors that may lead to demand distortion is commonly connected with sales promotion or cancellation of orders. If a company suffers from the Bullwhip Effect it may lead to poor customer services, cash flow problems and stockouts (Lysons & Farrington, 2012).
2.2.3 Lead times
A common definition of lead time is the time scope from order to delivery. The lead time consists of many different activites that have an impact on the time factor such as planing, construction, transports, manufacturing and distribution. If there is a single setback or unplanned event in any of these factors the lead time will change, often in the form of a delay. The important part for the customer is the total lead time because it will ease the planing process. If the total lead time changes the planning process for the customer will be more difficult to controll (Lumsden, 2012). According to Ruiz-Torres and Mahmoodi (2010) a longer lead time affects the safety stock dimensioning with increased safety stocks as a result.
2.3 Inventory control
According to Lumsden (2012), companies desire to control the inventory build-up with their customer demands as a starting point. When the company only produces after what the customer demands it is possible to keep the inventory levels at a minimum. However
Make-to-order2 is not possible for all manufacturing companies because of various cost
aspects. The inventory control is linked to the customers’ demands, companies can offer better customer service if they keep higher levels of inventories, which is called delivery service level (Jonsson & Mattsson, 2011). According to Heizer and Render (2010) there are two basic inventory issues to consider:
How much to order?
When to order?
These questions concern the quantity and time dimensions. Choosing what to order solves the quantity dimension and determining when to order solves the time dimension (Heizer & Render, 2010). Order point system is a method that can be used to solve the time dimension issue.
2.3.1 Order point system
Order point system is an inventory control method that has a predetermined re-order point (ROP). The ROP is set at an inventory level that should be able to cover for the demand during the lead time (D*LT) and also cover for unexpected deviations (SS) (Jonsson & Mattsson, 2011). The order point is calculated by:
( ) D=demand
LT=lead time SS=safety stock
The safety stock levels in order point systems can be kept low because the lead time between ROP’s are the only uncertainty to be considered. Order point systems can also be advantageous for the supplier because the order quantity is always the same. The disadvantage is that the time between call-offs can differ, which leads to more stock keeping units (SKU’s) for the supplier (Lumsden, 2012).
2.3.2 Lot sizing
The optimal order quantity is the same as the one that occurred at a specific moment in the consuming unit. Usually it is not possible to deliver the precise quantity as the one that occurred at a specific time due to economical and non-economical factors (Jonsson & Mattsson, 2011). The reason for this originates from buyer-supplier agreements, package sizes, safety stock dimensioning and minimum order quantities. This phenomenon is called lot sizing and the characteristics are based in the push-method, where material flow is initiated by a decision or planning activity.
2.3.3 Forecasting
Planning for supply and demand means that companies have to make predictions regarding future costumer demand. According to Lysons and Farrington (2012) forecasting is the basis of all planning and decision-making. All forecasts are exposed to uncertainties, which can be related to weather, war or social and economical factors. Forecasts increase in uncertainty the longer the time horizon of the forecast is (Lysons & Farrington, 2012). Srinivasan (2012) argues that the only certain thing about a forecast is that it never comes true.
According to Lysons and farrington (2012) there are two approaches that can be used for forecasts, quantitative and qualitative. The quantitative approach relies on historic demand and is measured during a specified period of time. Making observations at successive times over successive periods is called a time series. In order to use time series for predicting future demands, different aspects need to be taken into consideration, such
Theoretical framework
as trends, seasonal influences, average demand during the time series, where the product is positioned in the product life cycle and random errors from past forecasts.
The qualitative approach relies on feelings, thoughts and personnel assumptions. This method can be useful when new products are being introduced to the market and historical data is missing. The Delphi method is a qualitative approach where a number of experts are told to predict the future demand. An average of the answers is then calculated by using mathematical statistics. When the average lies within an acceptable range the forecast is then determined (Lysons & Farrington, 2012).
2.3.4 Push
Controlling material by decisions or planning activities are the characteristics of pushing material flow. By pushing material means that internal decision-makers have decided so, but it has not been authorized by the consuming part. The material control method is not called push but the application of the method is what defines if the company gets a decisional material flow or not. If a planning division in a company provides material to manufacturing processes with an order point system, it is using a push-based method (Jonsson & Mattsson, 2011).According to Lumsden (2012) the planning method mainly used for a push system is MRP, which often generates large batches.
2.4 Warehousing
According to Lysons and Farrington (2012) some of the reasons for keeping inventory are to reduce the risk of supplier uncertainty, meet unexpected demands and protect against lead time uncertainties. Most products are not being value-added when kept in stock, but all manufacturing companies are at some point in the material flow keeping an inventory of goods (Lumsden, 2012). SKU’s generate inventory carrying costs to the company in the form of joint costs and incremental costs (Jonsson & Mattsson, 2011). The incremental costs are continuously changing in direct proportion to the average quantity and the joint costs are step-by-step changing when the quantity reaches a certain level. That level triggers a decision, which increases or decreases the joint cost. It is necessary to differentiate between incremental costs and joint costs because the incremental costs are the ones taken into consideration when companies make decisions regarding lot sizing and optimization (Jonsson & Mattsson, 2011). Because of these costs most companies aim to keep the inventory level as low as possible (Liker & Meier, 2006; Miltenburg, 2005).
There are mainly two different techniques used when deciding how goods in the warehouse should be stored. These are floating location storage and fixed location storage. The fixed location storage has a specific shelf or location for each goods. In a floating location storage the operator puts the received goods wherever there is free space, which creates a higher inventory usage (Lumsden, 2012).
By lowering the inventory level new problems can be identified. This method is referred to as the Japanese Lake, which aims to lower inventory carrying costs and to discover problems in the manufacturing processes (Lumsden, 2012). When lowering the inventory level different problems can emerge, such as machine breakdowns, scrap loss and unreliable suppliers (Srinivasan, 2011).
2.4.1 Safety stock
Companies are motivated to maintain a safety stock in order to deliver products in an uncertain environment. The uncertainties can be in the inventory level, demand during the lead-time or in the length of the lead-time (Lumsden, 2012). The dimension of the safety stock is mainly determined in one of two aspects, safety time dimensioning or safety quantity dimensioning. According to Jonsson and Mattsson (2011) safety time dimensioning should be used when there are uncertainties linked with the time dimension, hence the safety quantity dimensioning should be used when there are uncertainties linked with quantities.
When the safety stock dimensioning is being determined, it may be useful to use the service level as a determinant for the number of SKU’s in safety stock. According to Jonsson and Mattsson (2011) the formula for calculating the dimension of a safety stock, using the service level, is:
SS = Safety Stock
K = the safety factor determined from desired service level
= The standard deviation during the lead-time (How much the demand varies during the time it takes to replenish the inventory).
2.4.2 Article assortment
The reason why companies have a wide article3 assortment is to create customer
satisfaction. By having a wide article assortment, greater customization is possible which creates a competitive advantage for the company. Even if more articles occupy additional space in the warehouse, companies consider it as an important asset. A wide article assortment leads to higher inventory levels, in both safety stock and cycle stock. Larger warehouses, with wide article assortment, tend to pressure the company’s material control, especially if the company has a floating location storage (Lumdsen, 2012).
2.5 Eight kinds of waste
Lean production is a manufacturing philosophy that has its roots in the Japanese automobile industry (Miltenburg, 2005). The focus is to eliminate waste within the company and to create value for customers. According to Lumsden (2012) the objective with Lean Production is to create fast and flexible material flows with regards to four dimensions. They are: product, process, employees and volumes. Lean Production regards waste as activities that don’t add value to the product, which also exposes the material flow for uncertainty and generates unnecessary costs (Lumsden, 2012).
Liker (2004) has identified eight different kinds of wastes.
Unnecessary transport: Transports of material or goods between inventories or processes are wasteful activities.
3
Theoretical framework
Waiting: Workers that just stand around, having nothing to do or are just waiting for parts4.
Overproduction: To produce more than customer demands leads to both excessive inventory and increased transportation costs.
Excess inventory: Keeping too many goods in stock hides problems and increases the lead time.
Defects: Time spent on producing or repairing goods are regarded as wastes.
Unused employee creativity: In-house knowledge should be treated as an asset and should not be overlooked.
Overprocessing: When the employees do more work on a product than the customer demands.
Unnecessary movement: Workers are not supposed to look for certain tools or goods, nor walk in vain.
Of the eight wastes overproduction is regarded as the worst kind of waste. The reason is that it generates more of the other wastes (Liker, 2004).
2.5.1 ECRS
ECRS is a tool that can be used in order to reduce waste. The tool consists of four dimensions: elimination, combine, redistribution and simplification. Elimination means that unnecessary processes (wastes) have to be identified and then eliminated. If it is impossible to eliminate the processes they should be combined. Redistribution should be used when neither combining nor eliminating is possible. The final solution is to simplify the processes in order to improve it (Tamizharasi & Kathiresan, 2014). One other tool whose objective is to reduce waste is 5S.
2.5.2 5S
This tool is used to eliminate waste and at the same time maximize output with a minimum level of input (Heizer & Render, 2011). To achieve this there are five dimensions for every workplace to implement, they are:
Simplify/straighten: Reduce wasted motion and improve work flow. Short-run and long-run ergonomic issues have to be considered, displaying and labelling for easy use at each work area.
Sort/segregate: Improve work flow and increase space by identifying and removing all non-value items at work areas.
4
Standardize: Standard operating procedures and checklists for every workstation creates good standards, which makes the abnormal obvious and removes process variations. Cost and employee training time are reduced when using standardized tooling and equipment.
Shine/sweep: Maintain a clean and contamination-free area through daily cleaning.
Sustain/self-discipline: Communicate and sustain progress by using visuals. Periodical reviews to recognize efforts and to motivate progress are essential. Manufacturing companies’ that utilize 5S involve all of their employees in the search of identifying waste and make continuous improvements. By maintaining an orderly workplace assets are used for more productive purposes (Heizer & Render, 2011).
2.6 Just-In-Time
According to Miltenburg (2005) Just-In-Time (JIT) is a manufacturing philosophy with the objective to produce products and to make continuous improvements. By making improvements the company can reduce costs and increase the quality of products and deliveries. The idea is to identify waste within the production system and eliminate them with the use of problem solving within the production system. One technique to identify waste is for managers to lower the inventory levels where they want to make improvements. When production stoppages occur, personnel have to identify which wastes caused the abruption. Inventory levels are then set back to the original level until the problem has been solved. The inventory level will then stay at the lower level and the procedure starts over in a new area that needs improvement.
Lysons and Farrington (2012) differentiate between BIG-JIT and JIT, where Little-JIT focuses on inventories, scheduling goods and providing resources when and where demanded. Little-JIT has the following objectives:
Zero inventories: Inventory levels should be kept at a minimum within the
company.
Zero handling: All non-value adding activities should be eliminated.
Zero defects: Quality expectations from customers should be more than met.
Zero lead time: By using small batches the flexibility will increase and the lead
times will decrease.
Zero set-up time: If the production system is independent of set-up times
advantages like shorter production time, shorter production cycle and smaller inventories can be obtained.
Lot size of one: If companies maintain a one-piece flow the production system is
more flexible against fluctuations in customer demands, neither supplier nor manufacturer needs to carry excessive inventory levels.
Theoretical framework
The difference between traditional material control and JIT is that smaller batches are ordered, deliveries are more frequent, simplified ordering routines are used and adapted packaging for production is sent from the suppliers (Lumsden, 2012).
2.6.1 Pull
The consuming unit in the material flow decides material transportations in a pull-based system. This means that a signal goes from the consuming unit to the storage that supplies are needed and then the storage answers by delivering the amount of material requested. The materials ordered and needed in a pull-based system are supposed to be as close to the immediately required material and ordered by the consuming unit (Jonsson & Mattsson, 2011).
According to Srinivasan (2012) a pull system can lead to advantages in product quality, reduced production costs through lower levels of WIP, shorter lead times and lower inventory levels. Lysons and Farrington (2012) argue that the interface between the push- and pull based stages in a supply chain are known as the push-pull boundary. After the point where pull is used in the supply chain timeline the bullwhip effect is avoided. The reason is that costumer demand is known in the pull strategy and forecasts are not needed.
2.7 Postponement
Postponement is a technique used to provide a wide range of variety but still maintain low inventory, transportation and processing cost (Lysons & Farrington, 2012). According to Srinivasan (2012) postponement is the situation when the production or assembly starts after an order has been confirmed. Standardize products are used to maintain a neutral state as long as possible and only customize the products in the last steps of the manufacturing processes (Lysons & Farrington, 2012; Lumsden 2012).
To be able to have a postponement strategy some characteristics are crucial. The company needs to have good inventory control in order to keep track of where all the products are and by that keep track of all the value adding processes. There are some requirements that are crucial to fulfil an efficient postponement strategy, such as: the articles should be expensive and have a high and varying demand (Lumsden, 2012). When all these requirements are achieved the company will benefit from the postponement strategy. The company will get a wider selection of products and the inventory level will be reduced (Lumsden, 2012). Because the products are manufactured after a customer places an order it will reduce the risk of overproduction, which makes it efficient concerning unpredictable customers and markets (Jonsson & Mattsson, 2011).
2.7.1 Customer order decoupling point
There are a couple of different ways to handle the material flow. One important reason is if the manufacturing is based on forecast or customer order. There is a difference in the level of customer order, some are from construction and material purchase and some only regards the final assembly of parts. Customer order decoupling point (CODP) is the point between forecast and customer order and after this point the product is bound to a certain customer (Lumsden, 2012; Jonsson & Mattsson, 2011).
3 Method and implementation
This chapter explains the different methods and techniques used to gather and analyze the data for this thesis. This chapter is divided in different sub-chapters: Work process, Case study, Data gathering, Analysis of data and the last part Reliability and validity.
3.1 Connection between research questions and
method
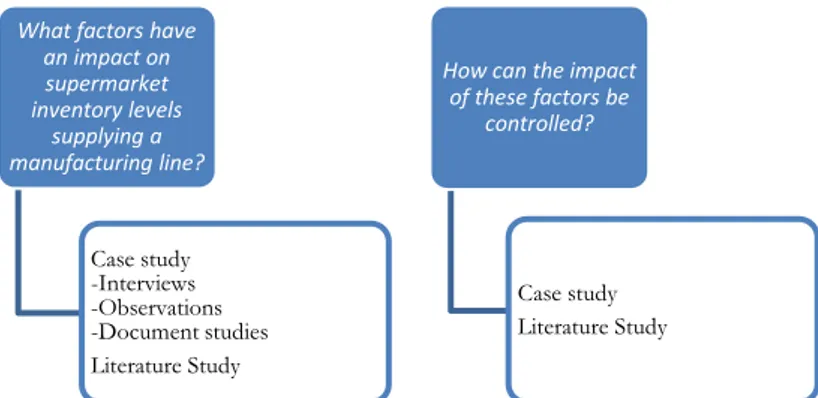
To answer the research questions a literature study and a case study have been conducted. These studies were necessary in order to investigate the units of analysis due to the delimitations of this thesis. The empirical findings from the case study and theories from the literature study were used to find the answer to the first research question. The identified factors in the first research question were then analysed with the theoretical framework in order to answer the second research question. Figure 3 presents what kinds of method used for each of the following research questions.
Figure 3: Connection between research questions and method
Data necessary to answer the first research question consisted of interviews, document studies, observations and a literature study. The reason was to collect data regarding the supermarket system and the case company’s procurement system. These methods are connected to the research approach chosen by the authors. The second research question has a different approach which originates from the literature study and the result of the case study. Both methods and approaches are described in detail later in this chapter.
What factors have an impact on supermarket inventory levels supplying a manufacturing line? Case study -Interviews -Observations -Document studies Literature Study
How can the impact of these factors be
controlled?
Case study Literature Study
Method and implementation
3.2 Work process
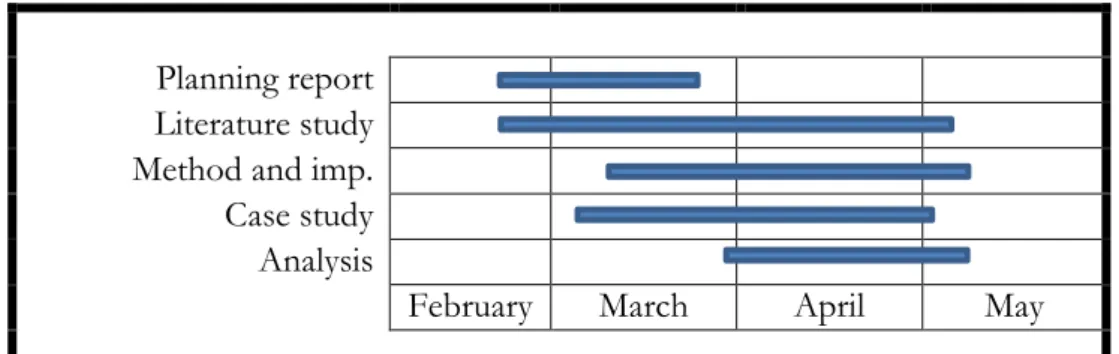
This study is divided into five major phases. First is the planning report, where an introduction meeting with the case company and information retrieval were conducted. After the planning report was initiated the case study began. Literature study and method and implementation phases were conducted simultaneously. After that, the data was collected and sorted and the analysis phase could start. The time scope of the work process is shown in Figure 4.
Figure 4: Time scope
During the start of the case study it was necessary to create an idea of an interesting subject to investigate. The case company was contacted for an introductory meeting and a tour of the company´s factory. By these activities the authors were able to create a problem description followed by relevant research questions that needed to be determined to fulfill the planning report.
After the purpose with following research questions were stated, the authors decided what kind of methods should be used to collect and analyze the data. The next step was to create and gather an outline of the theoretical framework. All these sections, background, problem description, purpose and research questions, method, theoretical framework and a time line were used to compile the planning report. After an approved planning report, the authors started the analysis phase. The quantitative data were analyzed and sorted in Excel. The next steps were to compare the data with the theoretical framework and later analyze it in order to answer to first research question. The discovered factors from the first research question were the basis of the second research question. The original theoretical framework related to the second research question was based on the authors predetermined knowledge about the subject. Based on the new findings the theoretical framework was updated to be further, connected to the second research question.
When the second research question was answered the discussion and conclusion chapter was conducted. The authors own reflections and thoughts regarding chosen methods and the result were then discussed. When the thesis was approved a presentation were conducted.
Planning report Literature study Method and imp. Case study Analysis
3.3 Research approach
To answer the first research question it was necessary to identify factors that had an impact on the supermarket inventory level. When more empirical facts were discovered the collected data was updated and analyzed against the theoretical framework, this is called an abductive approach (Olsson & Sörensen, 2011; Patel & Davidson, 2011). The second research question has a deductive approach because its starting point is in theories discovered in the first question about the reality (Olsson & Sörensen, 2011). When the factors that answered the first research question were discovered, methods and tools that could control the impact of the factors were determined. The authors also had some preconceptions about the answer to the research questions because the field of study is well known and rather than wait for a concept to emerge it was more time efficient to start with basic concepts (Yin, 2009).
To get a deeper grasp both qualitative and quantitative methods were used. This was in order to get a wide collection of data both from employees and the company´s database. This was done because it gave the authors knowledge about what the employee’s thoughts about possible factors that had an impact on the supermarket inventory level and then compare it with the outcome of the document studies (Holme & Solvang, 1997). A combination of qualitative and quantitative, thus mixed method, is used when the research questions are complex and need a combination of both to be able to find a solution to the problem (Lund, 2012).
3.4 Case study
In order to answer the research questions and to fulfil the purpose of this thesis a case study was conducted. A case study is a research that studies a phenomenon in a real-world context (Platt, 1992; Yin, 2009; Yin, 2011). The selection of case company was a relevant choice because it stands before an increase of production volume and has identified problems within the supermarket inventory levels, which supplies a manufacturing line. To understand and identify the problems, observations on the company´s material flow and procurement system were conducted. This was done in order to do an embedded single analysis. The case company is a multinational manufacturing company in the truck industry. This case study was conducted at the case company’s assembly line factory located in Bangkok, Thailand. There are approximately 190 employees working in the factory. The factory has several production lines that are part of the final assembly of trucks.
In cooperation with the case company it was decided that the authors should pick the sample of goods by themselves, but with some conditions. The reason was to find goods that could cover a broad selection of the case company’s assortment, which means goods from different regions, price, size and features. The selection of parts was made at the supermarket to ensure that the chosen parts were used on a daily basis in the manufacturing line. The sample was discussed in cooperation with the case company, where a suitable mix of parts to be analysed was determined.
3.5 Data collection
Different techniques have been used in order to collect necessary data including documentation studies, interviews, observations and basic training in the case company’s procurement system (GILM). Methods presented below were used to gather relevant data and to answer both research questions.
Method and implementation
3.5.1 Literature review
Studies in relevant literature were performed to create a theoretical framework and also to find possible techniques that could help the authors to answer both research questions. Underlying theory that introduces the reader to basic logistic subjects is presented under the Theoretical Framework. The studied literature consisted of printed books and scientific articles linked to the field of study. Google Scholar and the homepage of Jönköpings Library were used as search engines. The articles were then available through these databases, Science Direct, Tylor & Francis and Emerald. Certain keywords were supermarket system, supply chain, inventory control, material flow, replenishment systems, push and pull. To get the right translations from Swedish to English, Plans logistics lexicon was used.
3.5.2 Interviews
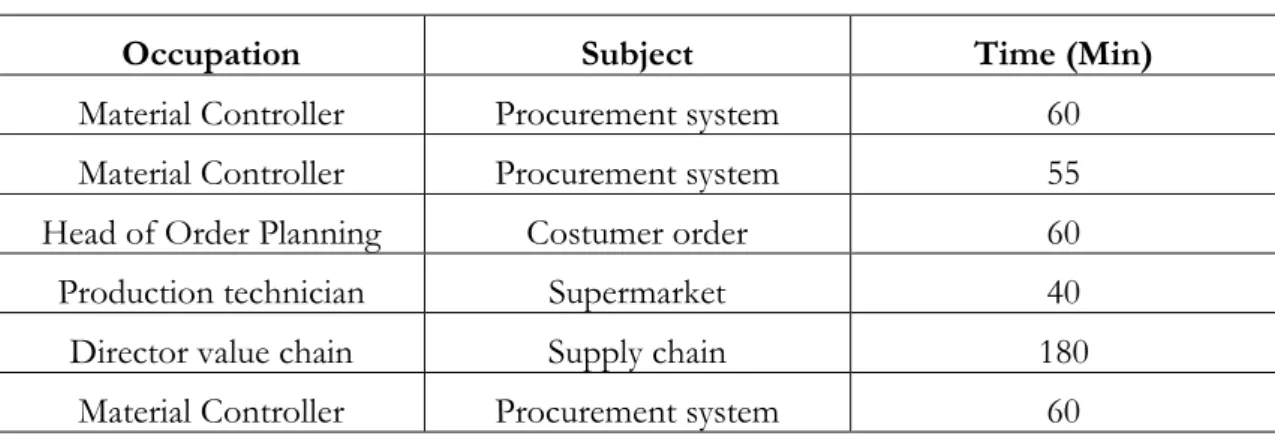
Interviews were held with hand picked employees and those recommended by the authors’ contact person at the case company. This was done to get an overview regarding the function of the procurement system and the internal material handling. The objective with the interviews was to find out what they believe to be the factors that have an impact on the supermarket inventory levels supplying the manufacturing line. In order to start with GILM, two interviews were dedicated just to learn the basics of the program. Those interviews were considered as explorative as the authors had no previous knowledge of the program. The other interviews were of semi-structured character and held during the case study, in March and April. In Table 1 the interviews are listed in chronological order.
Table 1: Interviews.
Occupation Subject Time (Min)
Material Controller Procurement system 60
Material Controller Procurement system 55
Head of Order Planning Costumer order 60
Production technician Supermarket 40
Director value chain optimization
Supply chain 180
Material Controller Procurement system 60
Employees from different departments were relevant to interview because they had knowledge regarding different processes in the supply chain. It was necessary for the authors to understand the inputs and outputs of materials supplying the supermarket. The authors have chosen to use interviews because it provides data that is hard to observe when doing a case study (Yin, 2011).
3.5.3 Observations
To answer the first research question observations in the factory were made. By observing the supermarket system the authors collected primary data. It was necessary for the authors to observe the internal material flow to gain more knowledge about the supermarket system. Through observations of the supermarket system the selection of parts that later was analyzed during the case study were chosen. The observations were held during the case study and are listed chronologically in Table 2.
Table 2: Observations at the factory
Focus What? Time (Minutes)
Material replenishment Factory 150
Selection of parts Supermarket 75
Process of Picking Table 60
Process of Loading Dock 60
Process of Chassis Line 45
According to Yin (2011) observation is a good way to collect data because you get an opinion of your own which has not been interpreted by someone else. Except from the first tour in the factory where the authors were guided, all observations were made by them selves. By observing the internal material flow without guidance, the authors were able to collect primary data on their own without being affected by someone else’s opinions. The chosen processes to observe were determined by the authors where focus was to gain knowledge and increased understanding of the internal material flow.
3.5.4 Document studies
Documents from the case company’s internal material handling system were studied to form the basis of our calculations that lead to this thesis quantitative result. These documents contained information regarding the re-order quantities of the supermarket system. In GILM the authors selected which data considered important, which were in assistance when answering both research questions. From GILM a print of each part characteristics were drawn, shown in the Appendices. These documents were then sorted and analyzed in Microsoft Excel, along with the data from the internal material handling system.
3.6 Data Analysis
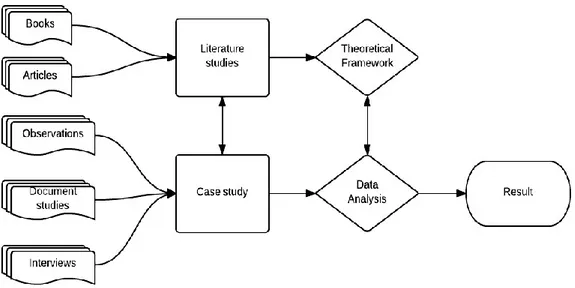
The theoretical framework was retrieved during the literature study and the empirical data from the case study. The data retrieved from the observations and interviews were transcribed and evaluated by the authors and then controlled by the case company. The data from GILM has been consolidated and then sorted and analyzed. In order to come up with the result of this thesis the collected empirical data was compared with the theoretical framework. According to Trochim (1989) pattern matching is a method where an attempt to match a specification of a theoretical pattern with the acquisition of an observed pattern. The pattern matching method can be seen in Figure 3.
Method and implementation
Figure 5: Data Analysis
The pattern that emerged during the literature study was compared with the observed empirical pattern from the case study. According to Yin (1994) the case study can be validated if the result from the case study matches the predicted pattern from the theoretical framework.
3.7 Reliability and validity
To ensure that the result of this thesis was as accurate and close to reality as possible the authors used different methods to collect data. Chosen methods were interviews, observations and document studies. The reason that three methods were used was to ensure that the data collected was as truthful as possible. This method is called triangulation, which according to Yin (2011) will strengthen the validity of a study. Primary data was collected when observing the supermarket system and after the authors had received basic training in the case company’s procurement system they collected data on their own from the database. By collecting data from the procurement system the authors could choose which data they believed to be most relevant for answering both research questions. This method was used in order to increase the validity of this thesis. The collected and analyzed data was controlled by the case company to ensure that the result was based on reliable data. The authors assume that the data found in the procurement system were accurate and up-to-date. There is no reason to believe that data from the online procurement system were misguiding or false.
The focus of the interviews was to gather useful data that could answer the first research question. Because of this the questions were of similar character. The authors hoped to get similar answers from the respondents’ about the factors that had an impact on the inventory levels. To ensure that the data from GILM was accurate; a follow-up interview with the Material Controller was conducted. With similar answers, the reliability of this thesis will increase (Yin, 2011). By conducting observations without guidance, the authors could choose what to observe, hence they were not affected by someone else’s opinions. This method of observing was done to ensure that the relevant processes had been investigated.
4 Empirical data
In this chapter collected empirical data are presented. A description of the case company introduces this chapter followed by a thorough explanation of the internal material flow. In the final section the case company’s procurement system is described.
4.1 Case company description
Thai Swedish Assembly (TSA) is a part of the Volvo Group Trucks Operations (GTO), located in the Asian Pacific (APAC) region. The APAC region includes production sites in Japan, Thailand, India and Australia. The different GTO sites in Asia have different focus areas. In Japan and India the focus is mainly on product development, in Thailand the focus is the final assembly of Volvo trucks for both domestic and export markets. TSA is located in Bangkok, Thailand, where they have a chassis line inside a factory, only the final step of assembly is owned by TSA.
The lead time for customers is about 18 weeks, from the time a truck is ordered until it is delivered. One truck consists of more than 2000 parts and has a planning and receiving time of 12 weeks for materials. All trucks that are manufactured at the factory are unique and have unique production numbers that follows the trucks throughout the production. TSA’s main suppliers are located in Europe and Asia. Goods from Europe are shipped by boat or flight, and goods from Asia arrive by boat and truck or only by truck. Delivery times from domestic and international deliveries has huge time differences, domestic deliveries arrives from one day after ordering and international deliveries can take up to 12 weeks before arrival at TSA’s loading dock.
4.2 Internal material flow
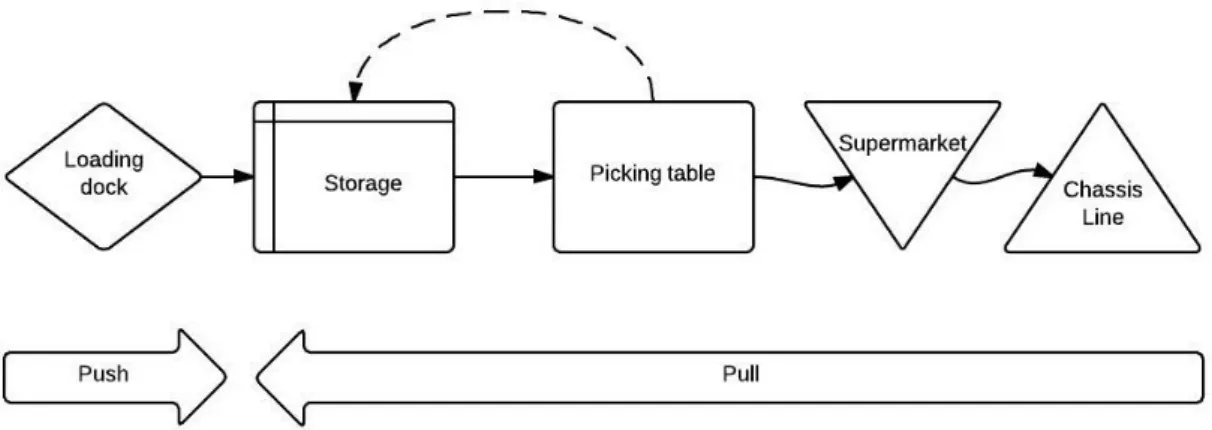
This is a description of TSA’s material flow that has been investigated during the case study, from incoming goods to supermarket. From supplier to storage a pushing material flow is used and from the storage to line side a pull material flow is used. The internal material flow is shown in Figure 6.
Figure 6: Internal material flow
Loading dock, inspection. All incoming goods are delivered to the loading dock. The
goods are transported to an area for a short time where they are inspected and sorted. The inspection is done in order to control that the pallets have got the right quantity and
Empirical data
the parts are in good condition. When the pallets have been controlled they are scanned and registered in the internal inventory handling system.
Storage. After the goods have been scanned they are transported to the storage. The
design of the warehouse is a floating location storage so the pallets are stored wherever there is empty space. Each pallet is scanned and confirmed that it has been delivered to the storage along with its whereabouts.
Picking table. The picking table is a sorting station where all the goods are divided
based on its feature. The parts are sorted into boxes with the predetermined quantity to fit the shelves at the line side. When the goods have been sorted and scanned they are sent to refill the supermarket, if the supermarket is full the goods will be sent up to the storage, which is represented by the dotted arrow in Figure 6.
Supermarket. The supermarket is a storage area that provides parts to the chassis line.
When the inventory level at the chassis line is below a predetermined order point it generates an order to the supermarket, asking for refill. When the supermarket is below a predetermined order point a signal is sent to the storage that parts have to be repacked at the picking table.
Chassis line. This line is the final assembly station. A line storage system provides the
line with parts. After the truck has passed the final assembly line it is time for inspection. When the truck passes inspection it is then sent to the customer.
4.3 GILM
The web-based material control system used by TSA is called Global Inbound Logistics Management (GILM) and is used to do call-offs to suppliers and for the company to have control over their inventory levels. The system runs Material Requirements Planning (MRP) calculations based on three basic data inputs: production program, Bill Of Material (BOM) and stock balances. The production demand is planned over time by the MRP calculations in accordance with the BOM. Other parameters are also taken into account by the system, such as total safety lead time, safety stock, available stock balances, already planned call-offs etc. The result of GILM’s MRP calculations leads to a schedule of firmed and planned call-offs to suppliers. The call-offs are consistent with the production program for the correct part with the preferred quantity on the preferred time in the warehouse. A more detailed description of GILM is shown in appendix 1. The total safety lead time is additional data that impacts the call-offs for each part. The purpose of total safety lead time is to buffer materials against uncertainties, such as suppliers, deliveries and transportations. There are four dimensions that are the constituents of total safety lead time, which are on the factory, country, goods receiving and pick-up point levels. In GILM the total safety lead time is specified in hours, which is divided by 8 (the number of hours in one work day) to calculate the total days of buffered material that is specific for each call-off and part. For example if the factory safety lead time is set to 5 hours, goods receiving time at 3 hours, the pick-up point safety lead time is set to 12 hours and country safety lead time is at 2 hours, after the division it is rounded up to a full number of days. The sum of total safety lead time is calculated by:
( )
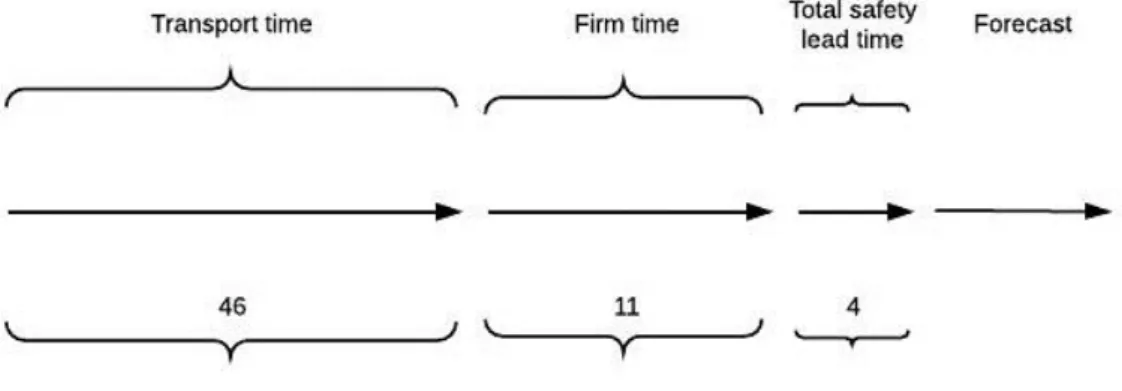
The firm time and transport time are also important dimensions in GILM. The transport time is expressed in number of days and represents the total lead time from supplier to factory. Firm time marks the number of days that a call-off can’t be changed by TSA. If the firm time to a supplier is set to 11 days the call-off quantity is fixed within those 11 days before dispatch day. In Figure 7 the total lead time for part 1003 is shown.
Figure 7: Total lead time part 1003
The digits in the figure represent the number of days for each parameter. This means that when a MRP run is made by GILM the system calculates the call-off 61 days before the order can arrive at TSA’s loading dock. The level that triggers GILM to make alarms of future shortages is when the total stock balance will be less than the safety stock level. When the alarm has been triggered a call-off has to be made.
The two investigated call-off methods used are Lot for Lot (LFL) and multiple order quantity. LFL is calculated by identifying the demand between possible replenishments and taken the inner packaging into consideration. Multiple order quantity is similar to the LFL but instead of adjusting the call-off quantity to the packaging quantity it has a predetermined quantity, which has to be taken into consideration
Empirical analysis
5 Empirical analysis
The empirical analysis is presented in different dimensions regarding the three chosen parts. This is followed by the result of both research questions. The result is based on empirical data and the Theoretical Framework.
5.1 Research dimensions
In this chapter, collected empirical data is presented in the form of tables, which shows the characteristics of three chosen parts. The data was collected from GILM and examined by the authors. The three parts investigated are stored in the supermarket system, their characteristics have been divided into five dimensions; time, safety stock, order, demand and internal.
5.1.1 Time dimension
The following information has been retrieved from GILM. The parameters are predetermined mainly dependent on the total safety lead time. However the lead time have differences connected to the distance between the supplier and TSA. This is shown in Table 3.
Table 3: Time dimension Part
number Region Firm time (days) Total safety lead time (h) Transport time (days)
1001 Thailand 4 32 1
1002 India 11 32 22
1003 Belgium 11 32 46
The suppliers located far away from TSA have longer transport and firm times compared to the domestic suppliers. On the other hand the total safety lead time is the same for all parts because it is not based on specific supplier characteristics.
5.1.2 Safety stock dimension
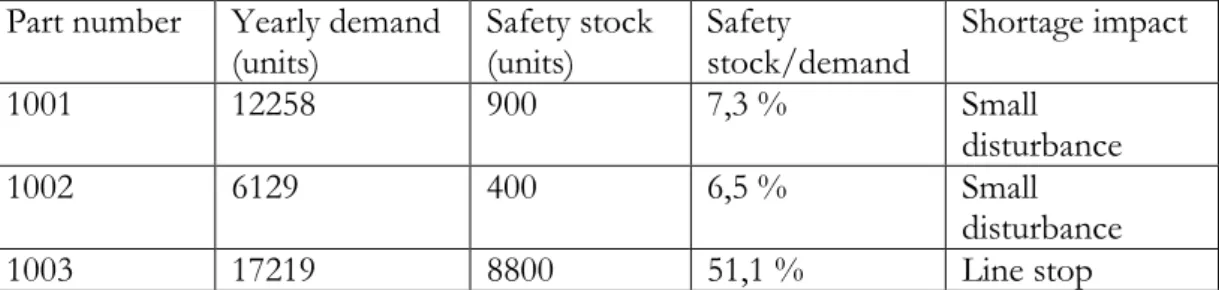
In Table 4 the level of safety stock is presented. In order to display the relation between yearly demand and the safety stock level a ratio has been calculated. Dividing the safety stock with the yearly demand did this. The line impacts of shortage of the parts are also displayed.
Table 4: Safety dimension
Part number Yearly demand
(units) Safety stock (units) Safety stock/demand Shortage impact
1001 12258 900 7,3 % Small
disturbance
1002 6129 400 6,5 % Small
disturbance
1003 17219 8800 51,1 % Line stop
There are differences between the ratio of the part from Belgium and part 1001 and 1002. One of the reasons is that a part with line stop impact in case of shortage has higher levels of safety parameters.
5.1.3 Order dimension
The quantities of parts ordered are based on the call-off method. The methods examined are LFL and Multiple quantity. This is shown in Table 5.
Table 5: Order dimension
Part number Region Inner packaging (units) Call off Method
1001 Thailand 450 Lot-for-Lot
1002 India 400 Lot-for-Lot
1003 Belgium 800 Multiple Quantity
Minimum order quantity is 450, 400 and 800 pieces for the different parts. The inner packaging has been determined between TSA and the supplier. If the order quantity is higher than inner packaging, twice the quantity has to be ordered.
5.1.4 Demand dimension
Table 6 is based on the yearly demand and the present (2014-04-09) total stock balance. The daily usage is calculated by dividing the yearly demand for each part with the number of working days for one year (242 days).
Table 6: Demand dimension
Part number Yearly demand
(units) Total stock balance (units) Daily usage (units) Safety stock (units)
1001 12258 1413 50,65 900
1002 6129 626 25,33 400
1003 17219 7346 71,15 8800
For part 1003 the total stock balance is below the safety stock level, which means that a signal in the system has been sent that a new call-off has to be done. The daily usage differs from 25 to 71 parts per day.
5.1.5 Internal dimension
Internal dimension refers to the activities that occur inside the factory. In Table 7 the re-order points and refill quantities of the supermarket system is shown for part 1001, 1002 and 1003. The days between refilling the supermarket were calculated by dividing the refill quantity with the daily usage (from Table 6).
Table 7: Internal dimension Part number Yearly demand
(units) Re-order point (units) Refill quantity (units) Days between refill
1001 12258 8000 8000 158
1002 6129 40 40 1,6