Uncertainty in Mass-Balance Calculations of Non-Point Source
Loads to the Arkansas River
Jennifer Mueller
Graduate Research Assistant and MS Candidate, Civil Engineering Department, Colorado State University, Fort Collins, CO
Timothy K. Gates
Professor, Civil Engineering Department, Colorado State University, Fort Collins, CO
Abstract. Field data on flow and solute concentrations are used in mass balance
cal-culations to estimate the non-point source loads of salt to an upstream reach and to a downstream reach along the lower Arkansas River in southeastern Colorado. A simi-lar analysis is conducted to estimate selenium (Se) loads to the downstream reach. The unknown variable calculated to bring closure to the mass balance along each river reach for each sample period is the total unmeasured non-point load in surface water and groundwater that enters along ungauged tributaries and along the main stem of the river. Several sources of uncertainty in the mass balance calculations are considered: instrument error in the data sonde of field electrical conductivity (EC) measurements at multiple locations during a sample period and in laboratory analysis of water sam-ples, uncertainty in assuming that the instantaneous EC measurements at locations represent corresponding EC averaged over the entire sample period and over the cross section, ambiguity in using fitted regression equations to relate EC values to concen-trations of total dissolved solids (TDS) and dissolved Se, and error in streamflow measurements at gauging stations. These analyses render models of the input vari-ables to the mass balance equations for each reach as random varivari-ables with specified probability distributions. Monte Carlo simulation is used to solve the resulting sto-chastic mass balance equations to predict distributions of possible values of the non-point source loads for TDS and Se. Results indicate substantial uncertainty in the pre-dicted loads. Annual average coefficients of variation (CV) in prepre-dicted TDS loads along the upstream river reach range between 0.37 and 0.91, and annual averages of 90% prediction intervals range from 2,404 to 22,562 (kg/day)/km. Annual average CV in predicted TDS load values for the downstream reach range between 0.09 and 0.20, and annual averages of 90% prediction intervals range from 2,615 to 8,312 (kg/day)/km. For the Se mass balance along the downstream reach, the average CV over nine sample periods within a three-year period is 0.07, and the 90% prediction intervals of Se loads range from 0.008 to 0.016 (kg/day)/km.
1. Introduction
Irrigation of agricultural lands results in high salinity and high concentra-tions of other dissolved constituents in irrigation return flows. Irrigation return flows have higher solute concentrations than the original irrigation water di-verted and applied to fields in part because the applied irrigation water is con-centrated due to evapotranspiration by crops. In addition, the water in irriga-tion return flows can dissolve salts and metals that naturally occur in soils and geologic materials as the water moves over the land surface and through the underlying aquifer. This further increases the salt and metal loads of irrigation return flows as they make their way back to streams and rivers (El-Ashry et al. 1985).
One region that has been greatly impacted by salinization from irrigated agriculture is the Lower Arkansas River Valley in southeastern Colorado (Burkhalter and Gates 2005). Selenium (Se) also has been identified as a non-point source load of concern, since all segments of the Lower Arkansas River have been designated as impaired by Se concentrations that exceed standards for aquatic habitat (Donnelly and Gates 2005). To estimate the magnitude of non-point source loads throughout the river basin, mass balances of salinity (or total dissolved solids, TDS) were developed for two reaches along the river, re-ferred to as an upstream reach and a downstream reach. A mass balance of dissolved Se also was developed for the downstream reach. The upstream study reach of the Arkansas River extended a distance of about 87 km from just west of Manzanola, CO, to Las Animas, CO. The downstream study reach extended for about 52 km from Lamar, CO, to near the Colorado-Kansas state line. Field data on flow and solute concentrations were used in mass balance calculations to estimate the non-point source loads of TDS for both reaches and of Se for the downstream reach. Uncertainty analyses of the load calcula-tions were performed by identifying several elements of uncertainty in the in-put data. These uncertainties were incorporated into the mass balance models as stochastic input variables in order to generate ranges of possible values for the non-point source loads for TDS and Se.
2. Methods
2.1. Non-point Source Load Calculations
In-situ electrical conductivity (EC) measurements standardized at 25oC were taken and water-quality samples were collected along the Arkansas River and near the mouth of selected tributaries at 10 locations in the upstream reach from 1999-2005 and at 6 locations in the downstream reach from 2002-2005. The instantaneous EC measurements were collected during 2 to 3 day sample periods at various intervals ranging from weeks to months between periods. Water-quality samples for Se concentrations were collected at the same loca-tions as the EC samples along the downstream reach from 2003-2005. The EC values that were measured in the field at particular sample locations were compared to the TDS concentrations reported by the analytical laboratory from water-quality samples collected at the same times and locations as the corre-sponding EC measurements. All EC measurements, recorded in units of de-ciSiemens per meter (dS/m), were converted to concentrations of TDS in mil-ligrams per liter (mg/L), based upon relationships developed between the field EC measurements and the laboratory TDS concentrations. For the upstream reach, the following relationship was estimated and applied to convert field EC to TDS concentrations: 0 . 128 EC 9 . 685 TDS= + (r2= 0.97) (1)
For the downstream reach, the following relationship was estimated and ap-plied:
(r 10 . 1 EC 7 . 728 TDS= 2= 0.95) (2)
Some of the sample sites were located at or near flow gauging stations, op-erated by the Colorado Division of Water Resources or the United States Geo-logical Survey (USGS), for purposes of calculating stream loads. The in-stantaneous EC measurement was used as an estimate of the average EC value over the sample period. A regression relationship was then used to convert this average EC into average TDS and/or Se concentration. Daily loading rates of TDS and Se were calculated by multiplying the average TDS and Se concen-trations by the average daily flow rate over the sample period at each location.
In developing the mass balance, the control volume was the river reach with boundaries located around the river perimeter and at the upstream and downstream cross sections of each reach. The unknown variable calculated to bring closure to the mass balance along each river reach for each sample period was interpreted as an estimate of unmeasured non-point source load associated with accumulated surface and groundwater flow to or from ungauged tributar-ies and the main stem of the river. The unmeasured non-point source load of a given constituent (either TDS or Se), LUNPS, to a given river reach over a sam-ple period ∆t is L L L L X t S L I k US O j DS N k I R N j O R UNPS ∆ + + − − + ∆ =
∑
∑
= =1 1 (3)wherein ∆S = average change in stored constituent mass (kg) within the portion of the river reach over the time period ∆t (days), = the average outflow load over ∆t through the downstream cross section on the river reach
(kg/day), = the average load over ∆t for the jth measured outflow (typically a diversion to an irrigation canal) from the river reach (kg/day), N
DS R L j O L O = total
number of measured point outflows along the river reach, = the average inflow load over ∆t through the upstream cross section on the river reach (kg/day), = the average load over ∆t for the kth point inflow (typically a tributary or drain) to the river reach (kg/day), N
US R L j I L
I = total number of point
in-flows along the river reach, and X = an average net internal sink (+) or source (-) of constituent mass within the reach (kg/day) (derived from dissolution and precipitation, adsorption/desorption to sediments, volatilization etc.).
In the current analysis,
t S
∆ ∆
and X were considered negligible. When these terms are neglected, the term LUNPS brings closure to the mass balance model, and it is critical to estimate the uncertainty in each of the input variables within Eq. (3) to evaluate the uncertainty of this difference term (Rozan and Benoit 2001). Hence, in its most general interpretation, Eq. (3) constitutes a
stochas-tic mass balance model, wherein each of the variables is treated as random on a range of possible values that are governed by a prescribed probability distribu-tion. The equation may be solved using an appropriate methodology, in this case Monte Carlo simulation, to render estimates of a distribution of possible values for LUNPS. Estimates of total non-point source loads of a given constitu-ent over a sample period, LNPS, can then be estimated as the sum of the calcu-lated random unmeasured loads and the random measured tributary loads:
.When the higher-order moments (standard deviation, skewness, etc.) of the distributions of the random variables in Eq. (3) are as-sumed negligible, the equation is reduced to a deterministic model wherein the values of the input variables are assumed to be known with certainty.
∑
= + = I k N k I UNPS NPS L L L 1 2.2. Uncertainty AnalysesAs defined in Skeffington (2006), performing an uncertainty analysis refers to measuring the variation range in the input variables of a model in order to systematically assess the extent of uncertainty in the output variable. Several sources of uncertainty in the input variables in Eq. (3) were identified and ad-dressed: instrument error in the data sonde that collected field EC measure-ments at multiple locations during a sample period, error in measurement of Se concentrations from laboratory analysis of water samples, temporal and spatial uncertainty in assuming that the instantaneous EC measurements at locations represent corresponding EC averaged over the entire sample period and over the stream cross section, ambiguity in using fitted regression equations to con-vert EC values to concentrations of TDS or Se, and error in stream-flow meas-urements at gauging stations.
Uncertainties associated with instrument error in EC measurements and in stream flow measurements were described using data from the literature. In-strument error was evaluated by assuming the true EC value to be normally distributed with the 5th quantile at -0.5% from the measured value and the 95th quantile at +0.5% from the measured value (YSI Inc. 2001). A similar distri-bution was assumed and used to characterize the error in estimating Se concen-trations from laboratory analysis of water samples. A value of 0.001 dS/m was also added to the measured EC value to correct for an underestimation in the instrument reading. The standard deviation of USGS stream flow measure-ments was estimated to be normally distributed about the measured values with a standard deviation of 2.2 % of the measured flow value (Rantz and others 1982). The uncertainty associated with spatial variability at a stream sample location was estimated from data sets consisting of three EC measurements taken along the cross-section of a sample location. Percent errors were calcu-lated for the differences of the left, center, and right measurements from the average of the three measurements to quantify an order-of-magnitude measure of variability within a stream cross-section. The average EC over the stream cross section at a sample location was estimated to be normally distributed about the single value measured at or near that location with a standard devia-tion of 5% of the measured value.
A statistical analysis including percent errors, residual values, and correc-tion factors was performed to quantify the uncertainty in using instantaneous point measurements of EC as estimates of EC averaged over the sample period. Data on EC measurements were obtained from a USGS gauging station within each river reach, where EC was measured on half-hour increments. These “continuous” USGS EC measurements were averaged over each sample period and compared with the instantaneous field EC measurements taken at the same locations within each sample event. A residual was then calculated as the dif-ference between the instantaneous measured EC value and the average of the “continuous” EC measurements. The residual was calculated as a positive or negative value to determine whether the measured value overestimated or un-derestimated the average EC value. A correction factor was calculated as one plus the ratio of the residual value to the instantaneous measured value. This correction factor was then multiplied by the instantaneously measured EC val-ues to estimate the average EC value at a given stream location. Using the mean and standard deviation of the correction factors, a distribution was fit to the correction factors from the available USGS data sets within each reach. Correlation between flow rate and EC residuals was calculated at each of the “continuous” gauge sites to explore the possibility that higher flow rates would correspond to higher residual values. The Pearson correlation coefficient was found to be weak for the upstream reach with a value of 0.26 and statistically insignificant with a value less than 0.18 for the downstream reach, so neither was incorporated into the uncertainty analysis of the mass balance calculations.
A similar statistical analysis was performed to quantify the uncertainty in using fitted EC-TDS relationships to estimate TDS concentrations. Percent er-rors, residual values, and correction factors were calculated between the actual TDS concentrations reported from an analytical laboratory and the TDS con-centrations calculated using the relationships in Eqs. (1) and (2). For the up-stream river reach, the correction factors for converting instantaneous meas-ured EC to average EC and for estimating TDS from a regression relationship with EC were found to have a best-fit log-logistic probability distribution. For the downstream reach, a log-logistic distribution was calculated as the best-fit distribution for the correction factor for estimating TDS from EC, and a gamma distribution was the best-fit distribution of correction factors for con-verting instantaneous measured EC to average EC. The estimated EC values, associated TDS concentrations, and stream flow measurements were thereby treated as random variables, with possible values generated from the appropri-ate probability distributions described. This accounted for the various levels of uncertainty in the respective inflow and outflow load calculations to be incor-porated as stochastic variables in the mass balance model of Eq. (3).
For the Se mass balance along the downstream river reach, a regression equa-tion was fit between measured EC (dS/m) and dissolved Se concentraequa-tions, CSe, in micrograms per liter (µg/L) at three sample locations along the river that were located near the USGS gauging station at which “continuous” EC measurements were made:
(r 23 . 1 EC 3 . 2 = Se C 2= 0.77) (4)
Logistic and extreme-value distributions were fit to the computed correc-tion factors for estimating Se concentracorrec-tion from Eq. (4) and for converting the concentration of a grab Se sample to the average Se concentration over the sample period, respectively. These analyses rendered models of the inflow and outflow loads of Se in Eq. (3) as random variables with specified probabil-ity distributions.
Monte Carlo simulation was used to solve the resulting stochastic mass balance equations to predict distributions of values of the non-point source loads for TDS and Se. The Monte Carlo sampling technique selects pseudo-random values from the probability distribution of each pseudo-random variable, where a sample can be pulled from anywhere throughout the distribution (Pali-sade Corp. 2004; Skeffington et al. 2006). The Monte Carlo simulation was run with 1000 realizations, or collections of possible values of the inflow and outflow loads, for the mass balance model for each sample period for each river reach. This rendered a distribution of 1000 calculated values of LUNPS for each constituent for each river reach over each sample period. Selected statis-tics of these output distributions are reported below.
3. Results and Discussion of Analyses
The unmeasured load values were calculated using both a deterministic model and a stochastic model for each sample period, as discussed in Section 2.1. The number of annual sample periods for a given river reach varied from year to year. For the TDS mass balance model for the upstream reach, there were 7 sample periods in 1999, 14 in 2000, 13 in 2001, 15 in 2002, 12 in 2004, and 9 sample periods in 2005. Due to faulty specific conductance probes used in the upstream reach in 2003, mass balance calculations for 2003 are not available. For the TDS mass balance model for the downstream reach, there were 19 sample periods in 2002, 15 in 2003, 15 in 2004, and 13 in 2005. For the Se mass balance there were a total of 9 sample events analyzed for the pe-riod 2003 to 2005.
3.1. Uncertainty Analysis of TDS Load in Upstream Reach
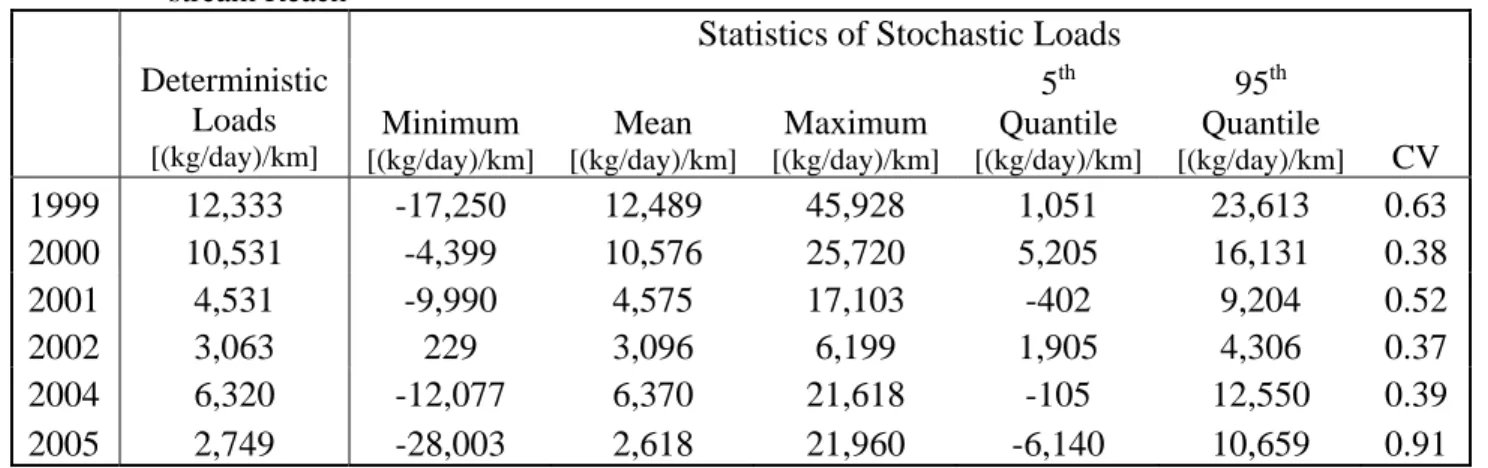
Table 1 includes annual average minimum, mean, and maximum values, as well as values of the 5th and 95th quantiles and the coefficient of variation (CV) for unmeasured loads expressed in kilograms per day per river kilometer [(kg/day)/km]. For sign nomenclature, net unmeasured inflow loads (or sources) are designated as positive, whereas net unmeasured outflow loads (or sinks) are designated as negative. The 90% prediction interval can be calcu-lated as the difference between the 5th and 95th quantile values. It is estimated that there is a 90% probability that the unmeasured load value lies within this interval. The table also shows the load values calculated assuming a determi-nistic model.
As observed in Table 1, the average load calculations from the determinis-tic model are relatively close to the average mean values calculated from the
results of the stochastic model, indicating the relative linearity in the mass bal-ance equation. However, the deterministic model provides no indication of the uncertainty in the predicted loads derived from the uncertainty associated with each of the input data elements used in the mass balance calculations. In 2002, the stochastic model predicted unmeasured loads with an average minimum of 229 to an average maximum of 6,199 (kg/day)/km going into the river reach. For all other years, the predicted unmeasured TDS loads had average minimum values that indicate a net outflow from the river reach. This analysis shows how uncertainty associated with the stochastic input variables can have a sub-stantial effect on the predicted unmeasured load, in that it ranges from a net sink from the system to a net source to the system. In 1999, the 5th and 95th quantile values (limits of the 90% prediction interval) were 1,051 and 23,613 (kg/day)/km entering the river reach, respectively. The highest average of the mean values for unmeasured loads [12,489(kg/day)/km] also occurred in 1999, whereas the smallest average of the mean values for unmeasured loads [2,618 (kg/day)/km] occurred in 2005. The 5th and 95th quantile values for 2005 were -6,140 (leaving the reach) and 10,659 (kg/day)/km (entering the reach), respec-tively. The average CVs within the respective years ranged from 0.37 to 0.91, indicating moderate to large relative variability in the predicted values of the loads.
Table 1. Averages of Calculated Unmeasured TDS Loads to Arkansas River in
Up-stream Reach
Statistics of Stochastic Loads
Deterministic Loads [(kg/day)/km] Minimum [(kg/day)/km] Mean [(kg/day)/km] Maximum [(kg/day)/km] 5th Quantile [(kg/day)/km] 95th Quantile [(kg/day)/km] CV 1999 12,333 -17,250 12,489 45,928 1,051 23,613 0.63 2000 10,531 -4,399 10,576 25,720 5,205 16,131 0.38 2001 4,531 -9,990 4,575 17,103 -402 9,204 0.52 2002 3,063 229 3,096 6,199 1,905 4,306 0.37 2004 6,320 -12,077 6,370 21,618 -105 12,550 0.39 2005 2,749 -28,003 2,618 21,960 -6,140 10,659 0.91
The distribution of predicted unmeasured TDS loads in the upstream reach is further illustrated in Figure 1, which depicts the distributions for each of the 14 sample periods during 2002. Relatively smaller ranges of unmeasured loads were predicted from late July to early September. The smaller ranges are due in part to the extreme dry conditions and low flows in the Arkansas River during this drought period, compared to the rest of the year.
3.2. Uncertainty Analysis of TDS Load in Downstream Reach
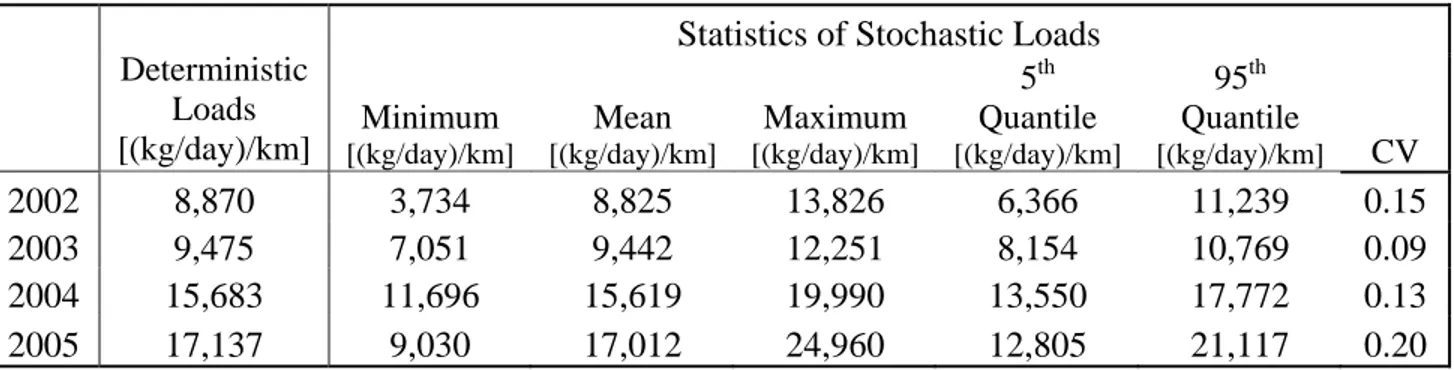
The averages of the statistics of the predicted unmeasured loads along the downstream reach over the sample periods within each year are summarized in Table 2. Also shown are the average annual load values calculated from the
deterministic model. As with the calculations for the upstream reach, the aver-age deterministic loads are similar to the averaver-age mean of the stochastic loads.
Median 5%-95% Min-Max 23-Mar-02 10-May-02 5-Jun-02 26-Jun-02 11-Jul-02 8-Aug-02 6-Sep-02
Sample Period Start Date
-10,000 -5,000 0 5,000 10,000 15,000 20,000 25,000 Unme asur ed Loa ds [( kg/da y )/ k m ]
Figure 1: Box and Whisker Plot of Distribution of Unmeasured TDS Loads to
Arkan-sas River in Upstream Reach for Sample Periods in 2002
Table 2. Averages of Calculated Unmeasured TDS Loads to Arkansas River in
Down-stream Reach
Statistics of Stochastic Loads
Deterministic Loads
[(kg/day)/km] [(kg/day)/km]Minimum
Mean [(kg/day)/km] Maximum [(kg/day)/km] 5th Quantile [(kg/day)/km] 95th Quantile [(kg/day)/km] CV 2002 8,870 3,734 8,825 13,826 6,366 11,239 0.15 2003 9,475 7,051 9,442 12,251 8,154 10,769 0.09 2004 15,683 11,696 15,619 19,990 13,550 17,772 0.13 2005 17,137 9,030 17,012 24,960 12,805 21,117 0.20
Unlike the results for the average ranges of predicted unmeasured TDS load values in the upstream reach; all of the predicted values in the down-stream reach were positive, indicating net inflows to the river. The relative variability in the calculations for the upstream reach was markedly greater than that for the downstream reach, as indicated by average CV values ranging from 0.09 to 0.20. The average 90% prediction interval was largest in 2005, taking a value of 8,312 (kg/day)/km ranging from the 5th quantile value of 12,805 to the 95th quantile value of 21,117 (kg/day)/km. During 2003, the average was smallest, ranging from 8,154 to 10,769 (kg/day)/km. Lower predicted loads in
2002 and 2003, compared to 2004 and 2005, likely correspond to lower diver-sions associated with drought conditions in the Arkansas River basin.
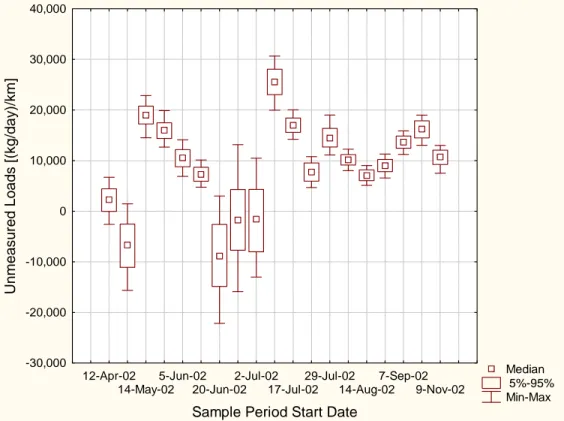
Although the relative variability in the predicted loads was larger for the upstream reach in 2002, 2004, and 2005, the respective average mean values of the predicted loads were markedly larger in the downstream reach. The larger predicted TDS loads in the downstream reach are in part due to higher river concentrations downstream associated with cumulative evapoconcentration and dissolution along the course of the river. Figure 2 shows the distribution of computed unmeasured loads for each sample period during 2002. Figure 2 shows relatively larger ranges of unmeasured loads from late June to mid July. The larger ranges could be due to the higher flows in the Arkansas River dur-ing this time period when compared to the rest of the year.
Median 5%-95% Min-Max 12-Apr-02 14-May-02 5-Jun-02 20-Jun-02 2-Jul-02 17-Jul-02 29-Jul-02 14-Aug-02 7-Sep-02 9-Nov-02
Sample Period Start Date
-30,000 -20,000 -10,000 0 10,000 20,000 30,000 40,000 Unme asur ed Loa ds [( kg/da y )/ k m ]
Figure 2: Box and Whisker Plot of Distribution of Unmeasured TDS Loads to
Arkan-sas River in Downstream Reach for Sample Periods in 2002
3.3. Uncertainty Analysis of Se Load in Downstream Reach
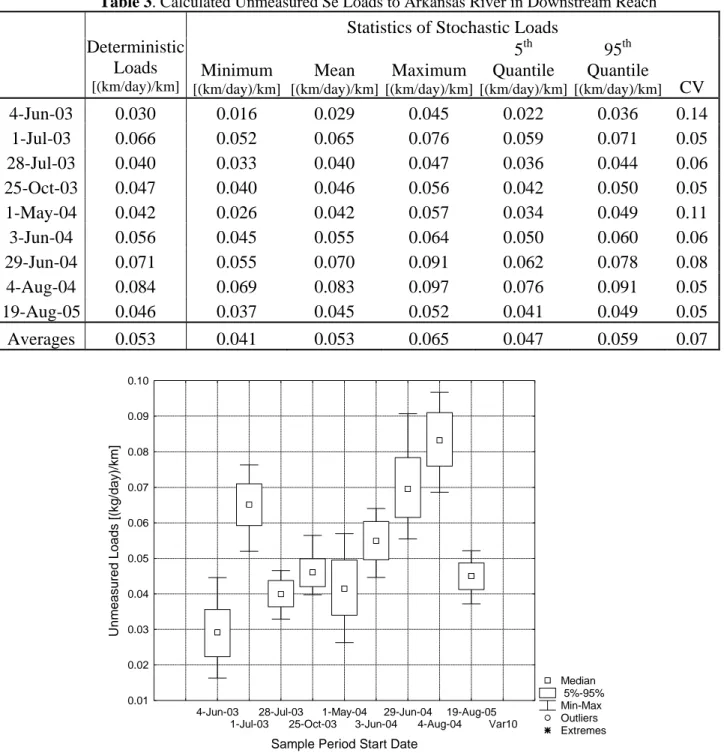
Table 3 summarizes the deterministic loads and the statistics of the pre-dicted stochastic unmeasured Se loads for the 9 sample periods analyzed for the downstream reach. Similar to the TDS calculations, the deterministic loads were close to the mean stochastic loads.
As with the unmeasured TDS load values in the downstream reach, all of the predicted Se loads were positive, signifying net inflows to the river. The magnitudes of the Se loads are far smaller than the TDS loads, due to the cor-respondingly smaller concentrations. The order of magnitude of the relative variability in the predicted loads, as indicated by the CV values, is similar to
that for the TDS loads. CV values are small to moderate, ranging from 0.05 to 0.14. The largest 90% prediction interval occurred for the 29 June 2004 sam-ple period, ranging from the 5th quantile value of 0.062 to the 95th quantile value of 0.078 (km/day)/km. The uncertainty distribution of unmeasured Se loads in the downstream reach is further illustrated in Figure 3. Figure 3 shows the distribution of predicted loads in each sample period from 2003-2005.
Table 3. Calculated Unmeasured Se Loads to Arkansas River in Downstream Reach
Statistics of Stochastic Loads Deterministic Loads [(km/day)/km] Minimum [(km/day)/km] Mean [(km/day)/km] Maximum [(km/day)/km] 5th Quantile [(km/day)/km] 95th Quantile [(km/day)/km] CV 4-Jun-03 0.030 0.016 0.029 0.045 0.022 0.036 0.14 1-Jul-03 0.066 0.052 0.065 0.076 0.059 0.071 0.05 28-Jul-03 0.040 0.033 0.040 0.047 0.036 0.044 0.06 25-Oct-03 0.047 0.040 0.046 0.056 0.042 0.050 0.05 1-May-04 0.042 0.026 0.042 0.057 0.034 0.049 0.11 3-Jun-04 0.056 0.045 0.055 0.064 0.050 0.060 0.06 29-Jun-04 0.071 0.055 0.070 0.091 0.062 0.078 0.08 4-Aug-04 0.084 0.069 0.083 0.097 0.076 0.091 0.05 19-Aug-05 0.046 0.037 0.045 0.052 0.041 0.049 0.05 Averages 0.053 0.041 0.053 0.065 0.047 0.059 0.07 Median 5%-95% Min-Max Outliers Extremes 4-Jun-03 1-Jul-03 28-Jul-03 25-Oct-03 1-May-04 3-Jun-04 29-Jun-04 4-Aug-04 19-Aug-05 Var10 Sample Period Start Date
0.01 0.02 0.03 0.04 0.05 0.06 0.07 0.08 0.09 0.10 U n m easured Loads [( k g /day)/km]
Figure 3: Box and Whisker Plot of Distribution of Unmeasured Se Loads to Arkansas
4. Conclusions and Future Studies
Unmeasured non-point source load to a river was modeled as a stochastic variable in a mass balance that depends upon uncertainty derived from meas-urement error, ambiguity in relationships between variables, spatial variability, and temporal variability. The results of this study suggest that uncertainties in unmeasured non-point loads of TDS and Se along two reaches of the Arkansas River are significant. Annual average CV values for the predicted TDS loads ranged from about 0.09 to 0.91. The magnitude of annual average 90% predic-tion intervals ranged from 27 to 642% the size of the corresponding annual av-erage mean TDS values. Relative variability in predicted Se loads was
smaller. CV values for predicted Se loads ranged from 0.05 to 0.14 over 9 sample periods. The magnitude of the 90% confidence intervals for predicted Se loads were 18 to 48% the size of the corresponding mean values over the sample periods.
Assessing uncertainty in load calculations is important in setting regulatory standards on loading limits to rivers, such as TMDLs. It is also important in making decisions about engineering interventions that are needed to manage loads to comply with regulations and with other performance criteria. The de-gree of confidence or reliability attached to such regulation or intervention is indirectly related to the magnitude of CVs and specified prediction intervals for calculated loads.
Further studies by the authors will include performing sensitivity analyses on the calculations of uncertainty in the unmeasured TDS and Se loads. Such analyses could yield information on the relative influence that the degree of uncertainty, as indicated by estimated measures of variance, in each individual input variable has in calculating the uncertainty in the unmeasured loads. Ad-ditionally, estimates of distribution statistics will be refined and correlation be-tween input variables will be explored to improve the characterization and pre-diction of uncertainty. Finally, uncertainty derived from neglecting storage change and internal sinks and sources in the mass balance calculations also will be considered.
Acknowledgements. This research was supported by the Colorado Water Resources Research Institute, the Colorado Agricultural Experiment Station, and the Colorado Department of Public Health and Environment (Colorado Nonpoint Source Program). A special appreciation is extended to more than 120 farmers and landowners and to those faculty and students at Colorado State University who have assisted in the field data collection efforts in the Arkansas River Valley.
References
Burkhalter, J. P., and T. K. Gates, 2005: Agroecological Impacts from Salinization and Waterlogging in an Irrigated River Valley. Journal of Irrigation and Drain-age Engineering, 131(2), 197-209.
Donnelly, J. P., and T. K. Gates, 2005: Assessing irrigation-induced selenium and iron in the lower Arkansas River Valley, Colorado. Proceedings of the World Water & Environmental Re-sources Congress 2005, ASCE-EWRI, Anchorage, Alaska.
El-Ashry, M. T., J. van Schilfgaarde, and S. Schiffman,1985: Salinity Pollution from Irrigated Agriculture. Journal of Soil and Water Conservation, 40(1), 48-52. Palisade Corporation, 2004: Guide to Using @RISK – Risk Analysis and Simulation
Add-In for Microsoft Excel. Version 4.5, Newfield, New York, USA.
Rantz, S. E. and others, 1982: Measurement and Computation of Streamflow Volume 1: Measurement of Stage and Discharge. Geological Survey Water-Supply Paper 2175. United States Geological Survey.
Rozan, T. F., and G. Benoit, 2001: Mass balance of heavy metals in New Haven Har-bor, Connecticut: Predominance of nonpoint sources. Limnology and Oceanog-raphy, 46(8), 2032-2049.
Skeffington, R. A., 2006: Quantifying Uncertainty in Critical Loads: (A) Literature Review. Water, Air, and Soil Pollution, 169, 25-46.
Skeffington, R. A., P. G. Whitehead, and J. Abbott, 2006: Quantifying Uncertainty in Critical Loads: (B) Acidity Mass Balance Critical Loads on a Sensitive Site. Wa-ter, Air, and Soil Pollution, 169, 3-24.
YSI Incorporated, 2001: Linearity/Accuracy of Conductivity Sensors on YSI 6-Series Sondes. YSI Technical Note.