REPORT OF ACTIVITIES IN THE REED WASH AREA DURING THE SUMMER OF 1974
llave:Diber
Z1
,
1974B7
~:r Weston li'IDR)IOOIST - USBRUl'GlT OF ACTIVITIES IN TH! REED WASH AUA DURING THE SU!fiEil OF 1974
The 12,000 ac:t'e aud Wash - Peck and Beede Wash drainage area
vas chosen a• a study area to aid in defining the salinity problem and to help evaluate the effectiveness of irrigation scheduling aa a salinity control techrique. Several farms in the area are on
the Bureau'• irrigation scheduling program~. and an effort ia being
aade to inc:t'eaae the n . . ber of scheduled farms in the area. Since
there is not sufficient data on quantity and quality of outflows froa thh area prior to scheduling practicu, a control area baa been chosen to help evaluate the effectiveness of the program. The adjacent drainage area of the !aat Branch of Reed Wash containing
5,200 ac:t'el vas selected (see figure 1}.
To accomplish the above taalta, it ia necessary to have a system of observation vella to .aoitor changes in water levels and cheaiatry with tt.e. Surface aeasuring devices are needed to monitor inflows
aad outflova for vater ~d salt budget ltudies. This •~er' a
vorlt vas directed tovarda the goal of instrumentation. A diacueaion
of vorlt that baa been done and aoae of the findings follova. ~ CO!PLETED TO DATE
The a~er'a activities vere directed tovarda the development of a ayatea of observation vella in the study and c~ntrol area. An
atteapt vaa aade to place the vella according to a grid ao that there would be •• little bias in well site selection aa possible. The grid
·
-large number of required vella could net be placed in the time avail-able. The interval vas changed to one mile; a well roughly at each
section corner and one in the center of the section where possible.
It vas not possible to adhere strictly to this plan because of access
difficulties and lack of cooperation with some farmers. In general,
however, the farmer'• were quite agreeable in allowing wells to be
placed on their property.
The wells were drilled using an eight inch truck mounted auger. Kaxtau. depth attainable with this rig i• 25 feet. In moat cases this
limitation was not a serious deterrent. Two t!·ro;a of wells were placed; shallow observation wells in the soil profile and piezometers
in the weathered shale profile.
The shallow obervation vella were constructed of 1\ inch plastic
pipe that bad been perforated with a small hand drill. The hole was backfilled with gravel to the top of the water surface. The remaining
two or t.bree feet was backfilled with soil. A two foot section of two
inch galvanized metal pipe vas placed over the projecting plastic pipe
and concreted in place. A metal cap vas screwed on each pipe to keep
foreign material out of the well.
Piezometers penetrating into the shale were constructed from the same above materials. The difference vas that only the section of pipe
1n the zone contributing ground water vas perforated and gravel packed.
In every case, this vas the bottom section of the pipe. The remainder
of the bole vas backfilled with soil. In some instances, a layer of
bentonite slurry vas placed between the gravel and soU backfill to
wer~ inatall~d about ftv~ f~~t apart; on~ with th~ b~ntonite layer and on~ with juat the aoil backfill. Water lev~l3 were r~ad in ~ach v~ll all a..-er and no aignificant differenc~• in water l~v~l w~r~ obaerv~d.
A total of 58 w~lla were placed in th~ atudy and control ar~a;
17
~ing ahallov oba~ation vella and th~ reaaining41
b~ing pi~o-aetera. Nine vella were placed north of th~ Cover-~nt Highlin~ Canalto d~teraine the nature of any ground water inflow to th~ atudy area. Three of theae wells were placed n~ar 13 Road and the other aix n~r 16 Road. Six other v~lla ver~ placed in th~ vicinity of Big Salt Wash to deterain~ the extent of ground water inflova to th~ valley on a larger acah.
FINDINGS TO DAT!
Although the aaount of data collected ao far in tbia atudy ·i• ainiaal, aignificant findings hav~ b~~n a3d~. Firat of all, it vaa quit~ aurpriaing to fbd ao littl~ ahallov ground water. Figure 2
.
.
givea an id~a of the oceurrenc~ of the ground water in the aoil profile baaed on data coll~ct~d from Sept~b~r 6
-9,1974.
The water aeema to be confined to th~ alluvial fill along th~ major vaahea, and aeema particularly concentrated near the outl~t of th~ area. The nature of the contour linu indicate that Reed Waah and Peclt and Beede Waab are gaining atr~•.Juat aa aurpriaing, the major occurrence of ground water vaa found to be in th~ Kancoa Shale. Thia water, when encountered,
.
•
anyvhae from 0 to 10 feet above the zone where it vas encountered.
Tbe srOUDd vatu occurred about 10 feet into the shale, and tbe
oceurr-enee in tbe shale proved to be the rule rather than the exception. l.eter work done in the vicinity of Little Salt Wash by the Agricultural
~eaeareb Service (ARS) shoved the a..e type of ground water occurrence
in that area. Reports from field workers doing land elaaaifieation
studies in the Uncompahgre Valley this summer indicate that the oceurr
-enee of artesian water in the Heneos Shale h e~on in that area •• vell.
Although i t aey be premature at tbia point to present a IIOdel to expld.n the above phenomenon, vhuel observations end the data
collect-ed to date aeea to indicate that an explanation is in order. In almost every ease where water vee encountered in the shale, the water vee found directly above where the ehale became extremely hard, denee and lapenetrable with our equipa~ent. This ehale vee very dark in color
and very dry. Above the water zone, the shale vas dry and relatively
·
-soft grading to quite bard in some instances. It ee . . e, therefore,
that the water enters the weathered shale profile up-gradient perhaps
through joints and fractures, and percolates down to the unweathered
eurfaee. The water then aovee down-gradient along thie surface and is confined by the tight overlying clay soils and shale thus allowing a preeaure bead to develop. Where conditions of overlying aaterlal are suitable, upward leakage of the water aay occur. This aeehani-could explain apparent seepage probl-e in fields long diltaneea frOID
.
any canal. Figure 3 illuetratee tbie concept.
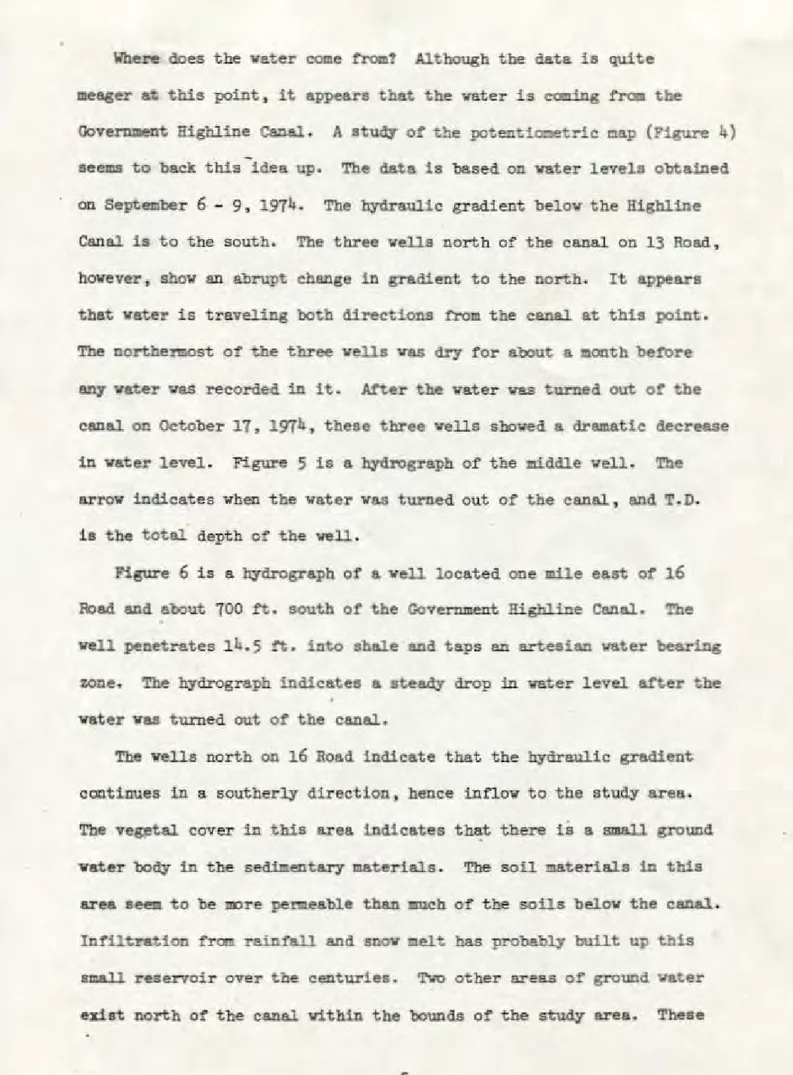
Where does the vater come !rom! Although the data is quite meager
at
this point, it appears that the vater is cccing trom theGovernment Righline Canal. A atud:y or the potentio:etric map (Figure 4) seems to back this idea up. The data is based on vater levels obtained on September
6 -
9, 1974. The hydraulic gradient belov the Highline
Canal is to the south. The three veils north of the canal on 13 Road, hovever, show an abrupt change in gradient to the north. It appears that water is traveling both directions trom the canal at this point. The northen:ost of the three vella vas dry tor about a month betore any water vas recorded in it. Arter the vater vas turned out or the canal on October 17, 1974, these three veils shoved a dramatic decrease in water level. Figure 5 is a hydrograph of the middle veil. The arrow indicates when the water vas turned out of the canal, and T. D.is the total depth of the veil.
Figure 6 is a hydrograph or a well located one mile east or 16 Road and about TOO ft. south or the Government Bighline Canal. The
well penetrates 14.5 ~. into shale and taps an artesian vater bearing zone. The hydrograph indicates a steady drop in vater level after the water vas turned out or the canal.
The wells north on 16 Road indicate that the hydraulic gradient continues in a southerly direction, hence inflov to the study area. The veg,etal cover in this area indicates that there is a small ground water body in the sedimentary materials. The soU materials in this
area seem to be more permeable than J:IUch of the sells below the canal.
Intlltration fran rainfall and snov celt has probably built up this small reservoir over the centuries. T\lo other areas or ground water exist north of the canal within the bounds of the study area. These
areas are outlined in f\lg1.1re
4.
The net infiov of ground vatertram
these ar~as appears to be negligible.
Water samples have been taken fro::1 these veils and sent to the
regional laboratory for chemical analysis. Total dissolved solids,
electrical conductivity and pH vere determined here in the Grand
Junction lab. A map of total dissolved solids concentration is
presented in figure 7. A general trend of increasing dissolved
solids is present towards the outlet of the area. Some of the vorst e:oridences of salinity problems are present in the southern pert of the
area in the fom of surface encrustationpf salts or "alkali". The
diasolved solids data is fran the same time interval as the vater
level data presented earlier.
F1Jl'URE WORK
Sampling and measurement of the vater vells vill continue on a
regular basis. More veils vill be pl.aced north of the canal near the
ones on l.3 and 16 Roads to better define the gradients in these area-s
and to define the source of the artesian vater. More vella vill be
placed in the vicinity of Big Salt Wash to define the ground vater
in-tlov to the valley on a broader scale. Data at present indicates that
ground vater is limited to the proximity of the stream channel.
Surface vater measuring devices vil.l be installed for vater and sal.t
budget studies. A geologic study of the Government Higbline Canal vil.l
be conducted this vinter. A ponding test on the Higbline Canal vill
be conducted in liove>ber, 1974, near Little Salt Wasb by a Joint effort of the ll5B.!l and ARS. An extensive drilling and sampl ing program vil.l be conducted along all lll&jor canals to determine tbe
presence and extent of expansive Cl8¥8• Some of these holeS v11l