QL 737 .U51 M65 - 1992 . \ . .
SUMMARY
PROGRESS:
R~PORT
ON
THE/uPPER EAGLE VALLEY
.
ELKSTUD
~
L'
..
,
-The Effects of Ski Area Expansion on Elk
Accuracy of 2 Telemetry systems in Mountainous Terrain
Summer Data - 1991
Summary Report 1988-1991
Conducted for:
Colorado Division of Wildlife Vail Associar.es
Arrowhead ar. Vail
The Rocky Mounr.ain Elk Foundar.ion U.S. Foresr. Service
By:
James R. Morrison Graduate Research Assistant
./ and ,
A. William Alldredge Professor, Wildlife Biology
Department of Fishery and Wildlife Biology Colorado State University
Fort Collins, Colorado 80523
Spring 1992
COLO DIV WILDLIFE RESEARCH CTR LIB -IIIIIIII IIIII IIIIII II llllll lllll lllll lllll 111111111111111111
SUMMARY PROGRESS REPORT ON THE UPPER EAGLE VALLEY
ELK STUDY
The Effects of Ski Area Expansion on Elk
Accuracy of 2 Telemetry systems in Mountainous Terrain
Summer Data - 1991
Summary Report 1988-1991
Conducted for:
Colorado Division of Wildlife Vail Associates
Arrowhead at Vail
The Rocky Mountain Elk Foundation U. s. Forest Service
By:
James R. Morrison Graduate Research Assistant
and
A. William Alldredge Professor, Wildlife Biology
Department of Fishery and Wildlife Biology Colorado State University
Fort Collins, Colorado 80523
Report Format
The majority of work included in this report was conducted by James Robert Morrison as partial fulfillment of the requirements for a Master of Science degree in the Department of Fishery and
Wildlife Biology. Morrison's thesis is appended to this report in
its entirety. A bibliography relevant to effects of ski area
development on the environment is provided at the end of Morrison's thesis. Recommendations from Morrison's work led to development of an intensive pellet plot survey in Pete's Bowl at Vail, and continuation of observations of elk use of habitats in the Back Bowls at Vail and in the Mud Springs/McCoy Park area at Beaver
Creek. We include a summary of data collected during summer 1991
from that work.
ACKNOWLEDGEMENTS
Initial impetus for this study came from Colorado Division of Wildlife employees Bill Andree and Gene Byrne. Bill de Vergie initiated the involvement of Colorado State University, acquired funding for the first phases of the study and completed a Master of Science degree thesis entitled, "Elk Movements, Dispersal, and Winter Range carrying Capacity in the Upper Eagle River Valley, Colorado" (de Vergie 1989}. de Vergie's work developed the foundation for remainder of our work.
Financial support for this phase of our work was provided by Vail Associates, Arrowhead at Vail, The Rocky Mountain Elk Foundation, and The National Wildlife Federation. The Colorado Division of Wildlife made this project possible by contributing manpower, equipment, vehicles, aircraft and flight time. The
us
Forest Service provided manpower assistance and lodging for personnel during field work.Persons too numerous to name have facilitated our work by volunteering time in all important phases of the project from trapping elk to editing documents. These many and varied contributions are warmly acknowledged.
Drs. Bruce Wunder and Gary White, from Colorado State University, served on Morrison's graduate committee and provided design, analytical, and editorial advice. Colorado Division of Wildlife employees contributing to this phase of our work include Bill Andree, Gene Byrne, Bill de Vergie, Joe Frothingham, Bill Heicher, and Craig Wescoatt. Jan Alldredge and Mathew Alldredge helped collect data during summer 1991.
Throughout our work, the interest, cooperation and support of Mr. Larry Lichliter, of Vail Associates, has been sincerely appreciated. Our best wishes are extended to Larry in his new business venture; the "elk study" will miss him.
J
EXECUTIVE SUMMARYElk in the Upper Eagle River Valley, Colorado, migrate seasonally to and from summer and winter ranges. The timing of migration to summer ranges appears to be correlated with receding winter snows. Movement toward winter ranges is influenced by weather, but also by other factors including mating activities. In the Upper Eagle River Valley, significant amounts of elk winter range has been altered for housing, commercial, and recreational development. Additionally, recreation, timber, and livestock activities occur on habitats used by elk in summer. The purpose of our work has been to elucidate habitat use patterns and responses of elk to these activities and developments and to evaluate potential impacts to resident elk populations. The first phase of this work reported on elk movements, dispersal and winter range carrying capacity (de Vergie 1989). In this report, we discuss work conducted from 1988 through 1991, which was designed to document responses of elk to expansion of ski areas and human activities in summer habitats.
We have used radio-telemetry as a means of ascertaining locations of elk as well documenting elk mortality. Telemetry has numerous advantages; primarily, an animal equipped with a telemetry device can almost always be relocated. A major disadvantage of telemetry, especially when i t is employed in mountainous terrain is, that the accuracy of locations may be inadequate to make specific inferences regarding habitat use patterns. In the early phases of our work, when we had fewer telemetered elk, we could
visually locate each animal after general locations were obtained using telemetry. As sample sizes increased, visual locations of all telemetered elk became infeasible, and we relied more on triangulation and aerial estimates to determine locations of telemetered elk. Reliance on this approach necessitated evaluation of system accuracy.
Triangulation using bearings defined with a hand-held antenna resulted in errors that ranged from 609 to 1,105 meters. When we used an airplane with a belly-mounted antenna system, errors ranged from 409 to 1081 meters. Errors are influenced by the abilities of observers and, more significantly, by signal bounce in mountainous terrain. We concluded that both systems we tested were adequate for making inferences regarding gross changes in geographic use patterns, but these systems were inadequate for ascertaining specific habitat use patterns. Our accuracy was as good or better than the few published studies that have evaluated accuracy. Because of the error associated with telemetry locations we are now using visual locations of elk to evaluate specific habitat use patterns. Telemetry is still a valuable tool for monitoring gross movements and animal survival. The reader is referred to Chapter 1 of Morrison's thesis appended to this report for specific details regarding our assessment of the accuracy of the telemetry systems we employed.
When we utilized only telemetry data to evaluate changes in elk habitat use associated with expansion of ski facilities in the Back Bowls of Vail, we could detect no statistically significant
changes in use patterns. We attribute this result to the failure of our telemetry system to accurately determine specific locations
of elk. Using visual observations of elk in the Back Bowls and
comparing data before and after development, we measured an 11-fold
decrease in the number of elk using China Bowl. This reduction may
be associated with: 1. China Bowl was more developed than other
the other bowls. 2. Development in China Bowl occurred at lower
elevations than development in other bowls. 3. China Bowl was the
only area with a new chair lift.
Elk seemed to avoid China Bowl the first year following development, but use appeared to increase during and after the
second year following development. Elk did not abandon the Back
Bowls, but merely shifted their use patterns, avoiding areas of recent development. The effects of physical disturbance on elk may have been minimized because human activity was excluded from the
Bowls during periods of concentrated elk use. Specifics for this
segment of our work are included in Chapter 2 of the appended thesis. Monitoring of elk use in the Back Bowls is continuing, and we recommend that human activity in this area be minimized or excluded from 15 May to 1 July.
We also used observational data to evaluate changes in use patterns for elk associated with development in McCoy Park and Mud
Springs. Development included physical disturbance from ski runs
built at Arrowhead and Beaver Creek ski areas, and a cabin at McCoy Park, and the human activity associated with these developments. We documented no change in the number of elk observed in McCoy Park
following development, but a 46-fold decrease in elk use at Mud Springs occurred post-development. Further analysis indicated that elk decreased their use of both McCoy Park and Mud Springs drainages during mid to late summer after development occurred. Elk use began to increase following post-development lows during the second and third years after development. Details on this segment of our study are included in Chapter 3 of the appended thesis. We continue to monitor elk use in both the Mud Springs and McCoy Park drainages.
Results of our work indicate that elk respond to physical disturbances and human activities by altering their habitat use
patterns. Avoidance of the disturbances that we evaluated was
greatest during the first year following the activity, but animals appeared to acclimate to disturbances during and after the second
year of disturbance. In areas where ample, undisturbed habitat
exists, elk may respond to disturbance by merely changing habitat use patterns with no measurable impacts to population sizes or performance. Our studies were not designed to measure reductions
in populations, but we recommend that future work evaluate
population performance. Quite likely, elk calf survival would be thQ most sensitive and realistic parameter to measure for this type
of study.
Albeit extremely
valuable,
a
study of
thls
type would
also be significantly more
costly than the work we report herein. At the request of the Colorado Divisi·on of
Wildlife and Vail Associates we developed an • t .
in ensive pellet plot survey in Pete's Bowl at Vail
'
and continued to monitor elk use in the Back Bowls viand at Mud Springs and McCoy Park. Data from Pete's Bowl will provide a less expensive, indirect measure of elk use in this area that can be compared to similar data obtained after projected development occurs. We will use observational data from the Back Bowls and McCoy Park/Mud Springs to evaluate the suggested trends of elk acclimation to disturbance.
We implemented our pellet plot study during summer 1990. A pellet plot study measures the number of animal droppings, in this case concentrating on deer and elk, found on representative plots in a study area. Pete's Bowl was selected because i t is slated for future development. By evaluating plots, pre- and post-development, changes in animal use can be inf erred. We implemented 175, 4 X 15 meter plots, which were all randomly located in Pete's Bowl. This design enables us to detect small changes in pellet distributions with good statistical power. Once plots were established (summer 1990) approximately 140 man-hours are required to collect field data each year.
Plots established during summer 1990 were located and cleared of all animal evidence (fecal pellets, etc.). During summer 1991, we surveyed all plots. We were unable to locate 2 plots; possibly they were lost in an avalanche that appeared to have swept the slope where the plots were supposed to be. Evidence of all wildlife use was recorded on the remaining 172 plots. Because this is the first year of actual data collection, we have no comparisons with prior years data. Because of the large number of plots containing deer and elk pellets, our study will have good
statistical power. on the 172 monitored plots, we found 144 elk
fecal groups and 303 deer fecal groups. Some of our
interpretations are confounded because domestic sheep droppings
I
were found on plots in the upper reaches of Pete's Bowl. Domestic sheep droppings are easily confused with deer droppings. Domestic sheep are not supposed to be using this area and we anticipate that in the future they will not be allowed to graze here.
Also summarized in this report are observational data for elk use of the Back Bowls and McCoy Park/Mud Springs collected during
summer 1991. These data are currently being analyzed by Jim
Morrison for inclusion in a publication with data he collected from 1988 through 1990. Preliminary examination of 1991 data suggests that elk are using both study areas. Elk continue to use the Back Bowls including China Bowl, although few elk were observed there in 1991. Most elk had migrated from the Back Bowls by early July. Elk were observed at both McCoy Park and Mud Springs, although numbers do not approach pre-development levels. Late summer use of these areas continues to be low. We last observed elk in the McCoy Park/Mud Springs areas on 17 July and saw no elk there during 2 visits after that time.
Because of increased overhead rates at Colorado State
University, the continuation of our work (pellet plots and
observations for the Back Bowls and McCoy Park\Mud Springs) will be conducted by A. W. Alldredge and Jan P. Alldredge through RFL Environmental. RFL Environmental is a small, DBE Certified firm owned by Jan Alldredge specializing in environmental consulting.
Report Format . . . ACKNOWLEDGEMENTS EXECUTIVE SUMMARY. Table of Contents i i i i i i
SUMMARY OF ELK STUDIES SUMMER 1991 . . . 1
Elk Observation Data Summer 1991 . . . • . . . . 1 Pete's Bowl Pellet Plot study • . . . • . . • . • . 4 Summer 1992 - Data Collection Approach. . . . • . . . • 6 Conclusions . . . . • • • . . . . • . . . • . . • . 7
APPENDIX 1 8
SUMMARY OF ELK STUDIES SUMMER 1991
During summer 1991, we continued to make observations on elk
in the Back Bowls at Vail and at McCoy Park and Mud Springs. Our
purpose is to continue evaluation of trends in elk use following disturbance from both habitat alterations and human activities. Observational data were obtained by Bill de Vergie and Mathew Alldredge from 22 May through 29 July. Pellet plots were evaluated during 9-11 August, by Gene Byrne, Bill Andree, Bill Heicher, Craig Wescoatt, Bill de Vergie, Jan Alldredge and Bill Alldredge.
Elk Observation Data Summer 1991
Observational data are summarized in Table 1. Although
statistical analysis of these data are pending, elk continue to use both study areas. Elk were observed in the Back Bowls on 10 out of
12 visits from 22 May through 25 June. No elk were observed in the
Back Bowls after 25 June, although some telemetered elk were still
known to be in the general vicinity until 18 July. Elk were
recorded in China Bowl on only 1 occasion when 3 animals were
observed. Elk were, however frequently observed in the bowls
adjacent to China Bowl.
Observers recorded elk in the McCoy Park/Mud Springs areas on 7 out of 13 visits. Group sizes for these observations ranged from 1 to 8 animals, and large numbers of animals were never observed.
No elk were seen in the area on 2 visits made after 17 July.
Because of differences in observers and frequencies of
observations, i t is difficult for us to interpret these
observational data. We are currently evaluating this information
and comparing i t to previously collected data. Results of this work will be presented in a publication authored by Jim Morrison.
Table 1. Elk observation data for the Back Bowls at Vail and McCoy Park/Mud Springs, Summer 1991.
Date Location Elk Present No. Observed
5/22/91 Back Bowls No
Game Creek Yes 50+
Beaver Creek Yes 10-15
Mud Springs No
5/23/91 Mud Springs Yes 3
McCoy Park No
Game Creek Yes 75+
Lower Sunup Yes 1 (radio)
5/28/91 Back Bowls Yes ND
Game Creek Yes 30+
5/31/91 Mud Springs Yes 2
McCoy Park No
Siberia Bowl Yes 7
Lower Teacup Yes 15+
China Bowl No
Game Creek Yes 20
6/4/91 McCoy Park No
Mud Springs No
6/5/91 Mud Springs Yes 9-11
McCoy Park No
Teacup Bowl Yes 8
China Bowl No
6/6/91 Game Creek Yes 1
6/7/91 China Bowl No
Siberia Bowl Yes ND
Game Creek Yes 3
6/10/91 Super Bowl Yes 3
Teacup Bowl Yes 3
6/11/91 Sundown Bowl Yes 6
China Bowl No
Teacup Bowl Yes 5
Mud Springs No
McCoy Park No
6/14/91 Siberia Bowl Yes 15
China Bowl Yes 3
Teacup Bowl Yes 4
Sundown Bowl Yes 4
6/17/91 Mud Springs Yes 3
McCoy Park No
No Name Road Yes 20
Commando Bowl Yes 20+
China Bowl No
Teacup Bowl Yes 3
Siberia Bowl No
Pete's Bowl Yes 1
6/21/91 No Name Road Yes 42
McCoy Park Yes 7
Mud Springs No
6/25/91 Siberia Bowl No
China Bowl No
Teacup Bowl No
Sundown Bowl No
7/1/91 McCoy Park Yes 3
Mud Springs No
7/2/91 Back Bowls No
7/9/91 Back Bowls No
7/10/91 McCoy Park Yes 2
Mud Springs No
No Name Road No
7/18/91 Back Bowls No
7/23/91 Back Bowls Yes 1 radio sign.
7/24/91 McCoy Park No
Mud Springs No
7/28/91 Back Bowls No
7/29/91 McCoy Park No
Mud Springs No
Data collection for summer 1992 will be more standardized and will conform with the approach used by Morrison for collection during the period 1988-1990.
Conclusions that can be drawn from data collected during
summer 1991 are that elk continue to use the Back Bowls and McCoy
Park/Mud Springs. Elk use in China Bowl still appears to be low
when compared to adjacent Back Bowls and to data for
pre-development use in China Bowl. Numbers of elk observed in McCoy
Park/Mud Springs remain lower than pre-development observations; however, use may be increasing. Prior to development elk used this area throughout summer (Andree personal communication), but with the increase in development and human activity in the area, elk
have not been observed in the area after late July. Elk appear to
have been displaced from areas of development, but impacts on population size and performance are unknown.
Pete's Bowl Pellet Plot Study
We implemented our pellet plot study during summer 1990. A
pellet plot study measures the number of animal droppings, in this case concentrating on deer and elk, found on representative plots in a study area. Pete's Bowl was selected because i t is slated for
future development. By evaluating plots, pre- and
post-development, changes in animal use can be inferred. This study is
designed to extend for a 10-15 year period and will provide data on
elk use pre- and post-development. Both the opportunity and our
approach are unique for this type of study. Results will allow
indirect inferences to be drawn regarding elk (and deer) use. Pete's Bowl was selected, because i t would not be fiscally possible to monitor all of the 4 bowls that might be developed south of Two Elk Creek. Pete's Bowl will likely be the first bowl developed and i t may receive the largest amount of development, thus i t was the
logical candidate for monitoring.
Analysis of data from this work will provide an i tdirect index of elk and deer use. our approach will be to use nega ;ive binomial statistics and the Multi-Response Permutation Proce ures (MRPP). Negative binomial statistics will be used to ascerta·n changes in pellet densities between years. The MRPP approach wil 1 allow us to detect changes in the distribution of pellet groups b itween years, even if the total pellet densities are constant across years. This
analysis could offer insights in the location of use by elk. The
MRPP approach is currently in planning stages and, al though we believe that i t offers good potential, i t may prove i tfeasible for our work.
We implemented 175, 4 X 15 meter plots, wh · ch were all
randomly located in Pete's Bowl. This design enables us to detect
small changes in pellet distributions with good stati ;tical power.
Once plots were established (summer 1990) approxima ely 140
man-hours are required to collect field data each year.
Plots established during summer 1990 were locate l and cleared
of all animal evidence (fecal pellets, etc.). During summer 1991,
we surveyed all plots. We were unable to locate 2 pl ,ts; possibly
they were lost in an avalanche that appeared to the
slope where the plots were supposed to be. Evi .ence of all
wildlife use was recorded on the remaining 172 plots. Because this
is the first year of actual data collection, we have n > comparisons
with prior years data. Because of the large num ,er of plots
containing deer and elk pellets, our study wil. have good
statistical
On the 72 monitored plots, we found 144 elk fecal groups and 303 deer fee 1 groups, with an average of 0.84 elk groups and 1.76 deer groups Some of our interpretations are confounded because tic sheep droppings were found on plots in the upper reaches of ete' s Bowl. Domestic sheep droppings are easily confused deer droppings. Domestic sheep are not supposed to be using area and we anticipate that in the future they will not be allo ed to graze here. The pellet plot study offers good potential f r drawing inferences regarding elk and deer use. If our results are as good as predictive calculations indicate, we should be a le use this index in future work. The main advantage to this ap is that i t is less expensive than intensive telemetry w The disadvantage is that inferences are made indirectly om indices of use and without large sample sizes, the validity of conclusions is suspect. We are optimistic about the pellet plot approach.
Summer 1992 - Data Collection Approach
During summer 1992, elk use of the Back Bowls at Vail will be monitored 6 times each week for the period 25 May through 1 July. After 1 Jul monitoring will be conducted once every 10 days. We will evalua e pellet plots in Pete's Bowl in early August, and continue mo itoring elk numbers in the McCoy Park\Mud Springs area, making obse vations at least once every week from 20 May through 1 July. 1 July monitoring will be reduced to approximately every Ground observations for both the Back Bowls and the
McCoy Park\Mud Springs area will be supplemented ith aerial
early July, a preliminary report of observations will e provided
to all cooperators, and during September 1992 a report summarizing all summer 1991 data collection will be provided.
conclusions
We believe that i t is important to continue co lection of these data to elucidate patterns in elk response to d'sturbances.
We will continue to use telemetry to evaluate gross ovements of
elk at Vail. The observational data we collect in th Back Bowls
and at McCoy Park/Mud Springs will be compared to pre disturbance data to evaluate the potential for elk to acclimate to isturbance. Data we collect from the plots in Pete's Bowl will
ever" experiment that will allow us to develop a good p e-treatment data base that can be compared to post-development da
these data are an indirect measure of elk (and deer) u provide a good index of use.
Although they will
As recreational activities expand into areas th t were once
almost exclusively used for wildlife, the of these
activities must be evaluated. Currently, these are
perceived as either good or bad; but this percepti n is rarely
based on scientifically
credible data.
The data
we
collect
will
continue the progression of steps we have b
egun to ob ain credible input into the decision making process.
APPENDIX 1
Morrison, Ja es R. 1992. The effects of ski area expansion on elk
and accuracy of 2 telemetry systems in mountainous terrain. Master
of Science hesis. Colorado State University, Ft. Collins, CO.
98pp.
THESIS
THE EFFECTS OF SKI AREA EXPANSION ON ELK, ND
ACCURACY OF 2 TELEMETRY SYSTEMS IN MOUNTAINO S TERRAIN
Submitted by James R. Morrison
Department of Fishery and Wildlife Biology
In Partial fulfillment of the requirements for the Degree of Master of Science
Colorado State University Fort Collins, Colorado
COLORADO STATE UNIVERSITY
May 25, 1992
E HEREBY RECOMMEND THAT THE THESIS PREPARED UNDER OUR SUPERVISION BY JAMES R. MORRISON ENTITLED THE EFFECTS OF SKI AR :A EXPANSION ON ELK, AND ACCURACY OF 2 TELEMETRY SYSTE S IN MOUNTAINOUS TERRAIN BE ACCEPTED AS FULFILLING IN PART R :QUIREMENTS FOR THE DEGREE OF MASTER OF SCIENCE.
Committee on Graduate Work
Gary C. White
Bruce A Wunder
Adviser - A William Alldredge
Department Head - Robert S. Cook
ABSTRACT OF THESIS
THE EFFECTS OF SKI AREA EXPANSION ON ELK, AND
ACCURACY OF 2 TELEMETRY SYSTEMS IN MOUNTAINOUS TERRAIN CHAPTER 1. ACCURACY OF A 2-ELEMENT, HAND-HELD ANTENNA AND
AN AERIAL TELEMETRY ANTENNA IN MOUNTAINOUS TERRAIN
Few telemetry studies have reported the accuracy of hand-held or airplane antenna systems, and none has reported on accuracy in mountainous terrain. I measured the accuracy of a 2-element, hand-held antenna and a belly-mounted, airplane antenna on 2 study sites in mountainous terrain.
Precision of the hand-held antenna (s
=
5.43°,
n=
321) was better than that previously reported for this system in similar terrain and was closer to that reported in flat, non-timbered terrain. Contrary to the findings of Pace (1988, 1990), precision was constant, regardless of distance between transmitters and receiving stations. Significant bias of the antenna from 4 of 8 receiving stations (pooled bias=
-3.21°,
n=
321) indicated! that bounced signals were common in mountainous terrain.I used program TRIANG to triangulate the location of each transmitter, and afterwards, censored inaccurate locations by using the1 size of error ellipses as an index to poor locations. Using this method, I found that the Andrews Estimator had smaller errors associated with it than the Huber or Maximum Likelihood Estimator (MLE). The mean and 90% quantile of the distance between the true and estimated locations produced by the Andrews Estimator were 609 m and 1,105 m for Vail (n
=
49); and 940 111 and 1,531 mfor Homestake (n
=
50), respectively. Coverage of the Andrews error ellipseswas as qood or better (coverage range
=
8-39%) than error ellipses from other location estimators, but was 'still considerably less than the expected 95%.When I utilized the airplane antenna system, I found that the mean and 90% quantile [490 m and 1,081 m, respectively (n
=
50)] of the distance between true and estimated location for aerial locations was less than that of the hand-held system.Key words: aerial and ground locations, errors, mountainous terrain, telemetry, TRIANG, Yagi antenna
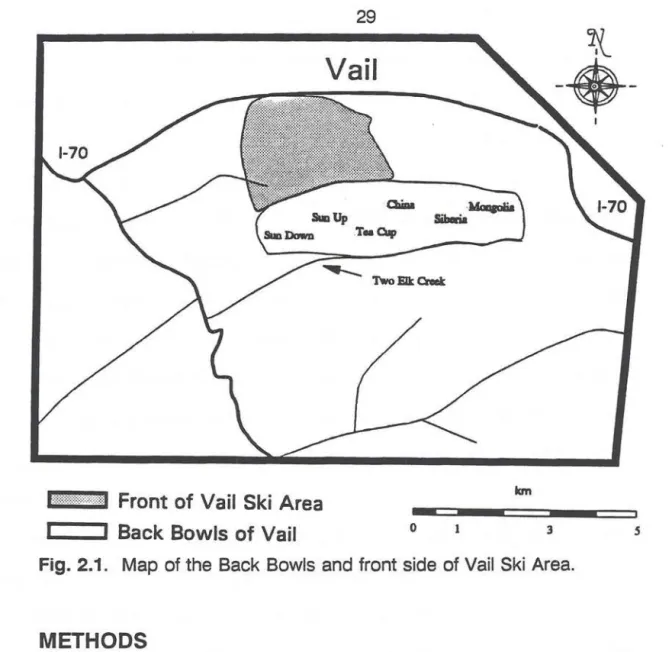
CHAPTER 2. THE EFFECTS OF SKI AREA EXPANSION ON GEOGRAPHIC USE PAlTERNS OF ELK
I documented the effects of physical disturbances in sub-alpine bowls at Vail Ski Area on the geographic use patterns of elk (Cervus elaphus). I used radio-telemetered elk and visual observations of elk in measuring the responso to this type of development. Temporal control was achieved by comparing elk use patterns which were recorded 1 year before development to those of the following 2 years. Spatial control (incorporated by comparing use patterns of elk at the ski area to use patterns of an undisturbed elk population) allowed me to factor out the effects of weather (e.g., snow melt, plant phenologies) on use patterns.
RBsults from my telemetry data indicate no change in elk use patterns after development. However, the frequent radio-signal bounce that is associati~d with mountainous terrain may have inflated location errors and decreased my ability to detect changes in use patterns had they existed.
Observational data, having a much smaller associated error, allowed detection
of more subtle changes in use patterns. Results from my observations
indicate elk use in the entire treatment study area decreased threefold after development. My analysis of each bowl suggests that this decrease was primarily influenced by an 11-fold decrease in elk use of the most developed bowl, China Bowl. I detected no changes for the remaining, less developed
bowls, Tea Cup and Siberia-Mongolia Bowls. Post development results
suggest that elk may have partially acclimated, behaviorally, to these disturbances and/or revegetation in developed bowls may have attracted elk to these areas. Although I detected changes in geographic use patterns, elk
did not completely abandon developed areas. The effects of these
disturbances likely were minimized by excluding human activity from developed areas during periods of concentrated elk use.
Key words: behavior, Cervus elaphus, elk, development, physical
disturbances, ski areas
CHAPTER 3. CHANGES IN THE NUMBER OF ELK OBSERVED AFTER
DEVELOPMENT OF 2 COLORADO SKI AREAS
I documented the response of elk to both physical and human disturbances by measuring the changes in the number of olk observed in McCoy Park and Mud Springs drainages after development. Development occurred close to the drainages after 1987 and consisted of the construction and operation of Trapper's Cabin (a guest lodge built by Be1aver Creek Ski Area) and Arrowhead Ski Area.
Ell< were observed in McCoy Park and Mud Springs for 2 summers before dit=M31opment (1985 and 1987), and I compared these observations to those madB during the 3 summers after development (1988-1990).
Using negative binomial statistics, I was unable to detect a statistical differenc13 in the number of elk observed in McCoy Park, although the first summer after development the number of elk observed was nearly half that of the other 4 summers. There was a dramatic decrease in the number of elk observecl in Mud Springs; a 46-fold decrease in elk use occurred during the first 2 summers after development. During the third year after development, the number of elk observed increased; however, the average number of elk observecl was still fourfold less than before development.
I made comparisons between time of year elk were observed in both McCoy Pairk and Mud Springs and the time of year Trapper's Cabin was used. My results indicate that after development, elk altered their use patterns and occupied these drainages earlier in the summer, before Trapper':; Cabin opened for use.
In 1 B88, changes in the number of elk observed were likely due to activities associated with the construction of Arrowhead Ski Area, and/or the presence, and operation of Trapper's Cabin. Increases in elk use of both drainages in 1989 and 1990 were likely caused by the cessation of construction at Arrowhead Ski Area, and/or the behavioral acclimation of elk to disturbances.
Key words: behavior, Cervus elaphus, development, elk, human activity, physical disturbance
ACKNOWLEDGMENTS
For their interest and financial support I thank thi3 following 11
agencies: Colorado Division of Wildlife, Vail Associates, Rocky Mountain Elk Foundation, National Wildlife Federation, Colorado State University, Eagle County, Colorado Ski Country - USA, U.S. Forest Service, Copper Mountain Ski Area, Homestake Water Board, and Arrowhead Ski Area.
Many people helped make the completion of this thosis successful. First, I am grateful to my major professor, Bill Alldredge and committee members Gary White and Bruce Wunder. All 3 provided valuable guidance, both professionally and personally.
Bill de Vergie shared the results of his past work and provided invaluable advice on study design and logistics. Bill was always willing to answer my endless list of questions.
Special thanks go to the following Colorado Division of Wildlife
employees for showing a keen interest in this research and providing essential
logistical support: Area Biologist, Gene Byrne; District Wildlife Managers, Bill Andree, Bill Heicher, and Craig Wescoatt; and pilot, .Jo13 Frothingham. Without the help of these people, this study would not have been possible. Larry Lichliter of Vail Associates deserves special recognition for his interest and cooperation in this work. Numerous volunteers, far too many to mention, also provided essential logistical support each winter trapping elk and each summer collecting data.
I thank Jan Alldredge for spending many long hours editing my thesis. Bruce Hawkins, Alice Kelley, and Dave Schoep also reviewed my thesis and made helpful criticisms. In addition, I am grateful to the many graduate
vii
-
--students who provided valuable advice and comradeship throughout my masters.
Finally, I am indebted to my Mom, Dad, 3 sisters and my friends for
their endless support.
PREFACE
My thesis is written in 4 chapters. In Chapter 1, I n~port on telemetry errors associated with a 2-element, hand-held antenna and a 2-element antenna mounted to the belly of an airplane. This chaptier is important because assessment of telemetry error was critical in cletermining the resolution of changes in use patterns that report in the second chapter. In Chapter 2, I discuss the effects of the physical development associated with ski area expansion on early summer geographic use patterns of elk. In Chapter 3, I report the effects of both physical and human disturbances on elk use patterns at 2 other Colorado ski areas, and in Chapter 4 I summarize conclusions from my first 3 chapters. Finally, in an appendix I include a bibliography of articles addressing the effects of ski areas on the environment. Much of the work in this thesis was completed by former graduate student, Bill de Vergie and myself. Both Bill and I arei tl1ankful for the opportunity and responsibility given to us to complete this study. We believe graduate students are logical investigators for studies liike this bscauss:
(1) being students we can complete studies in a cost effective manner; (2) being at the university we have access to some of the newest technology and techniques used in wildlife studies; (3) because we do not have a vested interest in the outcome of results we are more likely to complete objective, third party studies; and (4) studies like this give us an excelllent opportunity to become trained as professional biologists.
ix
----.
TABLE OF CONTENTS
ABSTRACT OF THESIS . . . iii ACKNOWLEDGMENTS . . . . . . . . . viii PREFACE... X 1. ACCURACY OF A 2-ELEMENT, HAND-HELD ANTENNA AND AN
AERIAL TELEMETRY ANTENNA IN MOUNTAINOUS TERRAIN . . . 1 STUDY AREA . . . . . . . . . . . . . . . 3 METHODS . . . . . . . . . . . . . . 4 Ground Locations . . . . . . . . . . . . 4 Aerial Locations . . . . . . . . . 1 O RESULTS . . . . . . . . . . . . . . . . 11 Ground Locations . . . . . . . . . 11 Aerial Locations . . . . . . . . . . . . . . . . . . . . 17 DIISCUSSION . . . . . . . . . . . . . . . . . 17 Ground Locations . . . 17 Aerial Locations . . . . . . . . . . . . . 22 LITERATURE CITED . . . 23 2. THE EFFECTS OF SKI AREA EXPANSION ON GEOGRAPHIC USE
PATTERNS OF ELK . . . . . . . . . 25 STUDY AREA . . . 27 METHODS . . . 29 Treatments 1, 2 and 3 . . . . . . . . . . . 29 Temporal and Spatial Control . . . . . . . . . . . . 31 Sample Units . . . . . . . . . 32 Changes in Elk Geographic Use Patterns . . . . . . . . 34 Weather . . . 44 Plant Phenologies . . . 45 RESULTS . . . 47
Treatments 1, 2 and 3 . . . . . . . 47
Changes in Elk Geographic Use Patterns . . . . . . 48 Weather . . . 62
Plant Phenologies . . . . . . . . . . . . . . . 64 DISCUSSION . . . . . . . . . . . . . . . . . . . . . 65 LITERATURE CITED . . . 69
3. CHANGES IN THE NUMBER OF ELK OBSERVED AFTER DEVELOPMENT OF 2 COLORADO SKI AREAS ... .
. . . 72 STUDY AREA . . . 72 METHODS . . . 74 Treatments . . . . . . . . . . . . . 74 Data Collection . . . . . . . . . . . . . . 7 4 Analysis . . . . . . . . . . . . . . . . 75 X
Time of Use . . . . . . . . . . . . 77 Weather . . . . . . . . . . . 78 RESULTS . . . 79 Analysis . . . . . . . . . 79 Time of Use. . . . . . . . . . . . . . . . . . 81 Human Activity . . . . . . . . . . . . . . . . . . . . . . . . 81 Weather . . . . . . . . . . . . . . . . 81 DISCUSSION . . . 84 LITERATURE CITED . . . 87 4. CONCLUSIONS . . . . . . . . . . . . . . . . . . . . 88 LITERATURE CITED . . . 93
APPENDIX A. BIBLIOGRAPHY: THE EFFECTS OF SKI AREA DEVELOPMENT ON THE ENVIRONMEN. . . . . . . . . . . 95
xi
-CHAPTER 1
ACCUFlACY OF A 2-ELEMENT, HAND-HELD ANTENNA AND AN
AERIAL TELEMETRY ANTENNA IN MOUNTAINOUS TERRAIN
Several studies have measured the accuracy of null-peak and/or twin, multi-element antenna telemetry systems (Springer 1979, Hupp and Ratti 1983, Lee et al. 1985, Garrott et al. 1986, Kufeld et al. 1987, Pace 1988, Mills and Knowlton 1989). However, use of these cumbersome antenna systems is limited because they must be fixed either at permanent towers or on vehicles. If highly mobile wildlife species, such as elk, do not remain in the vicinity of towers or roads accessible to vehicles, then these antenna systems have little utility. Consequently, to follow mobile animals, biologists have used either the 2-element, hand-held Yagi antenna, which is collapsible and easily transported, or airplanes with fixed antennas. Unfortunately, little is known about the accuracy of these telemetry systems, especially in mountainous terrain where radio signal bounce is frequent. Because of the nature of high frequency radio signals, these signals can bounce off rocks, cliffs, and even trees, which may make locating transmitters difficult (Hupp and Ratti 1983, White and Garrott 1990).
Tllree studies have measured the accuracy of the hand-held antenna (Garrott et al. 1987, Hupp and Ratti 1983, Pace 1988). Hupp and Ratti (1983) found the 2-element antenna (n = 3) was 2-3 times less precise and 8-1 O times more biased than the null-peak antenna, when it was used in areas that were relatively flat and non-timbered. Areas with more relief and timber created errors for both systems which were too large to accurately estimate locations of radio transmitters. Pace (1988) reported errors for a 4-element, hand-held antenna on flat farmland and had similar findings to those of Hupp
2
and Ratti; however, bias and sample size were not reported. Garrott et al. (1987) did not measure the precision or bias of their 2-elernent antenna system, but instead measured the distance between true and estimated locations. With distances between the tracker and transmitter ranging from 0.3-1.0 km, they reported a mean error of 267 m (range, 74-1,025 m) for moderately rolling terrain.
Several biologists have described methodology for obtaining accurate telemetry locations from aircraft (Kolenosky and Johnston 1967, Seidensticker et al. 1970, Mech et al. 1971, Whitehouse and Steven 1977, Gilmer et al. 1981); but again, few have measured the error associated with such methods. Hoskinson (1976) and Whitehouse and Steven (1977) reported errors associated with their locations from strut-mounted antennas ranging from 7-75 m (n
=
20) and 15-400 m (n=
45), respectively. In both studies, airplanes flew at low altitudes [Hoskinson (1976) flew 15-30 m above ground level] over flat terrain and made several passes over each transmitter while biologists made location estimates. Garrott et al. (1987) made locations in moderately rolling terrain (they flew 100-400 m above ground level) and reported errors associated with their strut-mounted antenna ranging from 25-750 m (mean = 275 m, n = 15).Unfortunately, inferences may be limited from the above studies when
one
or more ofthe
followingconditions are
not
met:
(1) Belly-mounted
antennas are used to locate transmitters rather then strut-mounted antennas. (2) In studies where many transmitters are used, locations must be determined quickly and several passes over each transmittE~r may not be
-3
possible. (3) Finally, mountainous terrain precludes flying at low altitudes. (for safety reasons pilots must fly at least 200-600 m above ground level).
If biologists continue to use hand-held and airplane-mounted antennas to locate telemetered animals, further assessment of the error associated with locations needs to be made, especially in mountainous terrain where radio signal bounce can frequently occur. During my telemetry work with radio-collared elk, I measured the accuracy in mountainous terrain of both a 2-element, hand-held Yagi antenna and a 2-element Yagi antenna mounted under an airplane.
STUDY AREA
My 2 study sites were in central Colorado near the city of Vail (39°30' N, 106°25' W). The Vail study site covers most of Two Elk Creek, a secondary drainage that includes 12 primary drainages. These drainages are V-shaped, indicating little past glacial activity. Elevation ranges from 2,740-3,480 m (9,000-11,400 ft). South facing slopes are approximately 20% timbered, primarily at lower elevations, and north facing slopes are 80% timbered. The Homestake study site encompasses the lower extent of Homestake Creek. Homestake Creek is U-shaped, and contains numerous rock micro-ridges (10-50 m high), suggesting past glacial activity. Elevation ranges from 2,740-3,800 m (9,000-12,450 ft), and both south and north facing slopes are 90% timbered.
METHODS
4
During the summers of 1989 and 1990, 9 and 8 Telonics1 transmitters (150-151 Mhz) were placed in the Vail and Homestake study sites, respectively. Transmitters with antenna sewn into radio collars were situated in locations unknown to me and were fastened to trees 1-1.5 m above the ground (approximately the height of transmitters on standing elk).
I used a Telonics 2-element, hand-held Yagi antenna and a Telonics scanning receiver from 3 or 4 (of 5 potential) receiving stations at Vail and 3 stations at Homestake (Fig. 1.1) to estimate the location of each transmitter. I chose each of the 8 receiving stations from 31 potential stations based on the following criteria:
1. The station was topographically prominent and provided good radio signal reception with line-of-sight across the study site, thus reducing the probability of receiving a bounced signal.
2. I positioned each station to facilitate location of 20-25 transmitters in 2-4 hours. Because I was solely responsible for determining the locations of telemetered elk while estimating the location of the above transmitters, I had to visit all stations as quickly as possible to reduce
Uni;~:~ ~f commercial name does not imply endorsement by Colorado State
-~ . -~ -".:-..
~
-•-
>-~
::::, Receiving Station A Transmitter•
Landmark D 5•.-.000
50 A 52 4Q... 000
A A .•
C,392,000•
•
•
Two Elk Creek
•
D 4,380,000 3110,000 3112,000 :sac,000 4,3118,000 C,3118,000 C,384,000 C,302,000 UTMX
•
•
•
.
.
. .
/ /
/
.
/ //
'
/
\
, / Homestake Creek 370,000 378.000 UTMX•
,48 ,A 2 A 300,000 Vail 45 A•
•
•
•
D 31111,000 31111,000 Homestake ,.
7 A 3112.000Fig. 1.1. Maps of receiving stations, transmitters, and landmarks on Vail and Homestake study sites. Number for each receiving station is listed. Mean distances between stations and transmitters were 2.5 km (range, 0.5-4.6 km) and 4.2 km (range, 1.6-8.5 km) respectively for Vail and Homestake sites. Mean distance between stations and landmarks was 4.0 km (range, 3.3-5.2 km). Axes are scaled by Universe Transverse Mercator (UTM) coordinates, and each block is 1 km 2 or 100 ha.
6
location errors which might be due to animal movements (Schmutz and White 1990).
3. located each station as close as possible to geometrically optimal
locations (White 1985). In general, to minimize errors in triangulation, stations should not be too close to each other, and if the study site includes an entire drainage, they should be located on both sides of the drainage.
Because of criterion 2, I could not situate stations on both sides of the drainage and still complete locations in 2-4 hours. Consequently, I placed stations only on 1 side of the drainage for both Vail and Homestake study sites.
Elevation of receiving stations averaged 3,350 m (11,000 ft) for Vail and
3,230 m (10,600 ft) for Homestake. Mean distances between transmitters and
receiving stations were 2.5 km (range, 0.5-4.6 km) and 4.2 km (range, 1.6-8.5 km), respectively, for Vail and Homestake.
I
measured the bearing at each station, within1
°,
to the strongestradio signal for each transmitter with a Silva Ranger2 mirrored compass, and
I estimated 4-5 locations for each of the 17 transmitters, (49 and 50 locations for the Vail and Homestake sites, respectively) by using the computer
program TRIANG (White and Garrott 1984, 1990).
r
maximized independence
of the 4-5 locations on each transmitter by taking the following precautions to prevent past locations from influencing future locations: (1) While I located
2
Use of commercial name does not imply endorsement by Colorado State University.
-
-
-7
transmitters fixed to trees,• f also located transmitters on 20-25 moving elk.
(2) I made locations at least 1-week apart. (3) I did not use program TRIANG
to estimate transmitter· locations until · I -retrieved transmitters. The true
location of each transmitter was determined with topographic maps, using triangulation on known landmarks and careful inspection of proximate
topography and vegetation. I did not measure the error associated with
ascertaining these true locations, but because I used the above methods to determine these locations, the error of the true location of each transmitter is
likely within 30-50 m.
I measured the error associated with this telemetry system using the following methods:
1. I measured the precision of all 8 receiving stations. This was measured for each station by standardizing the median of bearings for each transmitter to zero and then pooling the data for all transmitters. In addition, data for all 8 stations were pooled to get an overall precision. Because TRIANG requires that standard deviation of all towers be equal, I tested to see if standard deviations differed between the 8 stations by using Levene's test (LEV1 :Median variation) for homogeneous variance (Conover et al. 1981). This variation used the absolute difference between each datum and the median. In addition
to testing for equal precision between receiving stations, I tested for
equal precision as distance between transmitters and receiving stations increases. The Andrews, Huber and Maximum Likelihood Estimator assume that precision is equal as distance increases; however, Pace (1988, 1990) found that precision for his telemetry system was not
8
constant as distance increased, but rather the relationship was more bath-tub shaped [i.e., precision remained constant over most of the spectrum of distances and increased only at close ( < 5 m) and far distances {> 950 m)] (Fig. 1.2). Using Levene's test, I tested for changes in precision as related to distance by using distance criteria to
block data for bearings standardized to zero. Distances between
transmitters and receiving stations ranged from 0.56 km to 8.5 km. Consequently, I blocked data into 5 groups; 0-1, 1-3, 3-5, 5-7, and 7-9
km.
-
-
-
-
-
-
--
- - -- -
-
- -
- - --
-
-
- -
- -
-
- -
-
- -
-
l!
Distance Between Transmitter and Receiving Station
_ .,
Fig. 1.2. Theoretical behavior of variance and prec1s1on as related to the ,~
distance between transmitter and receiving station. Solid line illustrates Pace's theory where precision increases at close and far distances. Dashed line illustrates the theory of constant precision.
2. I measured the bias
of
bearings byaveraging
the differences between the
true bearing for each transmitter and each estimated telemetry bearing. Biases of transmitters were pooled for each station. Using Student's t-test, I tested whether the bias was different from zero for each station and all stations pooled.
,
_
9
3. I measured the distance between true and estimated locations for all 3 estimators available through TRIANG, the Andrews, Huber and MLE (Lenth 1981). Without radio signal bounce, these 3 estimators produce the same location estimate (White and Garrott 1990). However, with signal bounce, the Andrews and Huber Estimators attempt to detect this bounced signal by weighing signals less where the distance between the receiving station and estimated location is greatest and weighing signals more where intersection with other bearings is closest to the optimal angle of 90° (White and Garrott 1990). Neither of these estimators are designed to estimate locations with more than 1 bounced signal when only 3-4 receiving stations are used.
4. Finally, I measured the coverage of error ellipses, which is the percentage of error ellipses that covered true locations, for all 3 estimators.
Because bearings from 2-element antennas are not as precise as those from null-peak antennas (Hupp and Ratti 1983), TRIANG is not as sensitive in detecting bounced signals. As a result, TRIANG uses bounced signals to estimate locations when it should not. To decrease the probability of using less accurate locations, I used a censoring method identical to that used by Garrott et al. (1986). I completed censoring by plotting Andrew's error ellipse versus distance between true and estimated location for each study site. In theory, the relationship between error ellipse size and the distance between true and estimated locations should be positive and curvilinear; i.e., the area of error ellipses increases to the squared power while the distance between the true and estimated locations increases to the first power. If a positive relationship exists between these 2 variables, one can then delete locations
10
with error ellipses above a certain size to decrease the probability of using locations with the greatest error.
After inspection of the positions of Homestake receiving stations in relation to the transmitters, I realized my receiving stations were not positioned adequately to allow estimation of locations for the southern section
of the study site (Fig. 1.1) (White 1985). Consequently, to decrease the
probability of using poor locations, I deleted all locations that had a Universe
Transverse Mercator (UTM) Y coordinate south of 4364000 N.
I also tested for triangulation errors associated with reading a hand-held compass by making 10 visual locations of 2 landmarks (5 each) in Super Bowl on the Vail study site. I used stations 48, 49, and 52 to make these locations. For analysis, I pooled data from all 3 stations and named this
station 99. To allow for comparison, I used the same 4 methods for
measuring error on both visual locations and telemetry locations (except, precision was not tested as related to distance between landmark and receiving station). Mean distance between landmarks and receiving stations was 4.0 km (range, 3.3-5.2 km).
Aerial Locations
Fifty locations were completed from an airplane on 17 transmitters fixed to trees, and 1 0 additional transmitters that had fallen from radio-collared elk
(these were
on collars that were
designed to drop
off elk
after a
2
year period
or were transmitters from elk mortalities). Aerial locations were determined 200-600 m above ground from a Cessna 185 airplane with a rotating,
belly-mounted antenna. Locations of these transmitters were made while
concurrently locating 50-60 radio-collared elk during flights lasting from 4-6
-__
,11
hours. Because of the large number of transmitters being located, locations
were made as quickly as possible (mean location time
=
4-6 min/location).Generally, each transmitter signal was tracked to the strongest signal source and the pilot circled this source once. Locations were plotted on 7.5 minute topographic maps and were later converted to UTM coordinates. I report error as distances between true and estimated locations. This error includes the error associated with locating transmitters and that associated with plotting locations on topographic maps.
RESULTS
Ground Locations
Using Levene's test for homogeneous variance, I rejected my null hypothesis that precision was equal between all receiving stations
(P = 0.0001) (Fig. 1.3). After further analysis, I found that when I deleted the
least precise station (Station 45) I was unable to reject (P
=
0.42). Althoughthe standard deviation of Station 45 was larger than the rest, I included this station in the pooled standard deviations used for TRIANG. TRIANG uses this standard deviation to calculate the size of error ellipses (e.g., a larger standard deviation will cause TRIANG to produce larger error ellipses) and I chose to include station 45 so that error ellipses would reflect the maximum error of locations and provide the highest coverage of true locations. The
pooled standard deviation for the 8 receiving stations was 5.43
°.
The12
•
• 12 Statioo 2 26 Statioo 7 14 I l"1 1 '"'4.9 1 • 6.0 Bia• -4.0 n •46 1 • s.o Bia .. -5.1 D., 51 12 , - I Bia• -1 0.1 10 20 I D ""51 10 I I 8 ,.. I 16 8 I 8'""'
8 I 10 I 4 I 4 I...
2 & 2 I Ir
I O -24 ·18 ·12 O •24 •18 •12 -fl O 8 12 18 • 10 10 I Station 45 5.4 14 Station 48 Statioo49 I 1 = 8.3 1 =4.3...
...
1-= 5.8 IBilll • • 12 Bia-= -1.0 8 Biu .. -0 .5
8 _, D =36 _, D • 50 D • 36 I 10
...
I -I 8 I 8I--
I I 8-
I I- 4 I-
I 4 -I 2 ,... I...
2 ,... I 2.. ..
IT
n
I 0 •24 •18 ·12 -fl O 8 12 18 O -24 •18 -12 -fl O 8 12 18rn
nr
...
O ·24 ·18 ·12 -fl 0 8 12 18 6 I Station 14•
Station 52 30•
I sa.ioa99 I 1 = 3.6 rr • = 4.5•-=
1.2 I 4...
50 1.3 Bia= - 12 Bias .. +s.s D ""38 26 I Biu - +2.6 I D = 13 D-= 31 I 10 20 I ,_ 3 I 8 I 16 I 2 ,,... 8 I...
, 10 I 4 1...
I...
I _. 6 I I 0 2n
l
o..._ _ _ ...,...,11o1,1...,...,. ... 0 ·24 -18 -12 -fl O 8 12 18 ·24 •18 •12 -fl O fl 12 18 Degrees ·24 -18 ·12 -fl 0 e 12 18Fig. 1.3. Frequency of bearings deviating from median for 8 stations used to
make telemetry locations. Bias is indicated for each station by shifting
distributions from 0. Stations 2, 7 and 9 are in the Homestake study site and stations 45, 48, 50 and 52 are in the Vail study site. The 9th station, 99, is for landmarks in Super Bowl that were visually located and sighted in with compass. Dotted vertical line marks bias for each station and vertical solid
line marks no bias. Asterisks mark stations that had a bias significantly
different from zero (a
=
0.05). For all stations, except Station 99, n=
321.-_,.,..
,-13
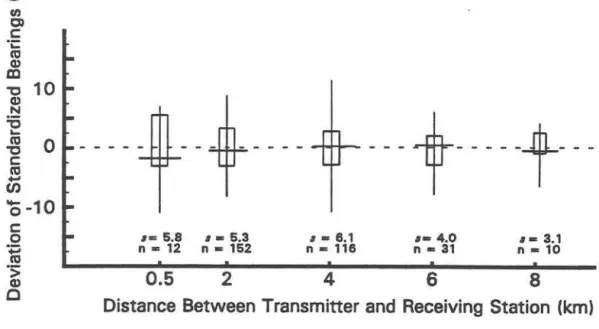
Overall, precision of bearings did not change as a function of distance between transmitters and receiving stations (P = 0.13) (Fig. 1.4). However, a general trend of greater precision as the distance between transmitter and station increased was present. When I grouped data for the transmitters that were between 0.5 km and 5 km from receiving stations and compared them with data for transmitters greater than 5 km, I found the bearings on the distant transmitters to be more precise (P
=
0.02).Fifty percent of 8 stations (40% at Vail, 67% at Homestake) had a mean bias significantly different from zero (a = 0.05) (Fig. 1.3). Mean bias for all 8 stations pooled was -3.21 °, which was significantly different from zero
(P
=
0.0001). Bias for visually located landmarks was +2.6°, which was also significantly different from zero (P=
0.001).A positive correlation existed between error ellipse size and distance between true and estimated locations (r2
=
0. 76) (Fig. 1.5) for Vail data. Ideleted all locations with error ellipses greater than 150 ha. I did not delete ellipses less than 150 ha because errors did not decrease significantly after those deletions. No correlation (r2
=
0.001) was observed between errorellipse size and the distance between true and estimated location for stations at Homestake. However, to delete obviously poor locations at Homestake, I
censored only those locations with error ellipses greater than 300 ha.
The MLE had a lower associated error than Andrews or Huber Estimators before deleting poor locations (Fig. 1.6, Table 1.1) at Vail. The MLE performed as well (within 5-10 m) as the Andrews and Huber for all locations except for a few with large errors (errors > 2,000 m). For locations associated with larger errors, the MLE was substantially better, with
-
(I.) C, C ·;:: C0 Q) al -o 10 Q) N=o
...
~ 0 C C0...
en 'o-10 C 0 ·;:; 10 II"" 5,8 I I • 5.3 n"' 12 n"' 1520.5
2
14 8 - 8.1 n"' 118 4---t----
-t---II• 4.0 n • 31 6 ... 3.1 n • 10 8 ·s; Q) 0Distance Between Transmitter and Receiving Station (km)
Fig. 1.4. Precision of standardized telemetry bearings as related to distance between transmitter and receiving station. Horizontal line marks median, upper and lower box lines mark 75% and 25% quantile, respectively, and upper and lower points of each vertical line mark 95% and 5% quantile, respectively. I detected no difference overall (P
=
0.13), but a difference was detected when bearings were pooled for the first 3 groups and compared to the later 2 groups (P=
0.02).Vail
Homestake ,5. 4,000 C: 0 .::; CV (.) .3 -c, 3,000 J!:? CV E .::; 8j "C j 2.000 G) ::,a::
C: G) G) ~ ~ G) (.) C: ii.~'!" bi, ....
,,
,-r • 0.76---·
--4,000 3,000 D, 2,000 ••
r2 • 0.001t
t]1 i5 o o!'--~zoo~--'400"'---800.._ _ _ 800Error Ellipse (ha)
oa:----:=----~~-•-•
200 ~ 800Error Ellipse (ha)
Fig. 1.5. Distances between true and f .
Andrew's error ellipses from program T~f~~~ted location~ as a fu~ction of ~xpected curvilinear relationship assuming cir~ul Das~~d hne for ya1I shows lines show cut-off point f ' . . ar e_ ipses. Vertical dotted than lines were deletegr ce~~i~1~J~dant loc~t1ons with error ellipses greater locations that were not adequately cove:~~nb es for_ _Homest_ake are those
n
= 49 and for Homestaken
=
50. Y rece1v1ng stations. For Vail,800