ASSISTANCE TO
DEVELOPING
Issued in furtherance of Cooperative Extension work, Acts of May 8 and June 30, 1914, in cooperation with the U.S. Department of Agriculture. Kenneth R. Bolen, director of Cooperative Extension, Colorado State University, Fort Collins, Colorado. Cooperative Extension programs are available to all without discrimination. To simplify technical terminology, trade names of products and equipment occasionally will be used. No endorsement of products named is intended nor is criticism implied of products not mentioned
Agricultural
Assistance to
Developing Nations
Warren L. Trock''Colorado State University Cooperative Extension Economist and Professor, Department of Agriculture and Resource Economics
Summary
Today there is need and opportunity for development in most countries of the Third World. The poor in many countries have a continual food deficit while the developed nations experience increasing abundance, even surpluses, of food.
Improvement of agriculture in less-developed nations facilitates economic growth and increases incomes, some of which is used for the import of food. Evidence of this relationship is found in the decade of the 1970s, when developing nations became important to world-wide trade in agricultural products.
Those who have critically examined the question of technical and economic assistance suggest that it is in our interest to continue our extension of assistance to agriculture in developing nations.
Table of Contents
Introduction 1
World Agricultural Trade 2
U.S. Agricultural Exports 5
Agricultural and Economic
Development in
Developing Nations 8
Issues and Policies: Technical
and Economic Assistance 15
Introduction
Colorado farmers and ranchers with increasing frequency are asking: Is agricultural development assistance to Third World nations in the best interest of American agriculture?
Answers to the question, as they are reported in numerous publications, are mixed. Kenneth Bader, chief executive officer of the American Soybean Association, has said: "U.S. farmers are concerned and vocal over this seeming rush to export the production technology that once made them the world's most efficient producers We should insist that efforts be made to create demand for the
product within the country so that the commodity does not end up competing with the United States in the export market" (Bader, 1987).
Gary Vocke, writing about development assistance, economic growth and trade, expressed a different judgment about the effect of agricultural assistance: "By increasing the productivity of the land, new agricultural technology can initiate broad based economic development leading to
industrialization and rising per capita incomes. Rising per capita incomes create food demand that eventually outpaces growth in agricultural
production " (Vocke, 1987).
Directors of State Departments of Agriculture have responded to criticisms of agricultural
assistance by resolving: "The National Association of State Departments of Agriculture . . . opposes the use of any federal money to subsidize foreign
agricultural competition . . . NASDA also opposes the destruction of the American Farm System by . . . any agency which offers low-interest rates to foreign agricultural entities" (NASDA, 1986).
Orville Freeman, president of the Agricultural Council of America, advised his membership: "American farmers should be the first to advocate aid to developing countries, particularly agricultural technical assistance, to expand their economics and improve incomes. Only in that way can a poor country move into the economic mainstream and become a growth customer for U.S. farm products" (Freeman, 1984).
It is apparent that there is disagreement among leaders within the agricultural industry relative to the consequences of technical and economic assistance to developing nations. It is likely that bases exist for the differing points of view. It is worthwhile to find the facts, to ascertain the responses to agricultural assistance and to make them evident.
It is the purpose of this publication to report the careful analyses of assistance as it has affected
agricultural and economic development in Third World nations, and as it has influenced the competitive positions of developing nations in world-wide trading activities. The changing international market for agricultural products is reviewed, and the U.S. share of the market is noted to establish its significance. Data descriptive of U.S. exports are examined, with attention to the
changing significance of developed and developing nations as our customers.
The economic circumstances of the developing nations are considered. The role of agriculture in development is noted, and the effects of
development on employment, incomes, food consumption and imports exports are reviewed.
The extent of competition of developing nations in world markets for agricultural products is
examined by reference to imports and exports of these nations as development proceeds. The same data are examined to determine the extent to which developing nations have become our customers. By this means a measure of the net effects of assistance is developed, and insight into the extent of gains and losses which arc attributable to agricultural assistance is gained.
Finally, there is suggestion of the policy choices which we must debate, as we answer the question posed earlier: Is agricultural development assistance in the best interest of American agriculture? Ultimately, we will choose a course of action — a retreat from assistance, a status-quo kind of policy, or an emphasis on assistance because of the merits of such a policy.
References
Kenneth L. Bader; "The Third World and U.S. Agriculture," in U.S. Agriculture and Third
World Economic Development: Critical
Interdependency; National Planning Association; Washington, D.C.; 1987.
Gary Vocke; Economic Growth, Agricultural Trade and Development Assistance, Economic
Research Service, USDA; Washington, D.C.; March, 1987.
National Association of State Departments of Agriculture; "Subsidizing foreign Competition": Policy No. MAD-8; September, 1986.
Orv ille L. Freeman; "An Agricultural Policy for the U.S.: 1985-1990"; A speech to Southern States Cooperative Annual Meeting; November 14,
World Agricultural Trade
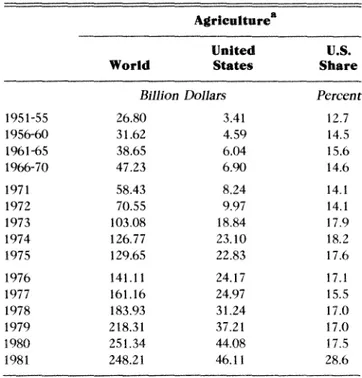
Until t h e decade of the 1970s, neither world agricultural trade nor the U.S. share were significant proportions of global supplies and uses. In the 1950s, many of the developed nations were involved with recovery of economies from the distress of World War II. Western European nations were busy with t h e creation of economic unions. T h e Soviet block nations were developing their political and economic relations and struggling with economic recovery. T h e United States adjusted to peacetime levels of activity in the early 1950s, with attention to agriculture in the form of production limitations. T h e markets for agricultural products were chiefly domestic, with only $3.5 billion to $4.5 billion of exports (See Table 1).
In this decade the underdeveloped nations continued their struggle with survival, some making attempts to limit population growth and a few promoting expansion of agricultural sectors in an effort to improve food supplies. Assistance was limited largely to gifts of grain via the PL 480 program of the United States and other, modest programs of the developed nations.
In the 1960s there was some improvement in world agricultural exports, from about $35 billion to $50 billion, with virtually no change in the U.S. share. T h e PL 480 program continued to be
important in the assistance given to underdeveloped nations, but programs of technical assistance grew in importance. Emphasis shifted to development of agricultural sectors and expansion of general
economies of several political entities that we began to describe as the developing nations. For a few of these nations growth was sufficient enough that they began to b e noticeable participants in world trade as importers and exporters.
T h e decade of the 1970s produced significant changes in world agricultural trade and a positive change in the U.S. share. World agricultural exports increased from $58 billion in 1971 to $251 billion in 1980, the peak value for exports from all nations (See Table 1). Exports from the United States increased from $8 billion in 1971 to $44 billion in 1980; U.S. share grew from 14.1 percent to 17.5 percent with t h e share highest in 1974.
In this decade, expansion of world agricultural exports was prompted by essentially three factors. T h e first was growth in the world's economy — led by the economic expansions in Japan and northern Europe (Hathaway). Important also was positive economic change in the high-growth, developing nations such as Korea, Taiwan and Brazil. T h e second factor was the population boom in the developing world, a consequence of both high birth rates and extended life spans as medical science affected human survival. Failure to achieve
development in agriculture led to a requirement for
import of food. Availability of credit permitted imports to fill the "food-gap". The third factor was the failure of agriculture in the centrally-planned economies to produce enough food to satisfy increasing demands for food, especially meats. By 1980 these countries were importing 80 million tons of grains and oilseeds annually.
Table 1. World Agricultural Exports and U.S. Share;
Averages 1951-70 and Annual 1971-81
Agriculture8
World United States Share U.S.
Billion Dollars Percent
1951-55 26.80 3.41 12.7 1956-60 31.62 4.59 14.5 1961-65 38.65 6.04 15.6 1966-70 47.23 6.90 14.6 1971 58.43 8.24 14.1 1972 70.55 9.97 14.1 1973 103.08 18.84 17.9 1974 126.77 23.10 18.2 1975 129.65 22.83 17.6 1976 141.11 24.17 17.1 1977 161.16 24.97 15.5 1978 183.93 31.24 17.0 1979 218.31 37.21 17.0 1980 251.34 44.08 17.5 1981 248.21 46.11 28.6
"includes values of agricultural inputs, e.g. fertilizer, seed, etc. Source: The Dilemmas of Choice, 1986.
The 1980s
In the decade of the 1980s one of the economic activities, identified by Hathaway as significant to expanded world trade in agricultural products, turned around. In a reaction to the expansionary period of the 1970s, which produced high rates of inflation and large and rapid capital movements, developed nations changed monetary policies. Actions were taken that reduced money supplies and raised interest rates. The consequence was a
reduction of available credit and increased costs of existing debt (Miller, 1986).
Impacts of these changes in monetary policy were felt especially in the developing nations — those nations that were achieving growth and becoming important in international agricultural trade. Significant to their development had been foreign capital, i.e. credit, available at relatively low rates of interest. Suddenly, in 1981-82, that critical flow of capital was greatly reduced and the costs of existing debt rapidly increased. The certain result
was a slowing of growth — a reduced level of economic activity (See Table 2). Their involvement in trade was affected by a diversion of foreign exchange from imports to increased interest payments to international creditors.
Among the developed nations the changes in monetary policies had variable effects. Inflation rates were generally reduced, as was the intent, interest rates increased and economic activity was reduced but not to an equal extent among nations. A
comparatively strong dollar developed in the United States. It attracted capital to debt and equity
investments, and it stimulated economic activity (in both the public and private sectors) beyond that of some other developed nations.
Unfortunately the strong dollar influenced our involvement in international trade, such that imports increased and exports decreased in value. The trade balance became and remains negative. Reduced purchasing power of foreign currencies were an important reason for a changed balance of imports and exports of agricultural commodities. As is evident in Table 3 exports declined rapidly after
1981, and imports increased but at a slower rate. The trade balance has only recently begun to turn
around with a weakening dollar and more competitive prices.
Kenneth Price, editor; The Dilemmas of Choice; Resources for the Future, Washington, DC.;
1985.
T. Miller, W. Trock, and I). Smith: Future Prospects
for Agriculture in Colorado and the United
States; Cooperative Extension, Colorado State University; March, 1986.
World Agriculture, Situation and Outlook Report;
Economic Research Service, USDA; Washington,
DC., September, 1987.
Foreign Agricultural Trade of the United States;
Economic Research Service, USDA; Washington,
D.C.; 1987 Supplement.
D. Hathaway; Government and Agriculture
Revisited: A Review of Two Decades of Change;
unpublished paper; Consultants International Group, Inc.; Washington, D.C.
Percent Change
World 4.1 3.0 2.8 2.6 3.0
United States 6.6 3.0 2.9 2.9 3.6
World Less U.S. 3.2 3.0 2.7 2.5 2.7
Developed Countries 4.5 3.1 2.6 2.4 2.8 Less U.S. 3.4 3.3 2.4 2.2 2.3 EC-12 2.3 2.4 2.4 2.1 2.2 Japan 5.1 4.7 2.5 2.5 2.7 Developing Countries 3.1 2.5 2.6 2.1 3.7 Oil Exporters 1.3 -0.1 -2.1 0.2 3.0 Non-oil Exporters 4.4 4.2 5.8 3.5 4.1 Latin America 3.3 3.6 3.7 1.4 2.7
Africa & Middle East 1.1 0.1 -1.2 0.1 3.3
Asia 5.4 4.0 5.8 5.5 5.3
Centrally Planned
Countries 3.7 2.9 3.9 3.6 3.4
T a b l e 3. V a l u e o f U.S. F o r e i g n T r a d e a n d T r a d e B a l a n c e (Agricultural. Nonagricultural), O c t o b e r - S e p t e m b e r 1980-87)"
Agricultural P r o p o r t i o n
Y e a r Agricultural Nonagricultural Total o f T o t a l
Million Dollars Percent
U.S. Exports: 1980 40,481 169,846 210,327 19 1981 43,780 185,423 229,203 19 1982 39,097 176,308 215,405 18 1983 34,769 159,373 194,142 18 1984 38,027 170,014 208,041 18 1985 31,201 179,236 210,437 15 1986 26,309 176,628 202,937 13 1987 27,859 202,331 230,190 12 U.S. Imports: 1980 17,276 223,590 240,866 7 1981 17,218 237,469 254,687 7 » 1982 15,485 233,349 248,834 6 1983 16,373 230,527 246,900 7 1984 18,916 297,736 316,652 6 1985 19,740 313,722 333,462 6 1986 20,875 342,855 363,730 6 1987 20,643 367,381 388,024 5 Trade Balance: 1980 23,205 -53,744 -30,539 — 1981 26,562 -52,046 -25,484 -1982 23,612 -57,041 -33,429 -1983 18,396 -71,154 -52,758 -1984 19,111 -127,722 -108,611 — 1985 11,461 -134,486 -123,025 _ 1986 5,434 -166,227 -160,793 -1987 7,216 -165,050 -157,834 •
Source: Foreign Agricultural Trade of the United States, 1987 Supplement.
T a b l e 4. Value o f S e l e c t e d U.S. C o m m o d i t y E x p o r t s , Fiscal Years 1972-86
A n i m a l s W h e a t F e e d O i l s e e d s Fruits, Nuts a n d a n d Grains a n d a n d Y e a r P r o d s . P r o d s . a n d P r o d s . Rice P r o d s . V e g e t a b l e s T o t a l2 Million Dollars 1972 1,062 1,149 1,326 334 2,137 758 8,242 1973 1,438 3,284 3,017 439 3,663 893 14,984 1974 1,826 4,652 4,480 839 5,552 1,212 21,559 1975 1,666 5,292 4,904 941 4,753 1,374 21,817 1976 2,207 4,787 6,010 607 4,692 1,532 22,742 1977 2,646 3,054 5,391 704 6,388 1,724 23,974 1978 2,828 4,139 5,751 873 7,440 1,913 27,289 1979 3,643 4,862 6,709 884 8,555 2,247 , 31,979 1980 3,771 6,633 9,169 1,170 9,811 3,041 40,481 1981 4,107 8,052 10,497 1,537 9,305 3,558 43,780 1982 4,075 7,675 7,051 1,149 9,545 3,412 39,097 1983 3,748 6,223 6,582 874 8,721 2,871 34,769 1984 4,218 6,783 8,217 897 8,602 2,816 38,027 1985 4,075 4,526 6,884 677 6,195 2,832 31,201 1986 4,367 3,546 3,819 648 6,266 2,915 26,324
'Year ending September 30.
U.S. Agricultural Exports
With this background it is instructive to look at the experience of the United States as a principal participant in world agricultural trade. Both the destinations and the components of exports are of interest, as they are relevant to the question of assistance. It is also worthwhile to consider the relationship of exports to imports of agricultural commodities, for sustained trading relationships require a two-way exchange between trading partners.
It has been noted previously that exports (trade) in agricultural commodities were relatively
unimportant in the decades of the 1950s and 1960s. It was in the early 1970s that sales in the
international markets really accelerated (see Table 1). And of course it was in the 1970s that farmers in the United States, sensing market opportunities, made the investments in technology that enabled them to be competitive in expanding markets. They were able to increase their shares of world exports.
Table 4 contains the reported values of agricultural commodity exports through the most recent decade and a half (values for cotton, tobacco and some minor commodities are excluded). It is apparent that oilseeds, feed grains, wheat, animals and related products have been the principal exports. The significance of each commodity group has varied through the 15-year period. Average values of exports for the 1980s show these commodities rank in the following order of
importance: (1) wheat; (2) oilseeds; (3) feed grains; (4) animals and products: (5) fruits, nuts and vegetables; and (6) rice.
That the average values of wheat, feed grains, and animals and animal products exported are 68 percent of the average total value of exports in the 1980-86 period is significant. These are Colorado's most important agricultural products. Although wheat is the only commodity that leaves Colorado in significant quantities for shipment to foreign users, the markets for wheat, feed grains and animal products are international and Colorado producers contribute importantly to them. Without the foreign outlets, possibilities for production and disposition of these commodities would be much constrained. Resources would be underutilized, production would be limited to domestic uses, and prices likely would be lower. Exports are important to the markets for the principle commodities of Colorado and the United States.
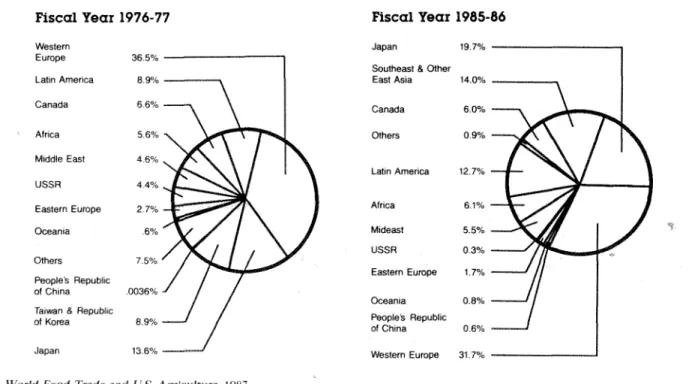
Indicators of destination of U.S. agricultural exports are in Figures 1 and 2. Notable in Figure 1 are the changes in shares of exports going to nations and regions as they are reported for the periods
1976-77 and 1985-86. As the figure is examined it should be recalled that within the 10 years which separate the two time periods U.S. exports grew by 80 percent (to 1981) then declined by 40 percent (to
1986) to a level which was little greater than the value of exports in 1976-77. Through the 10 years, exports to Western Europe declined sharply in importance. In the same time, exports to Japan and countries and regions that were developing grew in importance. Areas of significant growth in U.S.
Figure 1. U.S. Agricultural Export Percentage Shares Fiscal Years Fiscal Year 1976-77 Western Western Europe 36.5% Latin America 8.9% Canada 6.6% Africa 5.6% Middle East 4.6% USSR 4.4% Eastern Europe 2.7% Oceania .6% Others 7.5 % People's Republic of China .0036%
Taiwan & Republic
of Korea 8.9% Japan 13.6%
Source: World Food Trade and U.S. Agriculture, 1987.
Selected Destinations, 1976-77 and Projected 198S-86 Fiscal Year 1985-86
Japan
Southeast & Other East Asia Canada Others Latin America Africa Mideast USSR Eastern Europe Oceania People's Republic of China Western Europe
exports were Latin America, Southeast and East Asia, and Japan. Moderate growth in exports was experienced in Africa, and exports to Eastern Europe declined somewhat.
A different summary of shares of exports is pictured in Figure 2 and reported in Table 5. Shown are exports to developed, less developed and (in the table) centrally planned countries. It is evident that growth in terms of shares has been experienced within the less developed countries. As agricultural production has developed within the European Community, exports to that region (which includes developed countries) have declined. Exports to China, Russia and other centrally planned economies have been variable and have depended greatly on their own levels of production. Added attention will be given to the exports to developing nations at a later place in this publication. It is sufficient to note here that they have been important to expansion of our export markets for major agricultural
commodities.
Figure 2. U.S. Agricultural Exports to Developed and Less Developed Countries
Source: National Food Review, 1987.
The relationship of U.S. imports of agricultural products to corresponding exports is in Table 6. The identity and values of imports is in Table 7. As noted earlier there has been significant increase in the value of exports of agricultural commodities. The increase from 1970 to the peak year of 1984 was 446 percent. The decline in 1985 and 1986 changes the relationship to 278 percent of 1970 exports.
Imports are a somewhat different story. Imports of agricultural commodities grew from $4.0 billion in
1960 to $20.8 billion in 1986 with little variation in the rate of growth. The strong dollar in the 1980s caused some acceleration in the rate of change as prices of imported products became more favorable. Since 1986, the dollar has weakened relative to other major currencies and imports have stabilized and declined.
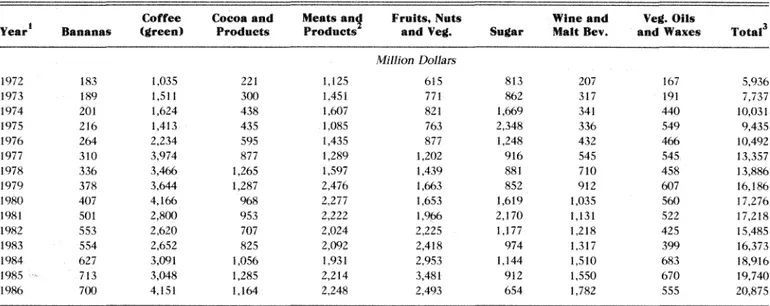
The identity of imported commodities is of interest. Commodities and values are noted in Table 7. It is apparent that several of the important imports are not commodities which are or can be produced in the U.S. (e.g. bananas, coffee, cocoa, and some vegetable oils). Other imports are more or less competitive with commodities produced here (e.g. fruits, nuts, vegetables, sugar, wines, etc.). When such produce are grown, harvested and imported at times when ours are not available, they are not
competitive, rather they are complementary to our products.
Those commodities that have been most important in terms of values of imports are coffee, meats and meat products, fruits, nuts and vegetables. Wines and malt beverages were imported
increasingly when their prices were competitive in the 1980s (the era of the strong dollar). Sugar imports are regulated and are sensitive to policy
determinations. Vegetable oils not produced in the United States have been imported in increasing quantities.
As was the case with exports, imports of agricultural commodities from developed and developing nations are of interest. The data in Table 8 indicate some growth in imports from the
developing nations in the 1970s with a
corresponding reduction in imports from developed countries. This was the time period when the
Table 5. Share of U.S. Agricultural Exports by Major Development Category, Selected Fiscal Years, 1970-86 Year Developed Market Economies Less Developed Countries Centrally Planned Countries Percent 1970 66 29 5 1975 57 37 6 1980 52 34 14 1986 53 41 6
Source: Foreign Agricultural Trade of the United States, Selected Years.
Table 6. Value of U.S. Agricultural Exports and Imports, by Fiscal Year
I960 1970 1984 1986
Million Dollars
U.S. Agricultural Exports 4,628 6,958 38,010 26,324 U.S. Agricultural Imports 4,010 5,686 18,910 20,875 Source: Assistance to Developing Country Agriculture and U.S.
Table 7. Value of Selected U.S. Commodity Imports, Fiscal Years 1972-86
Coffee Cocoa and Meats and Fruits, Nuts Wine and Veg. Oils
Year' Bananas (green) Products Products and Veg. Sugar Malt Bev. and Waxes Total3
Million Dollars 1972 183 1,035 221 1,125 615 813 207 167 5,936 1973 189 1,511 300 1,451 771 862 317 191 7,737 1974 201 1,624 438 1,607 821 1,669 341 440 10,031 1975 216 1,413 435 1,085 763 2,348 336 549 9,435 1976 264 2,234 595 1,435 877 1,248 432 466 10,492 1977 310 3,974 877 1,289 1,202 916 545 545 13,357 1978 336 3,466 1,265 1,597 1,439 881 710 458 13,886 1979 378 3,644 1,287 2,476 1,663 852 912 607 16,186 1980 407 4,166 968 2,277 1,653 1,619 1,035 560 17,276 1981 501 2,800 953 2,222 1,966 2,170 1,131 522 17,218 1982 553 2,620 707 2,024 2,225 1,177 1,218 425 15,485 1983 554 2,652 825 2,092 2,418 974 1,317 399 16,373 1984 627 3,091 1,056 1,931 2,953 1,144 1,510 683 18,916 1985 713 3,048 1,285 2,214 3,481 912 1,550 670 19,740 1986 700 4,151 1,164 2,248 2,493 654 1,782 555 20,875
'Year ending September 30. zExeludes poultry, 'includes products not listed.
Source: National Food Review, 1987.
Table 8. Share of U.S. Agricultural Imports, by Major Development Category, Selected Years, 1974-86
Year Developed Countries Less-Developed Countries
Centrally-Planned Countries Percent 1974 30 68 2 1977 26 71 3 1980 33 65 2 1983 39 58 3 1986 39 58 3
United States is anxious for recovery of
developmental activity in the Third World. The United States profited from the increased
involvement of developing nations in international markets in the 1970s. With other developed nations the United States has extended economic assistance in the form of debt relief measures and limited, additional credit. However, the United States has not yet adopted a policy of favored status in the purchases of agricultural and other products from foreign suppliers. Perhaps the near future will see some special efforts to help disadvantaged, less-developed nations get back on the track of economic growth.
Source: Foreign Agricultural Trade of the United States. developing nations were achieving economic development. They were increasingly active in worldwide trade and were competing successfully for a larger share of the U.S. market for agricultural imports.
With the worldwide recession of the early 1980s, from which many developing countries have not recovered, productive capability and export
competitiveness declined. Developing countries lost shares of the U.S. market and as a group have not experienced recent recovery of shares.
The kind and extent of assistance to be
extended by the United States and other developed nations to the economically depressed,
less-developed nations has been a subject of debate. The
References
National Food Review; Economic Research Service, USDA; Washington. D.C.; 1987 Yearbook and Fall, 1987.
Foreign Agricultural Trade of the United States;
Economic Research Service, USDA; Washington,
DC.. Selected Years.
World Food Trade and U.S. Agriculture; The World
Food Institute, Iowa State University; Ames,
Iowa; October, 1987.
Assistance to Developing Country Agriculture and U.S. Agricultural Exports; Consortium for
International Cooperation in Higher Education;
Agricultural and Economic
Development in Developing
Nations
The increased significance of the developing nations in international and United States
agricultural trade in the 1970s is reason to examine the economic circumstances of those nations. What happened within the developing nations to cause their emergence as significant contributors to agricultural trade? How important is agriculture and trade to the general economic development of the Third World nations? Will the developing nations be important to U.S. agricultural exports in the future?
Development Within the Third World
Interest in economic development within those countries that comprise the Third World has existed for decades. But it was not until the achievement of independence among former European Colonies, after World War II, that serious efforts toward development were mounted. It was obvious that the underdeveloped nations should express their needs for and interests in economic growth to care for their people and to secure their freedom. But the developed nations also found their interests in economic development among the many poor nations. Assistance with development was the humanitarian thing to do; it promoted political stability and economic security, and it served the interests of developed nations that sought expanded trading relationships.
Developmental theorists of the 1940s and 1950s largely agreed that economic development is accomplished through large-scale investments in capital-intensive industries (Antic, 1987). Agriculture was judged to be a "tradition-bound repository of surplus labor" that could be drawn upon for service in the industrial sectors without loss of productivity in agriculture. It was reasoned by some that
"governments could finance general economic development by taxing agriculture", e.g. by limiting the market for surplus produce to government agencies that prescribed pricing and distribution policies (Ballenger and Mabbs, 1987).
Such developmental policies met with little success. TJiey were inappropriate to the traditions and experience of most under-developed nations. They placed demands on agricultural sectors that could not be satisfied, and they incited little enthusiasm among the people who were affected by-such policies. It finally was realized that agriculture was the traditional and major source of employment and income for people in developing nations. The knowledge and skills of most people were learned
and employed in agriculture. The opportunities for productive, added investments were in agriculture — especially in the early stages of development.
With this understanding, developmental policies and practice were turned around to emphasize expansion of agricultural lands and increased use of appropriate technology. The decades of the 1960s and 1970s saw this change in practice. It was in this period that assistance to developing nations took the changed forms of education in the use of technology and financial assistance in the acquisition of useful equipment and tools. The consequence of investment in agriculture, in most areas of the developing world, was increases in food production as suggested in Table 9. While world food production grew at an annual rate of about 2.4 percent in the 20-year period 1960-64 to 1981-85, the growth in centrally planned economies and developing economies was 2.8 percent and 2.9 percent respectively. The rate of increase in Africa was below that of the world. The rates of increase among other developing economies exceeded that of the world. Interestingly, the growth rate in the developed economies, those associated in the Organization for Economic Cooperation and Development, was only 1.6 percent (Lee and Shane, 1986).
With increased food production in the developing nations there has generally been improvement in the diets of the populace. It has taken the form of increased food intake, and it has involved greater variety of foods within the diets of people. This has been generally accomplished, not by diversification of productive activities, but by specialization in those crops for which resources are well suited (Vocke, 1988). Production of such crops
Table 9. Rates of Increase in Indices of Food and Agricultural Production
Food Agricultural
Production Production
Total Per Capita Total Per Capita
World OECD Centrally Planned Economies Developing Economies Africa Middle East East Asia South Asia Latin America Percent 2.4 0.4 2.3 0.4 1.6 0.7 1.5 0.6 2.8 1.1 2.9 1.2 2.9 0.5 2.8 v 0.4 2.1 -0.6 2.0 -0.6 3.1 0.3 3.1 0.2 3.7 1.3 3.6 1.2 2.6 0.3 2.5 0.2 3.5 0.9 3.1 0.5
Compound annual rates of growth between the average 1960-64 index of production and the end period being the average 1981-85 index of production.
expands to a point that surpluses are produced; surpluses are sold in international markets; and foreign exchange is acquired that can be used for imports of foods not produced within the regions of the developing nations.
The further benefit of increased agricultural productivity is the enhanced ability of farmers and rural residents to purchase needed and desired goods within their countries. Thus there is reason and opportunity for expanded activity in nonagricultural sectors. There are investments in appropriate plant and equipment, and employment is generalized for both urban and rural residents who have been unemployed or underemployed. The national product is increased, personal incomes rise, and development, fired by the agricultural engine, proceeds.
This growth phenomenon has been documented by numerous authors and for many of the
developing nations. Paarlberg, in a review of several studies of development, noted:
" . . . rapid agricultural development can stimulate broad-based economic grow th and eventually the industrial development, usually necessary to turn loose pent-up demands for dietary enrichment. The paradoxical result can be that local food consumption may grow even faster than local food production, and the net farm imports of agriculturally successful developing countries can then actually increase. to the presumed benefit of U.S. farmers" (Paarlberg, 1986).
Vocke, in one of the "Issues in Agricultural Policy" publications of the Economic Research Service, concurs with Paarlberg's conclusion:
"Most developing countries are primarily agricultural. Thus the best way to raise incomes is to help improve agricultural productivity Rising incomes transform a latent demand for better diets into real purchasing power. The effective demand for food generally outruns domestic production because few developing countries have sufficient resources to expand output enough to keep up with a rapidly expanding
economy" (Vocke, 1987).
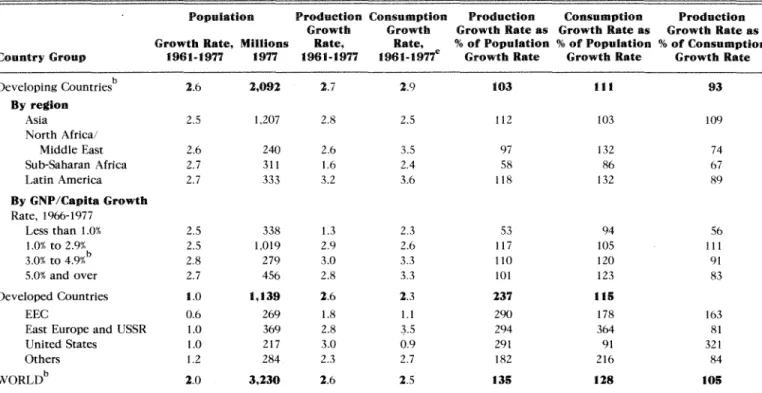
While these are generally accepted statements about agricultural and economic growth and the impacts on income, consumption and imports, differences among countries and regions should be noted. In an often-quoted study of development. Mellor and Johnston found that agricultural production growth rates, and production growth rates as a percent of population growth rates were higher for developing countries in Asia and Latin America (Table 10). In the African regions, especially Sub-Saharan Africa, production growth rates were lower than population growth rates in 1961-77, and have continued to be so.
Food consumption in developing countries grew at 111 percent of the population growth rate (Table
10). However this improvement in per capita consumption came only partially from increased domestic food production. Net imports were significant to increased consumption. The data of Table 11 show net imports for the developing countries in the four regions. Growth rates for imports exceeded those for exports for the 1961-65 to 1969-73 period. (Countries with the slowest rates of income (GNP) growth, largely in Sub-Saharan Africa, had such poor agricultural growth records that per capita consumption fell in spite of high growth rates in imports (Mellor and Johnston, 1984).
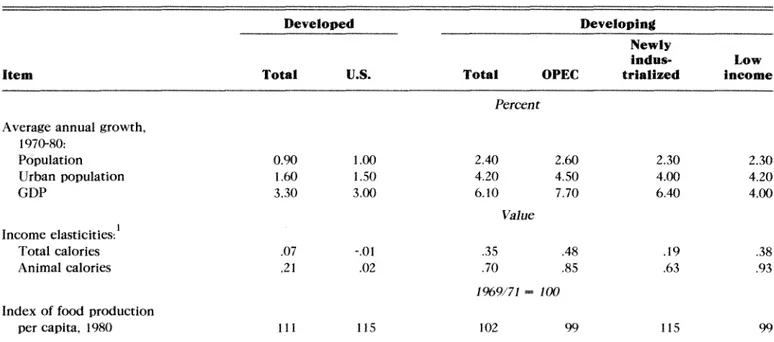
Webb, Sharpies, Holland and Paarlberg summarized the relationships noted above with identification of factors affecting growth in import demand for three classes of developing nations (Table 12). Population growth is usually the key-factor influencing food needs of a country or region, but the rate at which needs are translated into demand depends on the availability of income to produce food. Income (GDP) growth rates among the three classes of developing nations differed widely in the 1970s. Because of oil exports income growth was high among the OPEC nations, but even the low income countries had an average growth rate of 4 percent.
The level of income is a major determinant of consumer food purchases. In Table 12 income elasticities are a measure of the responsiveness of consumer purchases of food to a change in income. Doubling per capita income would increase the demand for food (measured by calories) by 38 percent in low-income countries. 19 percent in newly industrialized countries and only 7 percent in
developed nations. Income growth in developing countries is an essential objective. It allows dietary-improvement and thus significant increases in the general welfare of the population.
Finally, growth in agricultural productivity affects demand for imports. In the 1970s developing countries lagged behind developed countries in agricultural productivity . Only newly industrialized countries were able to increase food production at a rate approaching the growth in demand. The developing nations could not keep pace with food demand growth. The significance of this generally-found relationship is that the stimulus to income growth of agricultural development is enough to create a heightened effective demand for food. Where agricultural productivity increases slowly, imports are required.
Agricultural Development
and U.S.
Exports
Agricultural and economic development in the developing nations has been important to the United States — to the exports of grains, oilseeds and other
Table 10. Growth Rates of Populations, Staple Food Production and Consumption in Developing and Developed Countries, 1961-1977
Population Production Consumption Production Consumption Production Growth Growth Growth Rate as Growth Rate as Growth Rate as Growth Rate, Millions Rate, Rate,
1961-1977 % of Population % of Population % of Consumption Country Group 1961-1977 1977 1961-1977 1961-1977 Rate, Growth Rate Growth Rate Growth Rate
Developing Countries 2.6 2,092 2.7 2.9 103 111 93 By region Asia 2.5 1,207 2.8 2.5 112 103 109 North Africa / Middle East 2.6 240 2.6 3.5 97 132 74 Sub-Saharan Africa 2.7 311 1.6 2.4 58 86 67 Latin America 2.7 333 3.2 3.6 118 132 89 By GNP/Caplta Growth Rate, 1966-1977 Less than 1.0* 2.5 338 1.3 2.3 53 94 56 1.0* to 2.9% 2.5 1,019 2.9 2.6 117 105 111 3.0% to 4,9%b 2.8 279 3.0 3.3 110 120 91 5.0% and over 2.7 456 2.8 3.3 101 123 83 Developed Countries 1.0 1,139 2.6 2.3 237 11S EEC 0.6 269 1.8 1.1 290 178 163
East Europe and USSR 1.0 369 2.8 3.5 294 364 81
United States 1.0 217 3.0 0.9 291 91 321
Others 1.2 284 2.3 2.7 182 216 84
WORLD 2.0 3.230 2.6 2.5 135 128 10S
*As used here, "basic staple foods" include cereals, roots and tubers, pulses, groundnuts, and bananas and plantains; based on FAO data, these commodities ac-counted for about three-fourths of the average per capita intake in developing countries (about three-fifths, for the world as a whole) during 1973-1977. The data are analyzed only through 1977 because the consumption data were available only through that date as of the writing of the paper.
bChina, with a population of approximately one billion, is excluded from this table because the major disruptions occasioned by the Great Leap Forward in the
early 1960s and the subsequent slow recovery make 1961-1977 a particularly biased period for the People's Republic of China. See footnote 2 for a discussion of trends for China.
'Because of the nature of available data sets the consumption growth rate is calculated between the 1961-1965 and 1973-1977 averages. Source: Mellor and Johnston; 1984.
Table 11. Net Imports and Growth Rates for Imports and Exports, Food Staples. Developing Countries, 1961-1965, 1973-1977 and Projections* of Net Imports to 2000
Annual Growth Rate
1961-1965 to
Net Imports 1969-1973
Country Group 1961-1965 1973-1977 2000 Exports Imports
Million Tons Percent
Developing Countries 5.3 23.0 80.3 2.1 5.4 By Region Asiab 6.3 10.9 -17.9 2.5 3.5 North Africa / Middle East 3.6 10.6 57.3 -2.0 7.3 Sub-Saharan Africa -0.9 2.9 35.5 -4.6 7.1 Latin America -3.7 -1.4 5.4 3.6 6.9 By GNP Per Capita Growth Rate Less t h a n 1.0% 1.6 8.0 39.5 -5.1 7.7 1.0% to 2.9% 2.8 -1.1 -48.5 1.8 3.3 3.0% to 4.9% 1.7 4.0 24.1 4.8 5.5 5.0* and over 4.7 12.1 65.2 2.9 6.6
"The projections are based on differences between extrapolations of 1961-1977 country trend production and the aggregate projections of demand for food, animal feed, and other uses; projections of demand for animal feed were assumed to follow the country growth rates of meat consumption, i.e. no change in feeding efficiency. A basis for such adaptation is being pursued at the International Food Policy Research In-stitute but the results are not yet available.
basic commodities. Data in Table 13, that also are displayed in Figure 3, reinforce the earlier-noted significance of developing countries as importers of agricultural products. While the largest export markets for food, feed grains and oilseeds during the
1970s (measured in metric tons) were the industrial
countries, primarily the European Community and Japan, other developing nations became the most significant markets in the 1980s. Exports to industrial countries declined in the first half of the 1980s; sales and shipments to China and the Soviet Union continued to be quite variable; while exports to the
Table 12. Factors Affecting the Growth in Food Demand in Developed and Developing Countries
Developed Developing Newly
Indus- Low Item Total U.S. Total OPEC trialized
Percent
Average annual growth, 1970-80: Population Urban population GDP Income elasticities-.' Total calories Animal calories Index of food production
per capita, 1980 0.90 1.60 3.30 .07 .21 111 1.00 1.50 3.00 -.01 .02 115 2.40 4.20 6.10 Value .35 .70 2.60 4.50 7.70 .48 .85 1969/71 = 100 102 99 2.30 4.00 6.40 .19 .63 115 2.30 4.20 4.00 .38 .93 99 'These elasticities, while dated, provide an indication of the relative magnitude of the difference in food demand response to income changes
across countries.
Sources: Webb, Sharpies, Holland and Paarlberg; 1984.
Table 13. U.S. Exports of Agricultural Commodities, 1970-85 Total Food Grains, Coarse Grains and Oilseeds
Destination Developing
Countries Centrally China USSR Industrial Countries World Thousands of Wheat Equivalent Metric Tons
1970 19,798 1,656 0 0 43,073 64,527 1971 19,884 2,971 0 271 38,918 61,773 1972 22,193 11,842 1,069 7,728 44,930 78,966 1973 28,856 23,460 4,910 14,746 53,422 105,737 1974 33,946 10,637 3,885 3,574 48,449 93,032 1975 34,043 11,813 0 8,081 53,101 98,957 1976 33,383 19,745 0 13,690 61,836 114,963 1977 36,978 12,908 291 8,551 60,327 110,213 1978 46,307 26,515 3,367 15,862 61,574 134,3% 1979 45,261 39,513 5,185 22,554 60,059 144,832 1980 57,269 29,182 9,048 6,966 65,648 152,100 1981 56,337 28,577 8,435 10,337 64,989 149,902 1982 52,491 27,540 8,748 13,342 67,265 147,2% 1983 66,683 16,616 3,946 8,931 59,304 142,603 1984 62,806 26,002 3,875 19,352 51,307 140,116 1985 48,554 19,020 804 16,208 43,740 111,314
developing countries increased by almost 39 percent — to 1985. At mid-decade trade with all classes of nations declined and only recently has it begun to recover. It is the expectation of most analysts that recovery will continue, with appropriate national and international policies and actions, and that developing nations will regain their status as the most significant importers of U.S. agricultural products.
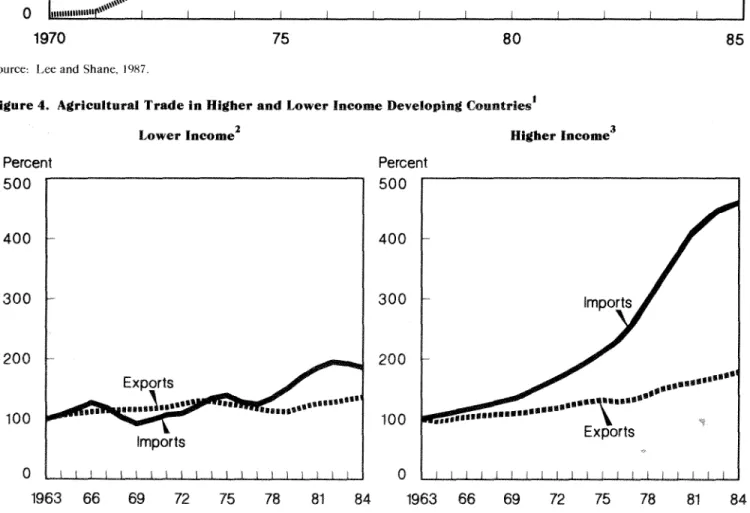
But just as there has been difference among developing nations in agricultural productivity, economic growth, and income (GDP) increases, so will there be differences in their importance as importers of U.S. agricultural commodities. Because incomes are so important to imports, Vocke has classified and identified developing nations by income levels and documented the differences among them in terms of their exports and imports (Figure 4). The lower income nations increased imports, especially in the late 1970s and early 1980s, but not to the extent that the higher income nations did. Export levels, as a percent of 1961-63 average, were similar, but those nations with higher rates of growth and higher incomes increased imports by about 250 percent in the 1975-84 period (Vocke,
1987).
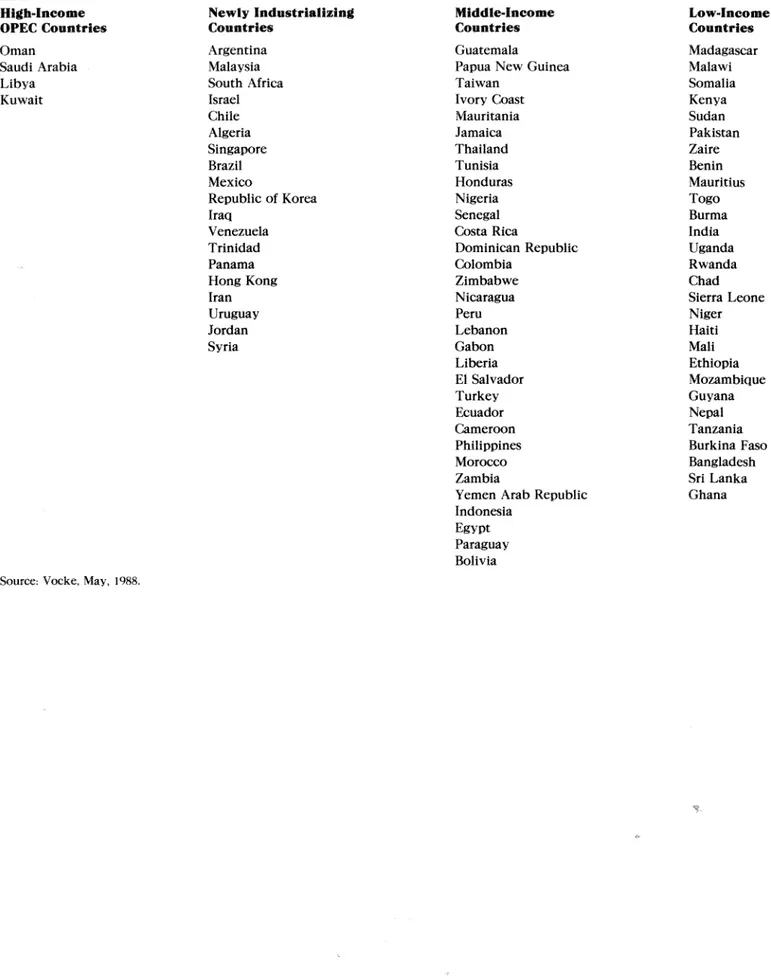
Helpful to the understanding of low income, high income, newly industrializing and OPEC countries is a list of countries developed by Vocke (Figure 5). Descriptions of these classes, excluding the OPEC countries, follows:
"Low-income countries: Although most low-income countries have rising productivity, their economies have not grown enough to bring them toward industrialization and higher incomes. These countries do not have the purchasing power to participate in world trade and are trending slightly toward self-sufficiency." "Middle-income countries: Diets in middle-income countries are beginning to include more animal and wheat products, which is opening the door to feed and food grain imports as demand outpaces production. These countries are trending away from self-sufficiency and can continue growth in imports as their economies industrialize and incomes rise."
"Newly industrializing countries: These countries are no longer self-sufficient in grains and have been growth markets for the past two decades. Rapidly rising demand for meat and wheat products overwhelmed production so much that these countries shifted from net exporters of grain to net importers. These markets can continue growing as debt problems are eased and as developed countries import more products from the newly industrializing countries." (Vocke, 1987)
Suggested by the classification, and the reference to levels of imports of U.S. agricultural commodities, is the need for development of different and relevant export policies and strategies — to match the import capabilities of developing nations — and the
requirement for varied and appropriate kinds of assistance to developing countries — who may be or may become customers.
References
John M. Antle. "Third World Economic Development and Its Consequences for
Agriculture," U.S. Agriculture and Third World
Economic Development: Critical
Interdependency; the National Planning Association; Washington, D.C.; 1987. John Lee and Mathew Shane. "United States
Agricultural Interests and Growth in the Developing Economies: The Critical Linkage,"
U.S. Agriculture and Third World Economic Development: Critical Interdependency; the
National Planning Association; Washington, D.C.; 1987.
Nicole Ballenger and Carl Mabbs-Zeno.
"Government Intervention in Agriculture: The Case of Developing Countries," World
Agriculture: Situation and Outlook Report
Economic Research Service, USDA; Washington, D.C.; September, 1987.
Gary Vocke. U.S. Grain Imports by Developing Countries; Agricultural Information Bulletin No. 522; Economic Research Service, USDA;
Washington, D.C.; May, 1988.
Robert L. Paarlberg. "Farm Development in Poor Countries: The Disputed Consequences for U.S. Farm Trade," American Journal of Agricultural Economics, Vol. 68, No. 5; American
Agricultural Economics Association: December, 1986.
John Mellor and Bruce Johnston. "The World Equation: Interrelationships Among Development, Employment and Food
Consumption," Journal of Economic Literature, Vol. XXII; June, 1984.
Alan J. Webb, Jerry Sharpies, Forrest Holland and Phillip Paarlberg. "World Agricultural-Markets and U.S. Farm Policy," Agricultural and Food Policy Review; Ag. Ec. Report No. 530;
Economic Research Service. USDA: Washington, D.C., 1975.
Gary Vocke. Economic Growth, Agricultural Trade, and Development Assistance; Agricultural Information Bulletin No. 509; Economic Research Service, USDA; Washington, D.C.; March, 1987.
Figure 3. United States Agricultural Exports Million metric tons (Wheat equivalent)
Source-. Lee and Shane, 1987.
Figure 4. Agricultural Trade in Higher and Lower Income Developing Countries1
2 3
Lower Income Higher Income
Percent Percent
1 Percentage of 1961-63 average using deflated 3-year averages.
"Includes 59 countries, such as India, Malawi, Burma, Morocco, and Colombia. ^Includes 23 countries, such as Taiwan, Mexico, Brazil, South Korea, and Argentina. Source: Vocke, 1987.
Figure 5. A Classification of Developing Nations, with Identification of Nations Within Classes, 1988 High-Income OPEC Countries Oman Saudi Arabia Libya Kuwait
Source: Vocke, May, 1988.
Newly Industrializing Countries Argentina Malaysia South Africa Israel Chile Algeria Singapore Brazil Mexico Republic of Korea Iraq Venezuela Trinidad Panama Hong Kong Iran Uruguay Jordan Syria Middle-Income Countries Guatemala
Papua New Guinea Taiwan Ivory Coast Mauritania Jamaica Thailand Tunisia Honduras Nigeria Senegal Costa Rica Dominican Republic Colombia Zimbabwe Nicaragua Peru Lebanon Gabon Liberia El Salvador Turkey Ecuador Cameroon Philippines Morocco Zambia
Yemen Arab Republic Indonesia Egypt Paraguay Bolivia Low-Income Countries Madagascar Malawi Somalia Kenya Sudan Pakistan Zaire Benin Mauritius Togo Burma India Uganda Rwanda Chad Sierra Leone Niger Haiti Mali Ethiopia Mozambique Guyana Nepal Tanzania Burkina Faso Bangladesh Sri Lanka Ghana
Issues and Policies: Technical
and Economic Assistance
Edward Schuh, in a paper presented at the annual meeting of the U.S. Feed Grains Council, encouraged the support of agricultural assistance to developing nations by noting the issues, which he summarized in four propositions.
"First, future foreign markets for U.S. agriculture will be in the developing nations, not in other industrialized countries or in the centrally planned countries." Even with liberalized trade, i.e.
significant reduction of trade barriers, markets for U.S. agricultural commodities will be increased little in Japan, the European Community and other developed nations. Their populations are growing only slowly, per capita incomes are high, and their people are well fed. Modest increases in sales are possible, but significant growth in exports is likely only with a new trading relationship with Japan.
"Second, the developing countries will
constitute a growing market for U.S. producers only if they experience significant economic
development." Growing populations are not enough by themselves to create effective demand for food. Also necessary are increasing per capita incomes, large proportions of which are spent on food. The research (previously cited) shows that people in developing nations put considerable emphasis on dietary improvements, substituting meat and cereal grains for rice and other staples that have been life-supporting but not especially appetizing. Often it has been necessary for the developing nations to import food — not only food not locally produced but the quantity of food and feed grains necessary to offset a growing deficiency in these products. A not-unusual phenomenon in the developing nations is food consumption increasing at a faster rate than food production. Thus there has been, and will be, the opportunity for expanded U.S. exports.
"Third, developing their agriculture is the key to economic growth in the developing countries." Much of the population within developing nations is employed in agriculture. Some countries have land and water resources suited to agriculture but underutilized. Increased productivity within agriculture is possible with appropriate capital and technology, and growth within this sector supports development in other industrial sectors. Agriculture is thus the engine that drives development,
providing the increased incomes, the foreign exchange, and other resources necessary to
industrialization and general economic development. "Fourth, raising productivity in agriculture in the developing countries need not, as a general proposition, pose a competitive threat for U.S. producers." Many of the developing nations are located outside the temperate zones of the world,
where the food, feed grains and many livestock are produced. The products for which the developing nations have comparative advantage will be emphasized. They often are those that are not produced in the United States, or they are produced within seasons that are unlike our own. The
agriculture of the developing nations thus is either non-competitive or complementary to our own in many instances. Exceptions are always found. But there is a tendency for increased exports of our principal commodities to nations experiencing economic development and within which there is increased productivity among agricultural
enterprises. Often we have facilitated agricultural development by provision of technical and economic assistance (Schuh, 1986).
So what should be our attitude toward developmental assistance? What should be our policy relative to technical and economic aid to developing nations? Brady, writing about technology transfer policy, suggests some forms of assistance that should and should not be attempted in efforts to facilitate development. Because we have "a comparative advantage in policy dialogue and institution building, and in agricultural technology generation, adaptation, and application" Brady said the United States should do several things to promote development. (Brady, 1988)
1. Promote a country policy environment conducive to broad-based agricultural development. We should encourage those policies that do not distort the production incentives of farmers, but that create a positive environment for growth within the private sector and promote a positive impact on natural resource management.
2. Support cost-reducing (productivity increasing) technology development and transfer in agriculture. Experience tells us that agricultural research can have a high payoff. In application of technology we should give attention to the sustainability of agricultural production practices.
3. Encourage development within the private sector, with particular emphasis on small- and medium-scale enterprises and institutions. We should assist developing nations to improve the efficiency of public and semi-public agricultural (and agri-business) enterprises and to divest themselves of inappropriate or inefficient ones.
4. Utilize the PL 480 program to facilitate development when food aid is appropriate to food security and nutritional needs within low income countries. While food aid can be competitive with locally-produced food supplies, it is possible to use it to strengthen human and institutional resources and thus to enhance the development of the private sector.
Brady also points to some areas of assistance wherein we do not have a clear comparative advantage, and in these areas we should look to others for significant activity.
1. Compete with others in the provision of infrastructure, e.g. buildings and roads. Often developing countries finance buildings, roads, market structures, etc. with loans from other donors. The United States may contribute to the development of infrastructure, e.g. provide training of personnel who will occupy agricultural college campuses or marketing facilities, but that assistance is complementary to that which is given by other developed nations.
2. Contribute to activities which may result in clear disadvantage to U.S. farmers. Brady points out that "it is A.I.D. policy to avoid supporting the production of agricultural commodities for export by developing countries when the commodities would directly compete with exports of similar U.S. agricultural commodities to third world countries and have a significant impact on U.S. exporters." There arc a few cases where programs of assistance have created
competition for U.S. agricultural exporters. The A.I.D. policy demands careful planning of programs of assistance, recognition of potential trade-offs in export of commodities as they are affected by development, and extension of assistance that will provide for
development that is beneficial to developing and developed nations as well.
Today there is need and opportunity for development in most countries of the Third World. The poor in many countries have a continual food deficit problem while the developed nations experience increasing abundance, even surpluses, of food. Our own farm problem will be alleviated by helping others to improve their agriculture, to facilitate economic development and thus to increase incomes, some of which will be used for the import of food. The evidence supports this scenario of development. The data show the developing nations are important to world-wide demands for food. The concensus among those who have critically
examined the questions of technical and economic assistance is that it is in our interest to continue our extension of assistance to agriculture in developing nations.
References
G. Edward Schuh; The World Bank, Economic
Development, and Future Markets for U.S.
Agricultural Exports; presented at the annual meeting, U.S. Feed Grains Council; Minneapolis. MN; August, 1986.
Nyle C. Brady; "The Effect of U.S. Domestic Interests on Technology Transfer Policy,"
American Journal of Agricultural Economics;
Vol. 69, No. 5, the proceedings of the annual meeting; December, 1987.