SKI Report 2004:09
Research
Low Temperature (320°C and 340°C)
Creep Crack Growth in Low Alloy
Reactor Pressure Vessel Steel
Rui Wu
Rolf Sandström
Facredin Seitisleam
February 2004
ISSN 1104–1374 ISRN SKI-R-04/09-SESKI Perspective
Background
During recent years, SKI has supported research work to study the creep and creep crack growth (CCG) behaviour in low alloy reactor pressure vessel steel (ASTM A508 class 2). The main reason for this initiative was observations of creep failure in a number of cold worked pipe bends in conventional power plants at relatively low temperatures (360 oC). These failures have occurred after service lives from 8000 to 100000 hours. The Swedish nuclear power plants are normally operating at temperatures between 280 oC and 320 oC, which are below the limit temperature for design against creep for the above mentioned material.
Purpose of the project
The purpose of the research work, which has been carried out in stages, was to investigate if CCG occurs in a low alloy reactor pressure vessel material below limit temperature, to study the CCG behaviour and to examine the effects of microstructure, chemical composition and temperature on the CCG and creep failure.
In the first study the notch sensitivity of A508 material under constant load conditions was studied at 360 oC. After that a second stage was started in which creep crack growth was studied at 420 and 360 oC.
In the current stage uniaxial creep and creep crack growth tests at 320 oC and 340 oC as well as post test metallography have been carried out using the ASTM A508 class 2 material with simulated coarse grained heat affected zone microstructure.
Results
Based on results of this work it cannot be precluded that no creep cracking will occur in nuclear pressure vessels. The main question, namely if this phenomenon is a long term threat to pressure vessel integrity, remains unanswered.
SKI considers therefore that there is still need for further work in this area to better
understand the low temperature creep and creep crack growth behaviour. For instance, new tests in real welded joints and use of larger specimens will provide necessary and sufficient data for finite element analysis. Furthermore, this will facilitate the study of creep cracking sensitivity and will make the numerical modelling more reliable.
Project Information
SKI´s Project Leader: Konstantinos Xanthopoulos. Project Number: 14.42-991355/98270.
Project Organisation: The Swedish Institute for Metals Research (SIMR) has been managing the project, with Rui Wu as project leader. Prof. Rolf Sandström at SIMR has assisted in the development of the project.
Other advisers to the project have been: Prof. Kjell Pettersson, Matsafe AB Christer Jansson, SwedPower AB
SKI Report 2004:09
Research
Low Temperature (320°C and 340°C)
Creep Crack Growth in Low Alloy
Reactor Pressure Vessel Steel
Rui Wu
Rolf Sandström
Facredin Seitisleam
Swedish Institute for Metals Research
Drottning Kristinas väg 48
SE-114 28 Stockholm
Sweden
February 2004
SKI Project Number XXXXX
This report concerns a study which has been conducted for the Swedish Nuclear Power Inspectorate (SKI). The conclusions and viewpoints presented in the report are those of the author/authors and do not necessarily coincide with those of the SKI.
Abstract
Uni-axial creep and creep crack growth (CCG) tests at 320°C and 340°C as well as post test metallography have been carried out in a low alloy reactor pressure vessel steel (ASTM A508 class 2) having simulated coarse grained heat affected zone microstructure. The CCG behaviour is studied in terms of steady crack growth rate, creep fracture
parameter C*, stress intensity factor and reference stress at given testing conditions. It has been found that CCG does occur at both tested temperatures. The lifetimes for the CCG tests are considerably shorter than those for the uni-axial creep tests. This is more pronounced at longer lifetimes or lower stresses. Increasing temperature from 320°C to 340°C causes a reduction of lifetime by approximately a factor of five and a corresponding increase of steady crack growth rate. For the CCG tests, there are three regions when the crack length is plotted against time. After incubation, the crack grows steadily until it accelerates when rupture is approached. Notable crack growth takes place at later stage of the tests. No creep cavitation is observed and transgranular fracture is dominant for the uni-axial creep specimens. In the CT specimens the cracks propagate intergranularly, independent of temperature and time. Some relations between time to failure, reference stress and steady crack growth rate are found for the CCG tests.
A linear extrapolation based on the stress-time results indicates that the reference stress causing failure due to CCG at a given lifetime of 350,000 hours at 320°C is clearly lower than both yield and tensile strengths, on which the design stress may have based.
Therefore, caution must be taken to prevent premature failure due to low temperature CCG.
Both uni-axial and CCG tests on real welded joint at 320°C, study of creep damage zone at crack tip as well as numerical simulation are recommended for future work.
Keywords Reactor pressure vessel, low alloy steel, heat affected zone, below limit temperature, creep, creep crack growth, intergranular fracture, lifetime assessment
NOMENCLATURE
CCG Creep Crack Growth CT Compact Tension LTCCG Low Temperature CCG
SCGHAZ Simulated Coarse Grained Heat Affected Zone
a, ∆amax Initial crack length respectively maximum accumulated crack length at rupture, mm
∆a Accumulated crack length, mm
as Accumulated crack length at steady stage, mm &a Crack growth rate, also written as da/dt, mm/h
b, n Constant respectively stress index in Norton′s law, &εmin =bσn
B, Bn Thickness respectively net thickness between side grooves of CT specimen, mm
Beq An equivalent term involving B and Bn in eqn. (1b), mm C* Creep fracture parameter, MPa m/h
D0, φ Constants in eqn. (14) E Elastic modulus, GPa
KI Stress intensity factor, MPa m½
m Ratio of the load to cause yield in the cracked section compared to that in the uncracked section. m is defined in eqn. (1a)
P Applied load, N
t, tR Time respectively time to rupture, hour
tin, tst, tac Crack incubation time, time for steady crack growth, and time for crack acceleration, respectively, hour
tT Transition time, hour
V0, V Initial voltage at t=0 respectively output voltage at time t W Width of CT specimen, mm
Y0 Half distance between the output voltage leads, Y0≈ 5 mm α′, α Empirically determined constants in eqn. (4)
∆δ, δmax Load line displacement respectively maximum load line displacement at rupture, mm
ε, εR Creep strain respectively strain at rupture, % &min
ε Uni-axial minimum creep strain rate, also written as dε/dtmin, 1/h η′, η Empirically determined constants in eqn. (2)
σ, σref Stress respectively reference stress, MPa c
V& Load line displacement rate due to creep, mm/h ξ′, ξ Empirically determined constants in eqn. (7) ν′, ν Constant respectively stress index in eqn. (15)
Ψ Coefficient in eqn. (16). ψ takes 3 for the plane stress and 150 for the plane strain.
Table of contents
1. INTRODUCTION... 4
2. MATERIAL AND EXPERIMENTS ... 4
2.1 Material... 4
2.2 Simulation... 5
2.3 Hot tensile tests... 5
2.4 Uni-axial and compact tension (CT) specimens... 5
2.5 Creep and CCG tests ... 5
TABLE 3 CT SPECIMEN GEOMETRY, REFERENCE STRESS AND APPLIED LOAD... 6
2.6 Post test metallography... 6
3. RESULTS ... 7
3.1 Uni-axial creep tests ... 7
3.2 Creep crack growth (CCG) tests... 8
3.3 Post test metallography... 21
4. DISCUSSIONS ... 22
4.1 Uni-axial creep and creep crack growth tests... 22
4.2 ASME E-1457 standard and its restrictions ... 23
4.3 Creep crack growth behaviour ... 24
4.4 C*, KI and σref ... 24
5. LIFETIME ASSESSMENT, EXPLOITATION AND RECOMMENDATION TO THE SWEDISH NUCLEAR INDUSTRY... 26
6. FUTURE WORK ... 27
7. CONCLUSIONS... 28 ACKNOWLEDGEMENT
4
-1. Introduction
Failures due to low temperature creep crack growth (LTCCG) have been reported world-wide. They occur after service lives from 8,000 to 100,000 hours in conventional fossil fired power plants at moderately high temperatures [1-5]. Investigations showed that crack growth had taken place a long period of time before failure. The mechanism of cracking is identified as being creep [2].
The LTCCG problem was attacked in Sweden at the end of 1980s [5, 6]. In the middle of 1990s the Swedish Nuclear Power Inspectorate (SKI) financed a research project to study the creep and creep crack growth (CCG) behaviour in an ASTM A508 low alloy reactor pressure vessel steel with two chemical compositions and simulated heat affected zone (HAZ) microstructures at 360°C – 420°C. The results [7] show that 1) CCG does occur in the given material at temperatures down to 360°C, 2) shorter lifetimes are found in the CCG tests in comparison to the uni-axial tests, 3) for the CCG tests the lifetime in the simulated coarse grained microstructure of the heat affected zone (HAZ) across a
weldment (SCGHAZ) is shorter than that in the parent metal, and 4) intergranular (brittle) rupture dominates in the SCGHAZ.
Question arises whether there is CCG at even lower temperatures than 360°C since this steel and its weldment are usually operating at temperatures of approximately 290-320°C. At such low temperatures, which are far below the limit temperature for design against creep for this steel, design stresses in power generating application are traditionally based on tensile properties, and creep is generally considered to be of little importance [8]. Not only the shortest lifetime but also brittle failure was observed in the SCGHAZ,
indicating that SCGHAZ is a weak link. Therefore, additional studies on the coarse grained HAZ are needed. There are two ways to produce the coarse grained HAZ; by welding and by simulating. Advantages of simulating are to i) give distinguished welding parameter, ii) reduce scatter in testing results caused by inhomogeneities in real weldment, and iii) increase the degree of homogeneity which facilitates the study of CCG and damage development as well as numerical simulation. However, effects of microstructural
discontinuity, local property gradient and welding residual stresses can not be considered. By simulating the microstructure found in the coarse grained HAZ of ASTM A508 low alloy reactor pressure vessel steel, this project aims at i) studying creep and CCG behaviour at 320°C and 340°C, ii) investigating creep damage, and iii) performing data comparison and analysis.
2. Material and experiments
2.1 Material
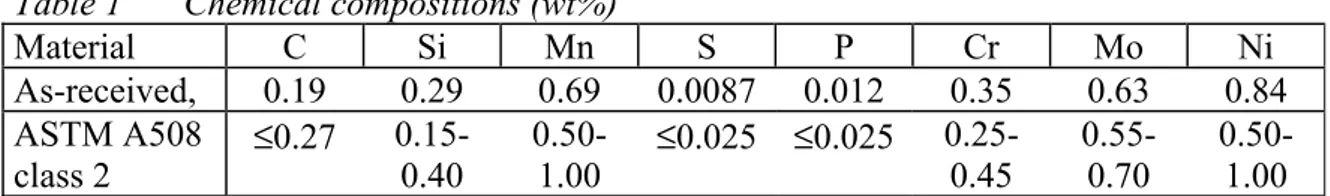
A low alloy reactor pressure vessel steel (ASTM A508 class 2) in the form of bar was used. The as-received material is bainite and ferrite. Hardness (HA10) and the grain size are 185 and 20.8 µm, respectively. The chemical compositions, together with chemical requirements of ASTM [8], are shown in Table 1.
Table 1 Chemical compositions (wt%) Material C Si Mn S P Cr Mo Ni As-received, 0.19 0.29 0.69 0.0087 0.012 0.35 0.63 0.84 ASTM A508 class 2 ≤0.27 0.15-0.40 0.50-1.00 ≤0.025 ≤0.025 0.25-0.45 0.55-0.70 0.50-1.00
2.2 Simulation
To simulate the CGHAZ microstructure across a weldment, the as-received material was heat treated at 1150°C/30 minutes, cooled in boiling water, tempered at 640°C/2 hours, followed by furnace cooling. After heat treatment, the microstructure is composed of tempered martensite. Hardness (HV10) and grain size are 429.4 and 144 µm, respectively.
2.3 Hot tensile tests
Hot tensile tests at 320°C and 340°C were performed in the simulated CGHAZ microstructure at a deformation velocity of 0.0001/s. The results are given in Table 2.
Table 2 Hot tensile testing results
Temperature, °C Yield stress, MPa Tensile stress, MPa Elongation at rupture, % Reduction of area at rupture, % 320 614 756 17.7 340 614 751 17.5 46.7
2.4 Uni-axial and compact tension (CT) specimens
Two series of uni-axial creep specimens were longitudinally taken from the bar. The specimens are cylindrical with threaded ends with 5 mm diameter and 50 mm gauge length.
Two series of standard CT specimens were extracted. The geometry of the CT specimens is shown in Fig. 3 of [7]. The spark machined notch has a root radius of 0.15 mm. The notch is oriented along the transverse section of the bar, which allows the crack to grow in the radius direction. The side grooves promote uniform crack extension across the
thickness of the specimen.
After machining, the geometry of each CT specimen was measured and is given in Table 3, together with testing temperature, reference stress and applied last.
2.5 Creep and CCG tests
By using single specimen, constant load creep testing machines the uni-axial creep specimens were tested at 320°C and 340°C.
The CCG tests by means of the CT specimens follow fully the instructions described in the standard ASTM E 1457 [9]. The tests were conducted in a dead-weight lever creep test rig equipped for CCG testing. The direct current potential drop method was used to monitor
6
-crack progress and a purpose-built extensometer was used to measure load line displacement (LLD).
All the creep and crack growth tests were carried out in air and progressed to final rupture. The PD output and the LLD for the CCG tests, the creep strain for the uni-axial creep tests as well as temperatures were recorded periodically by a logger. The maximum temperature variations with time were controlled within ±2°C of the testing temperatures.
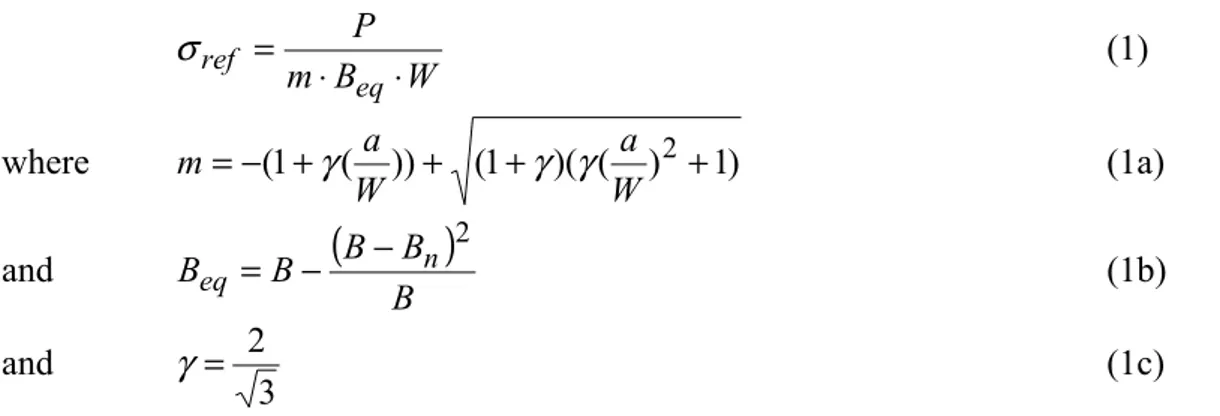
The reference stress for CCG tests, σref in MPa listed in Table 2, is calculated according to
W B m P eq ref = ⋅ ⋅ σ (1) where =−(1+ ( ))+ (1+ )( ( )2+1) W a W a m γ γ γ (1a) and
(
)
B B B B Beq = − − n 2 (1b) and 3 2 = γ (1c)where P is the load in N and Bn the net thickness between the side grooves in mm. The choice of m is based on the assumption of plane stress condition.
Table 3 CT specimen geometry, reference stress and applied load
Specimen Temp (°C) W (mm) (mm)Bn (mm)Beq a (mm) W-a (mm) (MPa)σref Load (N) CT320-1 320 24.99 9.97 12.01 11.28 13.72 620 20521 CT320-2 24.89 9.99 11.98 11.24 13.65 670 21993 CT320-3 24.94 10.02 12.01 11.19 13.75 710 23717 CT340-4 340 24.95 10.30 12.01 11.25 13.70 555 18357 CT340-1 24.93 9.99 11.98 11.22 13.72 600 19885 CT340-2 24.94 9.99 11.97 11.22 13.72 650 21528 CT340-3 24.92 10.01 12.02 11.21 13.72 700 23283
2.6 Post test metallography
Uni-axial creep and CT specimens were metallographically examined using light optical microscope (LOM). The mid-thickness of the specimens which is perpendicular to the fracture were sectioned, ground and polished to 1 µm before etched in 4% nital.
Fractography was performed on CT specimens using scanning electron microscopy (SEM). Prior to examination, the fracture was ultrasonically cleaned.
After failure, the maximum accumulated crack growth length at rupture ∆amax on the CT specimens was measured using stereo microscope having an accuracy of 0.001 mm.
3. Results
3.1 Uni-axial creep tests
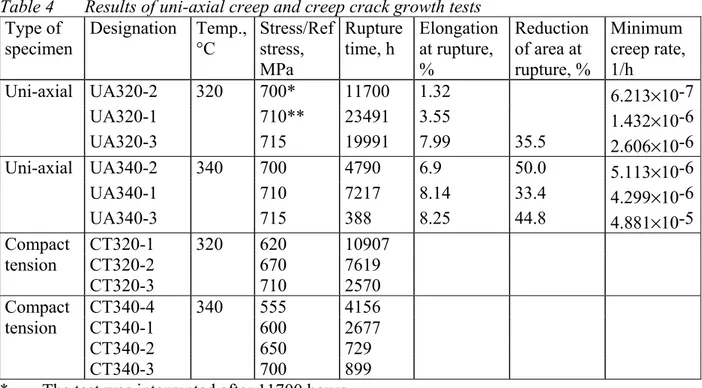
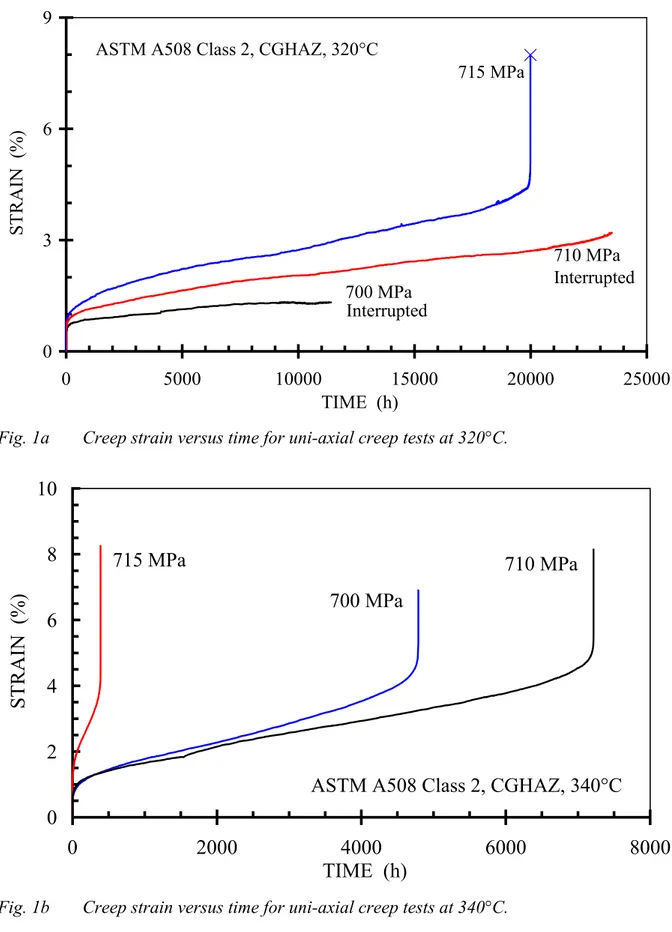
Uni-axial creep testing results at 320°C and 340°C are given in Table 4. Creep curves at 320°C and 340°C are shown in Fig. 1a and Fig. 1b, respectively. Time to failure tR versus stress σ, tR versus elongation and reduction of area at rupture, as well as minimum creep rate &εmin versus σ are given in Figs. 2, 3 and 4, respectively. From Fig. 1 it can be seen that creep curves show insignificant primary creep, dominant secondary creep and
pronounced tertiary creep. tR is sensitive to both temperature and stress, e.g. as temperature is reduced from 340°C to 320°C, time to rupture increases from 388 hours to 19991 hours at 715 MPa, see Table 4 and Fig. 2. Elongation at rupture is about 8%, insensitive to temperature and time, see Fig. 3. Reduction of area at rupture decreases slightly with increasing time, see also Fig. 3. In the double logarithmic scales tR increases linearly with decreasing σ and this relation can be described as
η σ η′ − = R t (2)
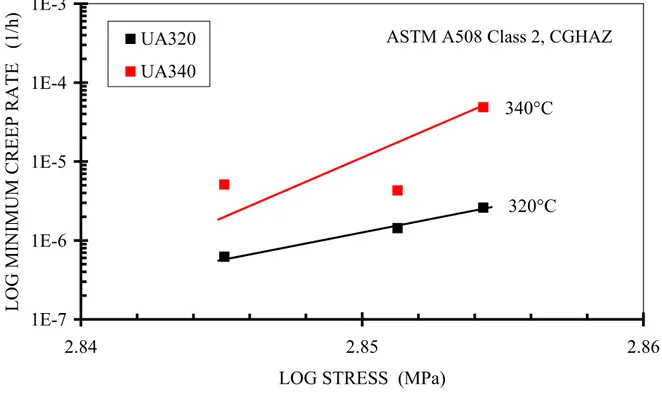
where η′ and η are empirically determined constants and η is about 97. &εmin decreases with decreasing σ, see Fig. 4. &εmin-σ follows Norton′s law
n
bσ
ε&min = (3)
where b is constant and n the stress exponent. n is 66 at 320°C and 89 at 340°C.
Table 4 Results of uni-axial creep and creep crack growth tests
Type of specimen Designation Temp., °C Stress/Ref stress, MPa Rupture time, h Elongation at rupture, % Reduction of area at rupture, % Minimum creep rate, 1/h Uni-axial UA320-2 320 700* 11700 1.32 6.213×10⁻⁷ UA320-1 710** 23491 3.55 1.432×10⁻⁶ UA320-3 715 19991 7.99 35.5 2.606×10⁻⁶ Uni-axial UA340-2 340 700 4790 6.9 50.0 5.113×10⁻⁶ UA340-1 710 7217 8.14 33.4 4.299×10⁻⁶ UA340-3 715 388 8.25 44.8 4.881×10⁻⁵ Compact CT320-1 320 620 10907 tension CT320-2 670 7619 CT320-3 710 2570 Compact CT340-4 340 555 4156 tension CT340-1 600 2677 CT340-2 650 729 CT340-3 700 899
* The test was interrupted after 11700 hours. ** The test was interrupted after 23491 hours.
8 -0 3 6 9 0 5000 10000 15000 20000 25000 TIME (h) STRAIN (%)
ASTM A508 Class 2, CGHAZ, 320°C
710 MPa Interrupted 700 MPa
715 MPa
Interrupted
Fig. 1a Creep strain versus time for uni-axial creep tests at 320°C.
0
2
4
6
8
10
0
2000
4000
6000
8000
TIME (h)
STRAIN
(%)
715 MPa
700 MPa
710 MPa
ASTM A508 Class 2, CGHAZ, 340°C
Fig. 1b Creep strain versus time for uni-axial creep tests at 340°C.
3.2 Creep crack growth (CCG) tests
CCG testing results at given reference stresses σref are presented in Table 4. tR versus σref is shown in Table 4 and Fig. 2. It can be seen from Fig. 2 that
1. CCG does occur at tested temperatures.
2. tR increases linearly with decreasing σref at a given temperature.
3. a temperature from 320°C to 340°C reduces tR by about a factor of five.
4. CCG lives are significantly shorter than the uni-axial creep ones at lower stresses.
2.7 2.8 2.9
100 1000 10000 100000
TIME TO RUPTURE (h)
LOG (STRESS or REFERENCE STRESS)
(MPa)
UA320 CCG320 UA340 CCG340
ASTM A508 Class 2, simulated CGHAZ
CCG 340°C
CCG 320°C
UA 320°C + 340°C
( ) ( )
Fig. 2 Log stress or reference stress versus time to rupture for uni-axial (UA) and CCG tests at both 320°C and 340°C. Results in brackets mean interrupted tests.
0 2 4 6 8 10 100 1000 10000 100000 TIME TO RUPTURE (h) ELONGATION AT RUPTURE (%) 0 20 40 60 REDUCTION OF AREA AT RUPTURE (%) UA320 E UA340 E UA320 RoA UA340 RoA
ASTM A508 Class 2 simulated
( ) ( )
Fig. 3 Elongation (red marks) and reduction of area at rupture(blue marks) versus time to rupture for uni-axial tests. Results in brackets mean interrupted tests.
10 -1E-7 1E-6 1E-5 1E-4 1E-3 2.84 2.85 2.86
LOG STRESS (MPa)
LOG MINIMUM CREEP RATE (1/h)
UA320 UA340
ASTM A508 Class 2, CGHAZ
320°C 340°C
Fig. 4 Min creep strain rate versus log stress for uni-axial tests.
tR and σref obey also eqn. (2) α σ α′ − = ( ref) R t (4)
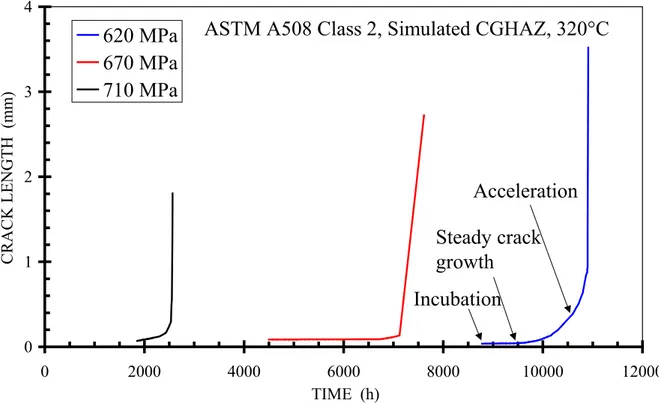
where α′ and α are empirically determined constants. α is 10.3 at 320°C and 7.4 at 340°C. The accumulated crack length ∆a as a function of time t at given σref is shown in Fig. 5a for the tests at 320°C and in Fig. 5b for the tests at 340°C, respectively. ∆a is calculated according to an analytical solution recommended by the standard ASTM E 1457 [9-11]
(
)
a W a W Y V V W Y W a − = ∆ − − ) 2 cos( ) 2 cosh( cosh cosh 2 cosh cos 2 0 0 1 0 0 1 π π π π (5)where a is the initial crack length in mm with respect to the initial voltage V0 at t = 0, V the output voltage at t and Y0 the half distance between the output voltage leads in mm. The values of W and a are given in Table 3. Y0 is 2.5 mm in the present case.
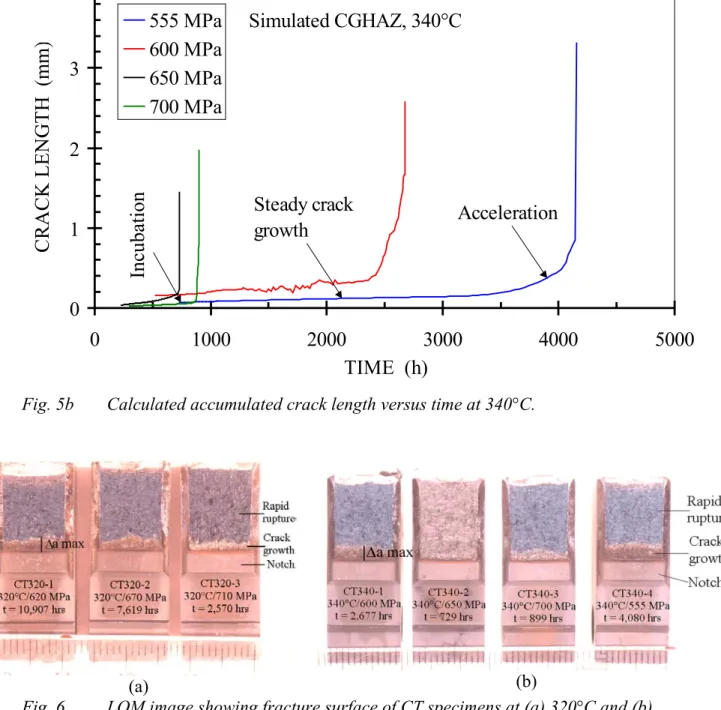
It should be noted that interference from laboratory overall electric system sometimes occurred. This caused an irregular fluctuation in recording output voltage. Manual editing was therefore applied to exclude observable data errors and care was taken to minimise the deviation. The maximum accumulated crack growth length at rupture ∆amax given in Table
5 and Fig. 5 are the measured values. ∆amax was determined by observing fracture surface where the crack growth zone was heavily oxidised and fracture patterns were different in different zones, c.f. Fig. 6.
It can be seen from Fig. 5 that after a long incubation period, in which no apparent crack growth could be observed, the crack propagated steadily before it accelerated to approach the rupture. In the Fig. 5 arrows are given to identify the various regions. Significant crack growth took place at later stage of the tests. ∆amax increases with time. Higher temperature and longer time result in a larger ∆amax.
Table 5 Measured and calculated parameters for CCG tests
Temp., °C Ref stress MPa Measured ∆amax, (mm) tin; (tin/tR) (h); (%) tst; (tst/tR) (h); (%) tac;(tac/tR) (h); (%) δ(mm)max da/dts (mm/h) 320 620 3.520 8780, (80) 700, (6) 1427, (14) 0.33 6.76×10⁻⁶ 670 2.722 4341, (57) 2200, (29) 1078, (14) 0.31 3.86×10⁻⁵ 710 1.803 1741, (68) 39, (2) 790, (30) 0.42 2.67×10⁻⁴ 340 555 3.308 733, (18) 2245, (54) 1178, (28) 0.32 3.42×10⁻⁵ 600 2.575 526, (20) 1367, (51) 784, (29) 0.51 7.28×10⁻⁵ 650 1.445 230, (31) 281, (38) 218, (30) 0.139 1.78×10⁻⁴ 700 1.967 300, (33) 500, (56) 99, (11) 0.43 4.12×10⁻⁴
tin, tst, tac and tR are the incubation time, time for steady crack growth, time for crack
acceleration and time to rupture, respectively. δmax the maximum load line displacement at
rupture. da/dts is the steady crack growth rate.
0 1 2 3 4 0 2000 4000 6000 8000 10000 12000 TIME (h) CRACK LENGTH (mm)
620 MPa
670 MPa
710 MPa
ASTM A508 Class 2, Simulated CGHAZ, 320°C
Incubation
Steady crack
growth
Acceleration
12
-0
1
2
3
4
0
1000
2000
3000
4000
5000
TIME (h)
CRACK LENGTH (mm
)
555 MPa
600 MPa
650 MPa
700 MPa
Simulated CGHAZ, 340°C
Incubation
Steady crack
growth
Acceleration
Fig. 5b Calculated accumulated crack length versus time at 340°C.
(a) (b)
Fig. 6 LOM image showing fracture surface of CT specimens at (a) 320°C and (b) 340°C. The length of ∆amax is schematically shown. Arrow indicates the crack growth direction.
The values of crack incubation time tin, time for steady crack growth tst, time for crack acceleration tac, and their ratios to time to rupture tR are also presented in Table 5 for all the tests. tin was mainly determined by referring to the ratio of V/V0. If V/V0 was in excess of about 1.005 and a continuous and consistent crack growth followed thereafter, which is indicated by the LLD recording, the corresponding duration was considered as tin. tst and tac for each test were decided in accordance with the relevant ∆a-t relation shown in Fig. 5. It is seen from Table 5 that tin and tst dominate at 320°C and 340°C, respectively.
Maximum values of LLD at rupture δmax are less than 0.5 mm in most cases, implying a limited deformation.
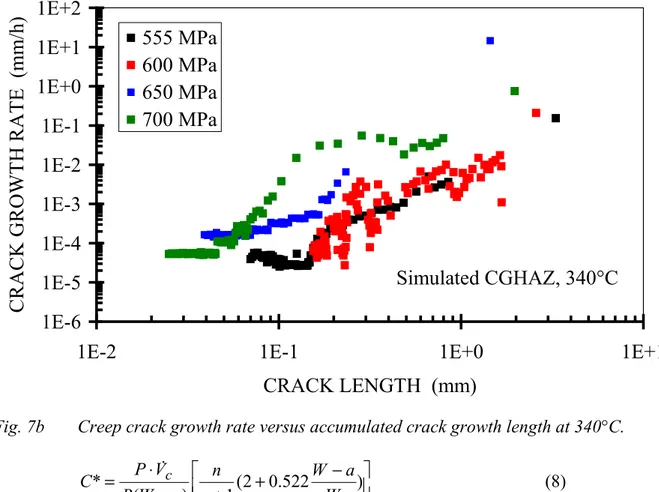
Crack growth rate &a (also written as da/dt) as a function of ∆a is exhibited in Fig. 7a for the tests at 320°C and in Fig. 7b for the tests at 340°C, respectively. &a is simply the slope of a straight line connecting two adjacent data points (∆ai+1 and ∆ai and corresponding time ti+1 and ti) on the ∆a-t curves and can be defined as
i i i i t t a a a − ∆ − ∆ = + + 1 1 & (6)
It is seen from Fig. 7 that &a increases reasonably linearly with increasing ∆a in the double logarithmic diagram at larger ∆a, i.e. ∆a > 0.1 mm. The &a -∆a relations are fairly stress independent at 320°C. At 340°C a higher σref gives a higher &a at the same ∆a.
The &a and ∆a relation in Fig. 7 can be described by ξ
ξ a
a&= ′∆ (7)
where ξ′ and ξ are empirically determined constants. ξ is fairly insensitive to either temperature or stress. For instance, ξ is 2.5 and 2.4 at 320°C and 340°C, respectively. The steady crack growth rate &as (also written as da/dts) is also given in Table 5. Higher σref results in a higher &as. This is the case for all the tests.
&a as a function of creep fracture parameter C* is shown in Fig. 8a for the tests at 320°C and in Fig. 8b for the tests at 340°C, respectively. Although many expressions have been proposed for C* in different test specimen geometries [12], in the case of CT specimen the following expression is well accepted for the estimation of C* [9, 12]
1E-6 1E-5 1E-4 1E-3 1E-2 1E-1 1E+0 1E+1
1E-2 1E-1 1E+0 1E+1
CRACK LENGTH (mm)
CRACK GROWTH RATE (mm/h
)
620 MPa 670 MPa 710 MPa
Simulated CGHAZ, 320°C
14
-1E-6
1E-5
1E-4
1E-3
1E-2
1E-1
1E+0
1E+1
1E+2
1E-2
1E-1
1E+0
1E+1
CRACK LENGTH (mm)
CRACK GROWTH RATE (mm/h)
555 MPa
600 MPa
650 MPa
700 MPa
Simulated CGHAZ, 340°C
Fig. 7b Creep crack growth rate versus accumulated crack growth length at 340°C.
+ − + − ⋅ = (2 0.522 ) 1 ) ( * W a W n n a W B V P C &c (8)
where C* is in MPa m/h, P is the applied load in N, V& the load line displacement rate duec to creep in mm/h, and n the stress index in Norton′s law. V& is calculated as follows [9]c
+ + − = N p c m J E K P B a V
V& & & 2 '2 ( 1) (9)
where V& is the total load line displacement in mm/h. In the present case V& is the same as LLD rate and has been experimentally recorded. &a is the crack growth rate in mm/h, c.f. eqn. (6) and Fig. 7. E′ is equal to E for plane stress and E′ is equal to E/(1 - ν2) for plane strain, where E is the elastic modulus in GPa and ν is the Poissons ratio. K is the stress intensity factor in MPam½. For CT specimens K is defined as
(
1)
( ) 2 2 3 f aW W a W a W B B P K N ⋅ − + ⋅ ⋅ ⋅ = (10) where f(
aW)
=0.866+4.64(
aW)
−13.32(
aW)
2 +14.72(
aW)
3 −5.6(
aW)
4 (10a) The fully-plastic component of the J-integral, Jp, is given as follows1 2 . 0 1 1 455 . 1 )) ( ( ) , ( + ⋅ ⋅ − ⋅ ⋅ ⋅ = m N m p p PB a W m W a h D J β σ (11)
σp0.2 is the yield stress in MPa. β, Φ, D1, m and h1 are the material constants. β and Φ are defined as follows ) 1 ( 2 2 2 + Φ+ − Φ+ Φ = β (11a) ) ( 2 a W a − = Φ (11b)
D1 and m are given in the Ramberg-Osgood stress-strain relation
m p D E + = 2 . 0 1 σσ σ ε (12)
The constant h1 is a function of the ratio a/W and M and is tabulated in [9]. D1 and m can be determined by carrying out tensile test at given temperature, see section 2.3. In the present investigation the constants used in the C* calculations are listed in Table 6.
Table 6 Constants used in the C* calculations. Temp. Norton exponent n h1 E-modulus (GPa) Yield stress Rp0.2 (MPa) D1 m 320°C 66 0.461 116.4 614 0.00429 10.27 340°C 89 0.388 72.37 614 0.0039 11.53
Fig. 8 also includes an empirical expression relating &a and C* [13]
R C a ε ψ ⋅ *0.85 = & (13)
where εR is the uni-axial creep ductility at rupture at relevant temperature. The coefficient ψ is described in [13] and contains a factor that varies with the stress/strain state. ψ is 3 for plane stress and 150 for plane strain. Lines by eqn. (13) are included in Fig. 8 to give an appreciation of the stress state at the crack tip.
It is clear from Fig. 8 that at steady crack growth region where &a is constant, C* increases monotonically. At crack acceleration region C* increases fairly linearly with increasing &a in the double logarithmic scales and this relation takes the form of
φ *) ( 0 C D a&= (14)
16
-where D0 and φ are constants. φ is about 0.8 at 320°C, except for the test at 620 MPa where φ is slightly larger than unity. φ at 340°C ranges from 0.6 to 1. Fig. 8 shows also that in the most cases &a - C* plots lie closer to the plane stress state line than to the plane strain line proposed by eqn. (13)
1E-7
1E-6
1E-5
1E-4
1E-3
1E-2
1E-1
1E+0
1E-9
1E-8
1E-7
1E-6
1E-5
1E-4
1E-3
1E-2
1E-1
C* (MPa m/h)
CRACK GROWTH RATE (mm/h)
620 MPa
670 MPa
710 MPa
Plane stress
Plane strain
Simulated CGHAZ, 320°C
Fig. 8a Creep crack growth rate versus creep fracture parameter C* at 320°C.
1E-6
1E-5
1E-4
1E-3
1E-2
1E-1
1E+0
1E-9
1E-8
1E-7
1E-6
1E-5
1E-4
1E-3
1E-2
C* (MPa m/h)
CRACK GROWTH RATE (mm/h
)
555 MPa
600 MPa
650 MPa
700 MPa
Plane stress
Plane strain
Simulated CGHAZ, 340°C
Using an interactive analysis software package called ZRATE [14] which calculates all pertinent parameters in accordance with ASTM E-1457, stress intensity factor KI and reference stress σref were analysed in terms of &a , see Figs. 9 and 10. Eqns. (1) and (10) are used for calculating σref and KI, respectively.
1E-6
1E-5
1E-4
1E-3
1E-2
1E-1
1E+0
1E+1
1.9
2
2.1
2.2
2.3
LOG(STRESS INTENSITY FACTOR) (MPa m
1/2)
CRACK GROWTH RATE (mm/h)
620 MPa
670 MPa
710 MPa
Simulated CGHAZ, 320°C
Fig. 9a Creep crack growth rate versus logarithmic stress intensity factor at 320°C.
1E-6
1E-5
1E-4
1E-3
1E-2
1E-1
1E+0
1E+1
1.9
2
2.1
2.2
2.3
LOG(STRESS INTENSITY FACTOR) (MPa m
1/2)
CRACK GROWTH RATE (mm/h)
555 MPa
600 MPa
650 MPa
700 MPa
Simulated CGHAZ, 340°C
18
-1E-6
1E-5
1E-4
1E-3
1E-2
1E-1
1E+0
1E+1
2.8
2.9
3
3.1
3.2
LOG(REFERENCE STRESS) (MPa)
CRACK GROWTH RATE (mm/h
)
620 MPa
670 MPa
710 MPa
Simulated CGHAZ, 320°C
Fig. 10a Creep crack growth rate versus logarithmic reference stress at 320°C.
1E-5
1E-4
1E-3
1E-2
1E-1
1E+0
1E+1
2.8
2.9
3
3.1
3.2
LOG(REFERENCE STRESS) (MPa)
CRACK GROWTH RATE (mm/h
)
555 MPa
600 MPa
650 MPa
700 MPa
Simulated CGHAZ, 340°C
Fig. 10b Creep crack growth rate versus logarithmic reference stress at 340°C.
From Figs. 9 and 10 it is apparent that there is a typical incubation period indicated by the sharp ‘tails’ where KI and σref are nearly constant as &a increases continuously. As soon as
failure occurs. Larger initial σref causes higher KI and σref at the same &a . KI and σref at rupture seem to be sensitive to time to rupture tR, but insensitive to temperature, see Fig. 11. The longer the tR, the higher the Kc and σref at rupture.
110
120
130
140
150
160
0
3000
6000
9000
12000
TIME TO RUPTURE (h)STRESS INTENSITY AT RUPTURE (MPa m
0.5 )
750
850
950
1050
1150
1250
REFERENCE STRESS AT RUPTRE (MPa) CT320, Kc CT340, Kc CT320, sref CT340, srefASTM A508 Class 2, Simulated CGHAZ
Fig. 11 Critical stress intensity factor (red marks) and reference stress at rupture (blue marks) versus time to rupture for all the tests.
Relations between steady crack growth rate &as (da/dts), σref and tR are found. &as-σref relation is shown in Fig. 12 for all CCG tests. It is seen that &as is higher at higher temperature at the same σref. In the double logarithmic scales &as decrease linearly with decreasing σref. This power-law relation is analogue to the Norton’s law for the uni-axial creep behaviour ν σ ν ( ref) s a& = ′ (15)
where ν′and ν are constant and stress index, respectively. The value of ν is 27 at 320°C and 11 at 340°C, respectively
&as is plotted against tR in Fig. 13 for all CCG tests. In Fig. 13 also includes uni-axial creep results where tR is plotted against the minimum creep strain rate &εmin. It should be
mentioned that &as and &εmin have different units. In the double logarithmic scales the &as -tR and &εmin-tR relations are reasonably linear (noting that there is only one uni-axial creep data point available at 320°C). For the CCG series, &as-tR relation is temperature
20 -relation for the uni-axial creep tests can be expressed as
1E-6 1E-5 1E-4 1E-3
2.7 2.8 2.9
LOG(REFERENCE STRESS) (MPa)
STEADY CRACK GROWTH RATE
(mm/h) CCG320 CCG340 27 11 Simulated CGHAZ
Fig. 12 Steady crack growth rate versus reference stress for all CCG tests.
1E-6 1E-5 1E-4 1E-3 100 1000 10000 100000 TIME TO RUPTURE (h)
STEADY CRACK GROWTH RATE (mm/h) or MIN STRAIN RATE (1/h)
CCG320 CCG340 UA320 UA340 1.1
ASTM A508, Class 2, CGHAZ 0.8
2.3
Fig. 13 Steady crack growth rate for the CCG tests (black marks) and minimum creep strain rate for the uni-axial tests (red marks) versus time to rupture.
CCG R
s t C
UA
R C
t UA =
⋅ β
ε&min (16b)
where CCCG, CUA, βCCG and βUA are constants. βUA is 0.8. βCCG is 1.1 at 340°C and 2.3 at 320°C, respectively.
3.3 Post test metallography
For the uni-axial creep specimens necking appeared prior to the rupture. Rupture mode is transgranular, see Fig. 14. No creep damage was observed. This is the case regardless of temperature and time.
(a) 100X (b) 50X
Fig. 14 LOM images from uni-axial creep specimens. (a) 320°C/715 MPa/19991 hours. (b) 340°C/710 MPa/7217 hours. Transgranular fracture. No creep damage.
(a) 50X (b) 100X
Fig. 15 LOM images from CT specimens. (a) 320°C/620 MPa/10907 hours. (b) 340°C/555 MPa/4156 hours. Intergranular crack growth.
The cracks propagated intergranularly on the CT specimens, independent of temperature and time, see Fig. 15. Deformation close to the crack was hardly seen. Fractography examination shows also intergranular crack growth, characterised by rock pattern on the
22
-fracture surface, see Fig. 16. In the final -fracture zone, the -fracture mode is transgranular, decorated by dimples, see Fig. 16(b).
(a) (b)
Fig. 16 SEM images from CT specimens. (a) 320°C/620 MPa/10907 hours. (b) 340°C/555 MPa/4156 hours.
4. Discussions
4.1 Uni-axial creep and creep crack growth tests
The time to rupture tR for CCG tests is considerably shorter than that for uni-axial tests at the same temperature at lower stresses, see Fig. 2. This difference increases with increasing time. Increasing temperature from 320°C to 340°C resulted in a shorter time to rupture tR,
c.f. also Fig. 2 and a higher crack growth rate at the same reference stress σref for the CCG tests, c.f. Fig. 12, or a higher minimum creep strain rate at the same stress for the uni-axial creep test, c.f. Fig. 4. Creep ductility in terms of elongation at rupture for the uni-axial creep tests is about 8% independent of both temperature and time to rupture.
No creep cavitation is visible and transgranular fracture is observed for the uni-axial creep tests regardless of temperature and time to rupture, see Fig. 14. This is in agreement with previous studies [6, 7]. Clearly, failure in the uni-axial creep tests is controlled by locally excessive plastic deformation leading to plastic collapse. For the CCG tests there is an apparent crack growth and the cracks propagate intergranularly, see Figs. 6, 15 and 16. It seems that longer time to rupture facilitates the crack growth. The longer the time to rupture, the longer the crack. The intergranular crack growth has been previously reported in [3, 7, 15]. Gooch [3] stated that for ferrite-pearlite structure in C-Mn steel the favoured paths for crack propagation are along ferrite-ferrite and ferrite-pearlite boundaries.
It can be demonstrated that creep crack growth, rather than creep cavitation, is the mechanism limiting the service performance of low alloy C-Mn steel below the limit temperature subjected to stress. Therefore, understanding the creep behaviour in terms of small crack growth is essential in both conventional and nuclear power plants.
4.2 ASME E-1457 standard and its restrictions
The ASME standard E-1457 is used in many creep crack growth tests and it is also adapted in the present study to provide a guideline for the experimental set-up, test procedure, calculations of various parameters, and evaluations of results. The E-1457 was firstly published in 1992 and recently revised to establish the influence of creep crack growth on the life of components subjected to sustained loading at elevated temperature. It is noted that the E-1457 is still in progress and there are some restrictions in using it.
Transition time tT: In the E-1457 restrictions are imposed to determine when extensive creep has been reached. This depends on the relative amounts of elastic, plastic and creep deformation incurred at the crack tip. It has been demonstrated [16] for a material
undergoing secondary creep that a steady state creep stress distribution is achieved after a transition time tT given by
* ) 1 ( 2 C E n K tT I ⋅ ⋅ + = (17)
where E is the elastic modulus. In the E-1457 all the data collected at times t < tT are considered as invalid. Since KI and C* vary with time and crack length, the procedure specifies that tT should be evaluated at all times and its maximum value should be chosen in order to be conservative. It can however be argued that a steady state creep stress distribution is achieved at a crack tip at an earlier time first when t = tT has been satisfied so that more data can be included. In the present case, a rough estimation of tT by setting KI = 120, n = 66, E = 180, and C* = 1×10⁻⁵ shows that tT is quite small, i.e. about 120 hours. Many data points can therefore be regarded as valid in the present analyses, see Figs. 8-10.
Ratio of the creep to total deformation: Creep-brittle/ductile fracture conditions is defined by the magnitude of the creep zone expansion rate relative to the crack growth rate [12]. When the ratio of creep deformation rate V& to total deformation rate C V&Tis small, a steady state creep condition has not been reached at a crack tip. The E-1457 specifies that V& /C V&T should be greater than 0.8 as a validity criterion for creep-ductile situation.
Crack extension: To obtain a correlation of creep crack growth rate with C*, it is necessary to achieve a steady state distribution of creep damage ahead of a crack tip as well as a steady sate creep stress distribution [12]. The creep damage gradually builds up from the beginning of a test. This is a cause of the initial period of very little crack extension, or even a negative crack extension due to PD output signal interference, which is referred to as an incubation period, see Fig. 5, or a ‘pre-tail’. It gives rise to a reduced crack growth rate at low C* early in a test, which is less than that expected after a steady state creep damage distribution has been attained at a crack tip. This ‘pre-tail’ can be avoided by excluding data prior to the onset of a steady state of damage being reached, see Fig. 8. In E-1457 it is implied that this is achieved after a crack extension of 0.5 mm. In the present study, the incubation time is empirically defined as V/V0≈ 1.005. The corresponding crack length at V/V0≈ 1.005 is less than 0.2 mm, see Fig. 5. The use of a s a smaller crack length than 0.5 mm, e.g. 0.2 mm, has been proposed in [17], see also section 3.2.
24
-4.3 Creep crack growth behaviour
Similar to the uni-axial creep curve where creep strain is plotted against time, the crack length increase as a function of time curve has three distinct regions, see Fig. 5. There is an incubation period in which the crack is stationary. After incubation, the crack starts to propagate steadily. The stead crack growth rate, which corresponds to the secondary (minimum) creep strain rate, can be measured. Passing the steady growth region, crack growth becomes unstable, which corresponds to tertiary creep. Crack growth accelerates, leading to rupture. An important aspect concerning the crack growth is that significant crack accumulation takes place in this region, or later stage of tests and it happens quickly. The crack incubation time tin prior to any significant crack advance can occupy a
significant fraction of the total lifetime. In the present investigation, tin takes up more than 50% of total lifetime at 320°C and about 20-30% of total lifetime at 340°C, see Table 5. However, there is a difficulty in accurately defining tin because it refers to blunting of the crack tip. In the ASTM standard [8] tin is translated to the time at which crack has
advanced 0.5 mm from notch. If this definition is adapted in the present case, tin will take up most of the total lifetime and most of the data will be useless, see Fig. 5. To utilise effectively experimental data, a crack extension of 0.2 mm has been discussed [17]. Both calculated tin [12, 18, 19] and empirically determined tin [7, 20] are reported. In the present study, the method of determining tin is the same as that used in [7], see also section 3.2. It is apparent that empirically determined tin depends to a large extend on the accuracy of experimentally recorded values of V and V0. In addition, the choice of V/V0 as the measure of tin must be established.
From Fig. 5 it is seen that the accumulated crack length prior to unstable crack growth in most cases is very small, e.g. less than 1 mm. Such small crack can be easily ignored in site inspection. This rises a warning in estimating life exhaustion governed mainly by creep crack growth process since small crack may accelerate rapidly and failure may appear unexpectedly. This is especially true in structural application where stress concentrations and bending forces occur.
4.4 C*,
K
Iand
σ
refThe analysis of the crack growth data in terms of C* is given in Fig. 8. Apparently, there are two regions, namely the so-called ‘pre-tail’ region near the beginning of the tests and the steady growth region having some scatter. The scatter is larger as the tests enter the steady growth region. The scatter tends to converge at the end of the tests. The scatter can be attributed to the low testing temperature (T/Tm < 0.4, where Tm is the melting
temperature), high applied loads, extensive plasticity upon loading, and limited accumulated crack growth length.
It is more important to be able to extend the applicability of the &a -C* relation which is valid in the CT specimens to the component in engineering structures. Ainsworth [21] has investigated the range of conditions for which different creep parameters like C*, stress
intensity factor and reference stress may be valid and has proposed a non-dimensional crack velocity λ given
0 2 3 0 ε σ λ & & ⋅ ⋅ ⋅ = I K E a (18)
where &a is the crack growth rate, E elastic modulus, KI the elastic stress intensity and &ε0 the uni-axial creep strain rate at the stress σ0. A KI description would be only valid for λ
>> 1 and/or stress index n in the Norton’s law ≤ 3, whereas a C* description is valid for λ
< 1 and higher n values. Many researchers [1, 3, 20, 21] have used this criterion to establish the applicable range of different creep parameters for various materials. The validity of either KI or C* description was demonstrated at a given condition.
Substituting &a in eqn. (18) by steady crack growth rate &as obtained at the highest σref, e.g. &as = 2.67×10⁻⁴ at 320°C and &as = 4.12×10⁻⁴ at 340°C, c.f. Table 5, using &ε0 values obtained at corresponding uni-axial stresses, e.g. &ε0 = 1.432×10⁻⁶ at 320°C and &ε0= 5.113×10⁻⁶ at 340°C, c.f. Table 4, setting E = 116.4 GPa at 320°C and E = 72.37 GPa at 340°C and KI = 120 MPa m½, the values of λ at 320°C and 340°C are 0.0398 and 0.0265, respectively. These λ values are much smaller than unity. Together with a n value being much higher than 3, e.g. n = 66 at 320°C and n = 89 at 340°C, see Fig. 4, the conclusion can be drawn that &a -C* correlation is applicable in the present case to characterise the creep crack growth.
The creep crack growth rates have also been plotted against stress intensity factor KI in Fig. 9 at both tested temperatures. In both cases considerable scatter is obtained despite the limited creep deformation is observed, see the values of the maximum load line
displacement at rupture δmax in Table 5. It suggests that KI may not be a suitable parameter for correlating creep crack growth properties of the material under the conditions examined where the temperatures are too low. This is also the case for the stress intensity at rupture, which increases with increasing time to rupture, see Fig. 11. This observation is opposite to that in [7] for the same material at higher temperatures of 360°C and 420°C. Therefore, it should be cautious to interpret creep crack growth behaviour by means of KI.
From lifetime prediction point of view it is beneficial to apply reference stress method to a cracked component without analysing creep crack growth behaviour. For a defected component at elevated temperatures, the reference stress was originally used as a parameter for applying the life fraction rule for creep life estimations [22]. There are a number of methods of calculating reference stress and stress concentration, which will lead to different values, all of which could be equally valid. The method employed in this study is to use the formulae described in the ASTM E-1457 to calculate the reference stress and stress intensity factor, see eqns. (1) and (10).
It is a common practice to plot the initial reference stress for CT specimens and stress for uni-axial creep specimens against time in the same diagram, c. f. Fig. 2. Actually,
development of the reference stress methods aims at a direct comparison with uni-axial stress. A way of visualising this is to regard the material at the crack tip as consisting of
26
-infinite number of small uni-axial creep test rods [23]. The time causing crack propagating through the first rod due to creep can be roughly compared to the time producing rupture also due to creep for this rod under uni-axial stress state at the same stress/reference stress.
5. Lifetime assessment, exploitation and
recommendation to the Swedish nuclear
industry
The ASME standard E-1457 test method characterises creep crack growth behaviour under conditions of extensive creep deformation in terms of magnitude of a creep fracture
parameter C*. Extensive creep occurs when the entire uncracked ligament region is dominated by creep deformation. In this case, C* can be used to describe the local stress strain fields around a crack tip in a body subjected to creep. The concept of similitude enables the relationship between creep crack growth rate and C* to be utilised in the design and evaluation of engineering structures operated at creep conditions, see Fig. 8. Fig. 8 implies that if the creep ductility at temperature is known, the crack growth rate can be obtained if the C* value is also known. A proper choice of stress conditions will give a more accurate assessment of the crack growth rate. Knowing the crack growth rate, the remaining lifetime can be predicted at given operating conditions by applying eqns. (2) and (3), c.f. Figs. 12 and 2, or by using eqn. (16), c.f. Fig. 13.
Alternatively, an extrapolation based on the reference stress-time to rupture relation shown in Fig. 2 can be easily made to assess the reference stress causing failure at a given lifetime or vice versa at relevant temperatures, see Fig. 17. Fig. 17 is the same as Fig. 2, but
including a linear extrapolation to 350,000 hours service lifetime (approximately 40 years) at 320°C since 350,000 hours and 320°C are the design life and the maximum design temperature, respectively, for the material studied. The extrapolation shows that the reference stress causing failure at 350,000 hours is 448 MPa.
Warning arises since this reference stress is lower than both yield and tensile strengths, which are 614 MPa and 756 MPa at 320°C, respectively, see Table 2. 320°C was thought to be far below the normal limit temperature for design against creep in C-Mn and low alloy steels because the phenomena of low temperature creep crack growth was unknown until about 20 years ago. The normal limit temperature is in the range of 425°C to 500ºC, depending on the composition of the steels. For 20 years ago, therefore, design stress was based on either tensile or yield strength, depending upon the adapted criterion.
No matter what tensile or yield strength is chosen as design stress, it is no longer
conservative or safe since the reference stress causing failure due to low temperature creep crack growth is clearly lower than them.
There is a strong need to reconsider the design criterion for low alloy C-Mn steels operating at temperature ranges originally defined below the limit temperature. Stress causing failure by low temperature creep crack growth must be taken into account, along
with yield strength σp0.2 and tensile strength σm. Therefore, design stress should be written according to factor safety MPa factor safety time ref p design 448 } , min{ 0.2 , = = σ σ σ (19a) factor safety MPa factor safety time ref m design 448 } , min{ , = = σ σ σ (19b)
Apparently, in the present case σref is crucial for low alloy C-Mn steel component designing to 350,00 hours at 320°C. 2.6 2.7 2.8 2.9 100 1000 10000 100000 1000000 TIME TO RUPTURE (h)
LOG STRESS or REFERENCE STRESS,
(MPa) UA320 CCG320 UA340 CCG340 UA 320°C + 340°C CCG 340°C 448 MPa CCG 320°C 40 år
Fig. 17 Same as Fig. 2, but linear extrapolation to 350,000 hours service time is included.
6. Future
work
It should be kept in mind that most structural components experience a three dimensional state of stress resulting from the type of loading and/or from other forms of constraint. Especially, components containing welded joints operating at elevated temperature are subjected to multi-axial stress state caused by residual stress, thermal gradient, dimension change as well as microstructural discontinuity. Multi-axial stress state is more complex than uni-axial stress state which simply comprises tension or compression. Failure
mechanisms, failure modes, rupture time and ductility are found to be affected negatively by the state of multi-axial stress [24-27]. For instance, components under a high state of
28
-multi-axial tension can fail prematurely due to the inhibition of deformation and
enhancement in fracture processes [24]. Conclusively, the assessed lifetime based on the uni-axial results may be not conservative if the multi-axial state of stress is present. There exists a damage region in the creep process zone at the crack tip. The size of the damage region, from several grains to a few millimetres, depends on the material properties like ductility and stress condition. The time necessary for built-up of this
damage region will control the lifetime and rupture process. Theoretical attempts to model this process have been done [12, 28]. However, observation of damage region has rarely been made [28].
Hence, the following works are proposed to better understand the low temperature creep crack growth behaviour
1. to carry out creep and creep crack growth tests in real welded joint below the limit temperature.
2. To carry out interrupted tests to study the creep damage zone built-up and damage evolution as well as to characterise creep damage zone at crack tip.
3. to observe and the creep damage (cavitation and crack) initiation and development in relation to microstructures across a real weld joint.
4. to numerically simulate stress condition affecting creep crack growth and the development of creep damage zone.
7. Conclusions
Uni-axial creep and creep crack growth (CCG) tests at 320°C and 340°C as well as post test metallography have been carried out in a low alloy reactor pressure vessel steel (ASTM A508 class 2) having simulated coarse grained heat affected zone microstructure. The following conclusions can be drawn
1. The CCG does occur at both 320°C and 340°C.
2. The lifetimes for the CCG tests are considerably shorter than those for the uni-axial creep tests at lower stresses. The material is sensitive to cracks and defects.
3. Increasing temperature shortens both creep and CCG lifetimes significantly, e.g. the CCG lifetime is reduced by a factor of five as temperature raises from 320°C to 340°C at given reference stresses. Accordingly, steady crack growth rate is increased.
4. There are three regions when crack length accumulation is plotted against time, namely incubation, steady growth and instability. After incubation, in which crack is inactive, the crack starts to grow steadily. This is followed by unstable crack growth where crack growth accelerates, leading to rupture. Significant crack accumulation takes place at later stage of tests and it happens quickly.
5. No creep cavitation is observed and transgranular fracture is dominant on the uni-axial creep specimens. For the CCG tests, crack propagates intergranularly, regardless of time and temperature.
6. The creep crack growth rate &a is analysed in terms of creep fracture parameter C*, stress intensity factor and reference stress. It seems that &a -C* correlation is
applicable to characterise the creep crack growth.
7. The power-law relations between time to rupture and reference stress, between steady crack growth rate and reference stress (Norton′s law for the uni-axial creep), and between steady crack growth rate and time to rupture (Monkman-Grant
correlation for the uni-axial creep) are found for the CCG tests. These findings propose a potential application in the assessment of lifetime where the creep crack growth dominates.
8. A linear extrapolation based on the reference stress-time results shows that the reference stress causing failure due to CCG at a given lifetime of 350,000 hours at 320°C is clearly lower than both yield and tensile stresses, on which the design stress may have based. Therefore, it is likely that the original design stress is not
conservative or safe.
9. Uni-axial and CCG tests on real welded joints at 320°C, study of creep damage zone at crack tip as well as numerical simulation are recommended for future work.
Acknowledgement
The Swedish Nuclear Power Inspectorate (SKI) is gratefully acknowledged for financial support. Vattenfall Energisystem is thanked for providing test material. The committee members, Xantopolous Konstantinos, SKI, Christer Jansson, Vattenfall Energisystem and Prof. Kjell Pettersson, Matsafe AB, are greatly thanked for their interest, support and comments.
References
[1] Neate, G. J.; ‘Creep crack growth in cold-formed C-Mn steel at 360°C’, Mat. Sci. Tech., Vol. 3, No. 1, (1987), 14-22
[2] Shibli, I. A.; ‘Creep crack growth characteristics of prestrained C-Mn steels at 360°C’, Mat. Sci. and Tech., Vol. 3, No. 2, (1987), 110-117
[3] Gooch, D. J.; ‘The effect of cold work on low temperature (0.35 Tm) creep crack growth in C-Mn steels’, Mat. Sci. Eng. Vol. 64, No. 2, (1984), 183-196
[4] Lee, D. J. and Siverns, M. J.; Paper C98/78, Proc. Conf. Tolerance of flaws in pressurised components, Institution of Mechanical Engineers, London, (1978), 193-203
[5] Sandström, R. and Östberg, G.; ‘Creep failure below the limit temperature’, Swedish Institute For Metals Research, IM-2517, (1989)
30
-[6] Storesund, J., Tada, N. and Sandström, R.; Notch sensitivity of creep failure below the limited temperature, Swedish Institute For Metals Research, IM-2961, (1992) [7] Wu R., Seitisleam F. and Sandström R.; ‘Creep crack growth in low alloy reactor
pressure vessel steel at 360°C - 420°C’, SKI Report 99:6, (1999)
[8] ‘Standard specification for quenched and tempered vacuum-treated carbon and alloyed forgings for pressure vessels’, Designation A508 - 84, Annual Books of ASTM Standards, (1985), 403-411
[9] ‘Standard test method for measurement of creep crack growth rates in metals’, Designation ASTM E-1457-98, draft version, (1998)
[10] Schwalbe, K. H. and Hellman, D. J.; ‘Application of the electrical potential method to crack length measurements using Johnson′s formula’, Testing and Evaluating, Vol. 9, No. 3, (1981), 218-221
[11] Johnson, H. H.; ‘Calibrating the electric potential method for studying slow crack growth’, Materials Research and Standards, Vol. 5, No. 9, Sept., (1962), 442-445 [12] Webster, G. A. and Ainsworth, R. A.; ‘High temperature component life
assessment’, Published by Chapman & Hall, 2-6 Boundary Row, London, ISBN 0 412 58520 0, (1994)
[13] Nikbin K. M., Smith D. J., and Webster G. A., ‘An engineering approach to the prediction of creep crack growth’, Trans. ASME Journal of Engineering Materials Technology, Vol 108, (1986), 186-191
[14] ZRATE, http://mesmsg2.me.ic.ac.uk /public_html/HIDA/, (2002)
[15] Gooch, D. J.; ‘The effect of microstructure on creep crack growth in a C-Mn steel’, Mat. Sci. Eng. Vol. 83, No. 1, (1986), 17-27
[16] Saxena A. and Landes J. D.; ‘Characterisation of creep crack growth in metals’ Advances in fracture research, 6th Int. Conf. On Fracture, Pergamon Press, (1984), 3977-3988
[17] ‘Creep crack growth of C-Mn steels at 320°C-400°C’, Final report, Brite/Euram Project, BE7463, (1998), unpublished results
[18] Riedel, H. and Rice, J. R.; ‘Tensile cracks in creeping solids’, Fracture Mechanics 12 Conf. ASTM STP No. 700, (1980), 112-130
[19] Ainsworth, R. A. and Coleman, M. C.; ‘Example of an application of an assessment procedure for defects in plant operating in the creep range’, Fatigue Fract. Eng. Mat. Struct., Vol. 10, No. 2, (1987), 129-140
[20] Shibli, I. A.; ‘Low temperature (360°C) creep crack growth characteristics of C-Mn steel’, Mat. Sci. Eng., Vol. A104, (1988), 29-35
[21] Ainsworth, R. A.; ‘Some observations on creep crack growth’, Int. J. of Fracture, Vol. 20, No. 2, (1982), 147-159
[22] Williams J. A. and Price A. T.; ‘A description of crack growth from defects under creep conditions’, J. of Eng. Mat. and Techn., Trans ASME, (1975), 214-222 [23] Andersson H. C. M. and Seitisleam F.; ‘Creep crack growth in new and aged 253
MA and AISI 310’, Swedish Institute for Metals Research, IM-2003-xxx, (2003) [24] Dyson B. F. and Loveday M. S.; ‘Creep fracture in Nimonic 80A under triaxial
tensile stressing’, Proc. Conf. Creep in Structure, TUTAM symposium, Pergamon Press, Oxford, (1981), 406-421
[25] Hayhurst D. R. and Webster G. A.; ‘An overview on studies of stress state effects during creep of circumferentially notched bars’, Techniques for Multi-axial Creep Testing, Eds Gooch D. J. and How I. M., Elsevier Applied Science, (1986)
[26] Al-Faddagh K. D., Webster G. A. and Dyson B. F.; ‘The influence of stress on the creep failure of 2.25Cr1Mo steel’, Mechnical Behaviour of Materials IV, Eds Carlsson J. and Ohlson N. G, Oxford, (1984), 289-295
[27] Wu R. and Seitisleam F.; ‘Creep behaviour of a 12%CrMoV steel under multi-axial stress state at 600°C’, Swedish Institute for Metals Research, IM-2001-001, (2001) [28] Andersson, H C M, R Sandström, R, ‘Creep crack growth in service-exposed weld
S T A T E N S K Ä R N K R A F T I N S P E K T I O N
Swedish Nuclear Power Inspectorate
POST/POSTAL ADDRESS SE-106 58 Stockholm BESÖK/OFFICEKlarabergsviadukten 90 TELEFON/TELEPHONE +46 (0)8 698 84 00 TELEFAX +46 (0)8 661 90 86
E-POST/E-MAIL ski@ski.se WEBBPLATS/WEB SITEwww.ski.se