Report number: 2011:06 ISSN: 2000-0456 Available at www.stralsakerhetsmyndigheten.se
Reliability Data Handbook for Piping
Components in Nordic Nuclear Power
Plants – R Book, Phase 2
2011:06
Authors: Vidar Hedtjärn Swaling Anders Olsson
SSM perspective Background
The Nordic PSA Group (NPSAG) has undertaken to develop a piping reliability parameter handbook for use in risk-informed applications that involve the consideration of structural integrity of piping systems. The scope of the handbook is to establish high quality reliability parameters that account for the Nordic and worldwide service experience with safety-related and non-safety-safety-related piping systems in a consistent and realistic manner. The report aims to demonstrate the complete workaround pro-cess including modeling approaches.
While the work to develop the handbook was finalised at the beginning of 2010, the planning for its preparation has been underway for fifteen years. An important step towards the handbook development project was the SKI SLAP (SKI LOCA Affected Pipes) database work. This research project started in 1994 and the very first goals was to investigate possibilities for deriving pipe failure rates and rupture probabilities from service expe-rience with piping components in commercial nuclear power plants, as an alternative to probabilistic fracture mechanics.
The SLAP database was handed over to the OECD Nuclear Energy Agency in late 90-ies when the international cooperative effort through the OECD begun to maintain and further develop the event database (called OPDE) which have provided the necessary input to the work with the Re-liability Data Handbook for Piping Components in Nordic Nuclear Power Plants (the R-Book).
The first phase of the R-Book project in 2003 was initiated by the stake-holders when it was evident that LOCA frequencies are treated in a non-consistent manner between Nordic NPP utilities.
Objectives
The Swedish Radiation Safety Authority (SSM) strives in its research acti-vities within the research field ”Safety Analysis” to establish harmonized guidance documents within the nuclear industry, for a variety of analyses and applications. This report represents such a guide and this report des-cribes a harmonized method to estimate piping reliability parameters and present them in a handbook for use in risk-informed applications.
Results
An important step towards the handbook development project has been the international cooperative effort through the OECD Nuclear Energy Agency to create an event database (OPDE) on the service experience with piping in commercial nuclear power plants; an event database, which provides the necessary input to the work with the NPSAG handbook. This first version of the R-Book comprises rupture frequencies and failure rates for all systems where ASME Code Class 1 or 2 events could be found
in the OPDE database. Nordic and Non-Nordic data are presented separa-tely. Worldwide experience data is used to set up the relevant calculation cases, i.e. intersections of attributes for which there are at least one event present. This ”data driven” strategy also implies that there are fewer zero-point cases analysed for the larger Non-Nordic plant population than for the smaller Nordic population. The advantage of this strategy is that no possible events are disregarded just because they are ”hidden” in the comparably small Nordic population.
The report provides further directions and a good basis for risk-informed decision making. The outcome of the project together with the outcome of several other NPSAG projects forms an excellent base for risk-informed principles of enforcement strategies and systematic safety work.
Needs for further research
The guidance document is new and therefore its applicability should be tested and evaluated in real applications.
Project information
Project leader at SSM: Ralph Nyman Project number: SSM 2008/227, 1086-01
References to other similar research projects and/or reports:
Since mid of the 90-ies a significant number of SSM (earlier SKI) research reports as well as conference papers have been published about e.g., col-lection of piping reliability data, quality assurance of piping reliability data, methods development. In this section some of the SSM reports are listed. All these reports can be downloaded from the homepage of SSM at www.stralsakerhetsmyndigheten.se
SSM Report 2008:1, Reliability Data for Piping Components in Nordic Nuclear Power Plants “R-Book” Project Phase I, Anders Olsson and Bengt Lydell, January 2008.
SKI Report 1995:58, Reliability of Piping System Components.
Volume 1: Piping Reliability – A Resource Document for PSA Applications. SKI Report 1995:59, Reliability of Piping System Components.
Volume 2: Review of Methods for LOCA Frequency Assessment. SKI Report 1995:60, Reliability of Piping System Components. Volume 3: A Bibliography of Technical Reports and Papers Related to Piping Reliability.
SKI Report 1995:61, Reliability of Piping System Components. Volume 4: The Pipe Failure Event Database.
SKI Report 1996:20, Piping Failures in United States Nuclear Power Plants: 1961-1995.
SKI Report 1996:24, An Overview of Stress Corrosion in Nuclear Reactors from the Late 1950s to the 1990s.
SKI Report 1996:39, Failure Frequencies and Probabilities Applicable to BWR and PWR Piping.
SKI Report 1997:26, Reliability of Piping System Components. SKI Report 1998:30, Failure Rates in Barsebäck-1 Reactor Coolant Pressure Boundary Piping.
2011:06
Authors: Vidar Hedtjärn Swaling and Anders Olsson Scandpower AB, Stockholm, Sweden
Date: February 2011
Report number: 2011:06 ISSN: 2000-0456 Available at www.stralsakerhetsmyndigheten.se
Reliability Data Handbook for Piping
Components in Nordic Nuclear Power
Plants – R Book, Phase 2
This report concerns a study which has been conducted for the Swedish Radiation Safety Authority, SSM. The conclusions and view-points presented in the report are those of the author/authors and do not necessarily coincide with those of the SSM.
TABLE OF CONTENT
1. EXECUTIVE SUMMARY ... 2
2. INTRODUCTION ... 3
3. MODELLING APPROACH – THE BASIC IDEA ... 5
3.1 BREAK FLOW THRESHOLDS ... 6
4. DATA PROCESSING ROUTINE ... 8
4.1 THE PROCESSING ROUTINE STEP BY STEP ... 8
4.1.1 Extracting Data from OPDE Light ... 8
4.1.2 Plant Population Data – Defining the Exposure Term ... 8
4.1.3 Qualitative Analysis ... 9
4.1.4 Definition and Set Up of Calculation Cases ... 9
4.1.5 Presentation and Interpretation of Results ... 10
4.2 EXPERIENCES WITH THE IDENTIFICATION OF RELEVANT DEGRADATION MECHANISMS ... 11
4.2.1 The Original “Top‐Down” Strategy ... 11 4.2.2 A Change of Perspective ... 12 4.2.3 Criteria for Screening out an Event ... 13 4.3 REVISED SCOPE ... 13 5. EXAMPLE OF RESULTS ... 15 5.1 RESULTS FOR RCS SYSTEM IN PWR ... 15 6. OUTLINE OF R‐BOOK – SUB‐REPORTS ... 21 7. REFERENCES ... 22 SSM 2011:06 1
1. EXECUTIVE SUMMARY
This report presents results of a long research and development pro-ject financed by the regulatory body Strålsäkerhetsmyndigheten (SSM) (former SKI), the Swedish nuclear power plant licensees. The report presents a harmonized method for estimating Reliability Data for Piping Components in ASME code class 1 and 2 piping components (R-Book). Data in the R-Book is measured based on "data driven" strategy.
This first version of the R-Book comprises rupture frequencies and failure rates for all systems where ASME Code Class 1 or 2 events could be found in the OECD OPDE database. Nordic and Non-Nordic data are presented separately. Worldwide experience data is used to set up the relevant calculation cases, i.e. intersections of attributes for which there are at least one event present.
I denna rapport redovisas resultat från ett långvarigt forsknings- och utvecklingsprojekt som finansierats av Strålsäkerhetsmyndigheten (SSM) och de svenska tillståndshavarna för kärnkraftverk. Rapporten presenterar en harmoniserad metod för att uppskatta tillförlitlighets-data på rörkomponenter som tillhör ASME code klass 1 och 2. Denna första version av Tillförlitlighetsdata rörande brottfrekvenser och felsannolikheter på rörkomponenter tillhörande ASME code klass 1 och 2, baserar sig på händelser som finns i OECD OPDE databa-sen. Nordiska och icke-nordiska data presenterar var för sig i R-Boken. Den världsomfattande erfarenhetsdata som finns i OPDE an-vänds för att definiera relevanta beräkningsfall t.ex. koppling till hän-delser som det finns minst en rapporterad händelse på. Data i R-Boken är baserad på en data influerad strategi.
2. INTRODUCTION
The Nordic PSA Group (NPSAG) has undertaken to develop a piping reliability parameter handbook for use in risk-informed applications that involve the consideration of structural integrity of piping systems. The scope of the hand book is to establish hig h quality reliability pa-rameters that account for the Nordi c and Worldwide service experi-ence with safety-related and non-safety-related piping systems in a consistent and realistic manner.
While the work to devel op the handbook was finalised at the begin-ning of 2010, the planbegin-ning for its pr eparation has been underway for well over ten years. An important step towards the handbo ok devel-opment project was the international cooperative effort thr ough the OECD Nuclear Energy Agency to create an event database (OPDE) on service experience with pipin g in commercial nucle ar power plants; an event databa se, which provides the necessary input to the work with the Reliabilit y Data Handbook for Piping Comp onents in Nordic Nuclear Power Plants (the R-Book).
Before the actual R-Book develop ment work started in 2008 a pilo t project was carried out. The aim of the pilot project was to define the content and outline of the proposed handbook. The pilot project is summarized in SKI Report 2008:01 [1] (January 2008, avail able from
www.ssm.se). The report provides detailed inf ormation about tech-nical considerations for how to deri ve realistic pipe failure rates from the available service experience dat a, together with the requirements defined for R-Book.
At the beginning of the R-Book project the scope was to cover all pip-ing that is r epresented in the OPDE database, thereby formpip-ing the basis for any leak frequ ency originating from in side and outside the containment i.e. Loss of Coolant Ac cident (LOCA), flooding and High Energy Line Break (HELB frequencies). A revis ed primary scope has however been necessary in order to shorten the turnaround time. The revised scope implies that Code Class 1 and 2 components are pri-marily analyzed. This re striction does not mean that Code Class 3, 4 and non-code is of no importance, but that prio rity is given to compo-nents with the greatest need for ne w updated data, i.e. compocompo-nents that are like ly to contribute to LOCA frequencies. The co mponents that are primarily excluded from R-Book failure data for these compo-nents can be derived from the EPRI study [7]. It should be stressed though, that EPRI is based on US data and might have less validit y for the Nordic situation.
This first version of R-Book comprises rupture frequencies and failure rates for all systems where ASME Code Class 1 or 2 events could be found in the OPDE dat abase. Nordic and No n-Nordic data are pre-sented separately. Worldwide experience data is used to set up th e relevant calculation cases, i.e. intersections of attributes f or which there are at least one event present. This "data driven" strategy also implies that there are fewer "zero-point" cases analyzed for the larger
Non-Nordic plant population than f or the smaller Nordic p opulation. The advantage of this strategy is that no "hidden" events are disre-garded. Thus, a fund amental statement is t hat OPDE comprises enough data for any theoretically p ossible event to appear, irrespec-tive of pipe size.
The database version used in the R-Book project is OPDE Light 2007:2.
3. Modelling approach – the basic
idea
A simple model of piping reliability components makes use of nuclear power plant reliability models originally developed to investigate alter-native inspection strategies for dif ferent piping systems. The model takes advantage of the presence of a precursor event, i.e. rupture (R) is preceded by failure ( F). Equation (1) is a r epresentation of this model:
Mi k x ik ik ikx P R F 1 } {
(1) Where:ikx = Rupture frequency of piping compo nent i due
to damage mechanism k for failure mode x. ik = Failure rate of piping component i due to
damage mechanism k. In general, a point es-timate of this frequency is g iven by the num-ber of failure events divided by the product of the total e xposure time over which failur e events were collected (normally expressed in Reactor Critical Years) and the component population that provided the observed failures. Pik{Rx|F} = Conditional probability of “rupture” mode x
given failure for pipe component i and dam-age mechanism k.
Mi = Number of different damage mechanisms for
component i.
The term “failure” implies any degraded state r equiring remedial ac-tion: from part through-wall crack, pinhole leak, leak, large leak to a significant, incapacitating structural failure. Types of remedial action s include repair (temporary or perma nent), in-kind replacement or re-placement using new, more resistant material.
A Bayesian approach is used to develop uncertainty distrib utions for the parameters in equation (1). The term ik is assessed by updating
a slightly informative prior with failure events retrieved from the OPDE database. The conditional probability of structural failure P ik{Rx|F} is
represented by a Beta distribution with parameters A and B interpret-ed as:
A: The number of structural failures of a certain kind i.e. ruptures. B: The number of degraded conditio ns, i.e. defects that did not result in ruptures.
Firstly, a po int estimate of Pik{Rx|F} is based on expert jud gment. A
technical basis for defining prior Beta distributio n parameter is docu-mented in references [ 2, 3]. The c hosen A-prior and B-prior are an-chored in the current “state-of-knowledge” about degradation mecha-nisms, mitigation and inspection practices, and field experience. The B parameter is derived i n a straightforward manner once A-prior and a mean have been defined:
B = (A/mean) – A (2)
Secondly assuming a binomial likelihood and associating ruptures (R) with the A parameter and failures that did n ot result in structural failure (F - R) with the B parameter (i.e. “ successes”) the posterior parameters are analytically derived:
Apost= A + R (3)
Bpost = B + (F – R) (4)
3.1 Break Flow Thresholds
In order to distinguish between break sizes in different p ipe dimen-sions it is necessary to define break flow thresholds. The break flow is mainly a function of pipe/break size and syste m pressure. Since R-Book will focus on Nordic nuclear p ower plants, a mapping has been performed regarding different break flow limits that has been used in different PSA:s.
Since a lea k can give r ise to several break flo ws it is necessary to convert each threshold to an equiv alent piping diameter in order to exclude piping that are t oo small related to a certain break flow cate-gory. The conversion is made using the Moody break flow model, see e.g. [4].
Using equations (5) and (6) below t he threshold diameter can be cal-culated according to equation (7).
FR = G*A (5) A = *D2/4 (6) D = [4*FR/(G*)]1/2 (7) Using 7 MPa for BWR and 15,5 MPa for PWR G-values of approxi-mately 39500 kg/m2,s (BWR) and 53000 kg/m2,s (PWR) are obtained.
This will give the corresponding threshold diameters as described i n Table 1.
Table 1: Break flow thresholds and their corresponding diameters Threshold Flow Rate (FR) BWR Diameter PWR Diameter
>5 kg/s >13 mm >11 mm
>20 kg/s >25 mm >22 mm
>100 kg/s >57 mm >49 mm
>400 kg/s >114 mm >98 mm
4. DATA PROCESSING ROUTINE
The most challenging “ executive” work behind R-Book ha s been to sort and categorize the vast amount of OPDE d ata properly in orde r to get meaningful and useful output, i.e. freque ncies that are easily interpreted and implemented by the PSA analyst.
Hence, besides distinguishing between different damage/d egradation mechanisms for BWR and PWR, OPDE data are subdivided by the following attributes:
Nordic/Non-Nordic
ASME Code Class 1-2 (BWR [5] and PWR [6])
Component type (welds bends, T-joints and base metal). Material; SS (Stainless Steel) or CS (Carbon Steel).
Pipe size; since the rupture frequencies distingu ish between possible flow r ates, it is n ecessary to record the piping diameter for each component.
4.1 The Processing Routine Step By Step
This section addresses the necessary steps in the R-Book routine, which starts by e xtracting raw data f rom the databases available and ends up with calculations and presentation of the results obtained. 4.1.1 Extracting Data from OPDE Light
The first step of R-Book routine is to extract data from the event database, i.e. OPDE. F or each system the database is filt ered with respect to p lant type (BWR or PW R), Completeness Index1 (CI 3 is
discarded) and the relevant degradation mechanisms. Queries are then defined to interse ct the resulting tables with respect to pipe dimensions, piping components and material, counting the failures in each intersection. In p rinciple a set of calculation cases are to be defined for each combination of degradation mechanism and component type.
4.1.2 Plant Population Data – Defining the Exposure Term
The exposure term (the denominator of the failure rate point estimate) is composed of the number of ite ms observed and their time “in operation”. This term is input to th e Poisson process updating the prior (using the R-DAT Plus analysis tool). The relevant informatio n should be found in any database comprising a complete picture of the components of a certain populatio n. In R-Boo k, the information on Non-Nordic plants is obtained from the PIPExp2 database. The Nordic
1 Completeness Index (CI) 1 to 3 used in OPDE is described in the OPDE Coding Guideline [8] where CI 1 and 2 means that the failure record data has been validated but for CI 2 some non-critical information might be missing, CI 3 means that the validation still is ongoing.
2 PIPExp: Scandpower proprietary - OPDE “parent database”
populations are mapped separately and solely for the purp ose of R-Book.
4.1.3 Qualitative Analysis
At an early stage a qualitative exa mination of the service experience history is carried out. The aim is to e xamine the level of homogeneity of the background data, i.e. if there are any ob vious biases (e.g. with respect to time). Seco ndly a first review of the query results is performed. The focus is on e liminating ambiguous classification and to sharpen the bound aries between stated categories. It is also decided whether the b asis for statistical analysis is sufficient, e.g. if information on the complete component population is available for the events at issue.
4.1.4 Definition and Set Up of Calculation Cases
The most critical stage of the data processing routine is the definition and set up of calculation cases. Th e task comprises several pitfalls that will be discussed separately (see Section 0 and 0). However, the basics are as follows:
a. Matching of susceptibility vs. actual observations: The case definition should be based upon some kind of information on which degradation mechanisms are relevant to a certain system as well as an examination of the relations between degradation mechanisms and component types.
This “matching routin e” aims at answering the following crucia l questions:
Are all observed events valid? Basically this is a question of whether or not a calculation ca se should be defined for each and every observed event. T he natural objection is that there might b e combinations of degradation mechanism, code class, component type, material and dimension that are h ighly unlikely (or even logica lly impossible) due to water chemistry, mitigation programs etc. This in turn implies that the co rresponding events, if any, should be screened out or reclassified.
Does the empirical situation reflect what is in fact possible? This question is a sked to avoid the erroneous conclusion that the pre sent events are the on ly possible ones. Whenever any “hidden” event is considered possible a calculation case should be def ined (and t he update carried out for zero failures).
b. Compiling the empirical input: After having defined the cases, the complete set of failur es for the solving of equation (1) has to be composed. These are:
The failures that, toget her with th e exposure term, are used to update the failure rate prior distribution.
The input t o the upda ting of the (Beta) dist ribution of conditional probability of structural failure. This is, for each flow rate threshold, matching the relevant number of ruptures to the corresp onding failures. Here “rupture” is understood as a failure causing a flow above a certain threshold, and the corresponding f ailures are all OPDE events for that specific ca se grouped by th e smallest possible dimension to cause the breach.
The total number of relevant components and the corresponding observation time (Reactor Critical Years) . Together these two will constitute the exposure term which is representing the process that produced the failures. c. Matching of populations: To complete the inp ut data set
the above t hree populations have t o be match ed. This is carried through as follows:
Firstly, in so far as the failure rate ( ) is concerned, all OPDE e vents belonging to a certain case are matched to the corresponding component population. In this matching dimension is not a relevant grouping criterion because failu res are considered to occu r independently of pipe si ze (the exception is failures due to Vibration Fatigue that is more likely in small bore piping). Howe ver, an event should be excluded from the input dat a set if there is n o corresponding dimension in the component po pulation, otherwise the event population will “ exceed” the component population and th e frequency is overestima ted. This might be the case with small-bore piping because they a re not always covere d by an y inspection program.
Secondly, for each bre ach threshold (Small Breach, Breach, Larg e Breach and Major Breach respectively), ruptures have to be matched to the corresponding smallest dimension (see Table 1). Here the component population is irrelevant simply because the beta distribution is independent of exposure, i.e. it just expre sses the relation between “failure and rupture”. Therefore no failures should be skipped due to lack of exposure data.
4.1.5 Presentation and Interpretation of Results
Finally, the results for each calculat ion case are presented. The unit is failure/(component*year) or failure/(system*year) where failure is understood as a breach of a certa in magnitude. The failure rate (), i.e. failure irrespective of potential flow, is also presented.
When the analyst wants to implement rupture frequencies for different flow rates (used for different LOCA categories in a PSA for exa mple) it is therefore necessary that a mapping is made for piping component
population so it can be matched to the rupture frequencies for each specific case. Then the number of all piping components (e.g. welds) in a subsystem matc hing the attributes an d the different flow rates/diameters is multiplied with the rupture frequency given by R-Book.
4.2 Experiences with the Identification of Relevant Degradation Mechanisms
This section addresses some experienced difficulties relate d to the definition of calculation cases, as well as an alternative strategy. 4.2.1 The Original “Top-Down” Strategy
The case definition should be based upon some kind of statement on whether a s ystem or a combination of attributes is vulnerable to a certain degradation mechanism. Earlier this work was carried out prior to the case def inition and a sharp dividing line was drawn between the “a priori” information and the executive process of compiling calculation cases. T he beforehand information was presented in so calle d DM-evaluation tables (DM – Damage Mechanism).
However, this approach raises so me knotty problems. Firstly, the beforehand evaluation needs to be extremely detailed, or else it gives no clue of the upper limit of “zero- point-cases” to be defined, i.e. the sample space is not clearly defined. Basically this is a q uestion of whether or not a calculation case should be defined for each and every possible combination of attributes. Here, as in th e case of incorrectly classified events (see Section 3.1.4 a), the objection is that many of these combinat ions represent events that are highly unlikely or even logically impossible.
Secondly, in applications like OPDE, there are always deviations from the theoretical pict ure due to misclassification or omissions. Nevertheless, it must b e presupposed that the deviation may be due to imperfection of the theoretical evaluation. The fact is that an ultimate evaluation or set of calculation ca ses cannot be brought about, simply because the proce dure of working out a complete evaluation is circular; it presupposes a “bottom-up” verification of the background itself. The only way to h andle this within the scope of R-Book would be to scrutinize every “outlier” in detail, and set some reasonable upper limit for how many “zero-point-cases” we are willing to accept. But at the same time i t must be acknowledge d that the principle of completeness is itself violated, and that a lot o f time will be consumed, not least because e very statement must be carefully motivated and documented. What is needed is a straightforward and simple guiding rule.
4.2.2 A Change of Perspective
According to the original strat egy, the relevant degradation mechanisms was cho sen prior t o glancing at the OPDE e vent population, and then ite ratively adjusted in t he light of OP DE data. This approach has the merit of taking all “hidden” failures into account (at least in principle). But as stat ed above, it has some serious drawbacks as well.
The suggestion was therefore to use the OPDE Worldwide picture to determine what degradation mechanisms are possible within a certain context, taking explicit credit of th e abundance of data stored in OPDE. This means that for Non-Nordic plants, few “zero-point-cases” will be defined, while for the Nordic plants these cases may even be dominating (because the Nordic p opulation is comparably small). OPDE will also determine what components are being demanded from the component databases and future mapping of plant populations.
This data driven “bottom-up” strategy provides a straightforward and simple rule of guidance. Perhaps it does not lea d us to the “ultimate” result, but it is unam biguously and transparently based on the empirical knowledge available and thereby perfectly trace able and easy to revise. This strategy makes R-Book a more powerful tool for feedback to OPDE as well as to theoretical assessments of various kinds.
It might objected that this new strategy is presupposing the old “top-down” strategy since only hypothesizes on how mechanisms work can form a basis for the classification of events. The answer is that this is correct, but nevertheless that such considerations have to be left outside R-Book framework. The basis for classification (i.e. some kind of “DM-evaluation”) is viewed as part of the OPDE framework, i.e. preparatory to R-Book, and will as such not be questioned.
Finally it should be noticed that the DM-evaluat ions are by no means discarded. However, as far as degradation mechanisms are concerned, they are used as te chnical guides rather than g overning documents.
4.2.3 Criteria for Screening out an Event
Although the OPDE da tabase itself will guide us to the final set of calculation cases we will need an agenda for the trea tment of exceptional cases. These cases concerns:
Events that are not completely identified in te rms of the requisite attributes.
Events that are completely but not correctly identified. The former records will simply be screened out due to
“incompleteness” and r eported to OPDE. The latter are ( of course) not directly accessible but will be measured against befor ehand set up constraints on what materials and code classes are re levant to a certain system. This information is retrieved from the DM-evaluations. Any event deviating from the scheme will b e screened out and reported to OPDE. It should be noted that no reclassification of OPDE failure events will be made within R-Book framework.
4.3 Revised Scope
At the beginning of the R-Book project the scope was th at R-Book would cover all piping that is repre sented in t he OPDE d atabase, thereby forming the basis for an y leak frequency originating from inside and outside the containment (i.e. LOCA flooding and HELB frequencies). A revised primary scope has however been n ecessary in order to shorten the turnaround time. The revised scop e implies that Code Class 1 an d 2 components are p rimarily analyzed. This restriction does not mean that Code Class 3, 4 and non-code is of no importance, but that priority is given to components with the greatest need for n ew updated data, i.e. components that are likely to contribute to LOCA fre quencies. The components that are primarily excluded from R-Book failure data for these components can be derived from the EPRI study [7]. It should be stressed th ough, that EPRI is based on US d ata and might have less validity for t he Nordic situation.
Thus, the first version of R-Book covers BWR and PWR systems for which there are OPDE-events in Code Class 1 or 2. These systems are:
AFW (Auxiliary Feed Water) CRD (Control Rod Drive) CS (Containment Spray)
CVC (Chemical & Volume Control) ECCS (Emergency Core Cooling) FW (Feed Water)
MS (Main Steam Lines)
RHR (Residual Heat Removal) RCS (Reactor Coolant - PWR) RPV-HC (RPV Head Cooling) RR (Reactor Recirculation - BWR) RWCU (Reactor Water Clean-Up) SLC (Standby Liquid Control)
S/G (Steam Generator Blowdown System)
5. EXAMPLE OF RESULTS
5.1 Results for RCS system in PWR
In this cha pter some example of results for the Reactor Coolant System (RCS) for Pressurized light Water Reactors (PWR) is presented.
As described in Section 4.1 the first step is to extract the d ata from the event database and thereby creating a service experience history, see Table 2.
Table 2: Service experience history for RCS in PWR; Non-Nordic, Nordic and Worldwide population.
1970-1979 1980-1989 1990-1999 2000-2007 1970-2007 Population, all failure modes Pipe size [mm] NTWC TWC NTWC TWC NTWC TWC NTWC TWC NTWC TWC Non-Nordic Ø>250 1 - 1 - - - 1 1 3 1 50 < Ø ≤ 250 - 1 1 1 - 3 6 - 7 5 Ø ≤ 50 1 17 2 59 12 67 15 18 30 161 RCY [year] 372 1316 1953 1634 5274 Nordic Ø>250 - - - 1 - 1 - 50 < Ø ≤ 250 - - - Ø ≤ 50 - 2 - - 2 - - - 2 2 RCY [year] 6 27 30 24 86 Worldwide Ø>250 1 - 1 - - - 2 1 4 1 50 < Ø ≤ 250 - 1 1 1 - 3 6 - 7 5 Ø ≤ 50 1 19 2 59 14 67 15 18 32 163 RCY [year] 377 1343 1982 1658 5361 Abbreviations NTWC: Non trough wall crack
TWC: Trough wall crack
RCY: Reactor critical years, i.e. exposure time
Figure and No What is history that ha mecha have th in the a Figure Since calcula populat current 0,00 0,05 0,10 0,15 0,20 0,25 0,30 0,35 0,40 1. Service e ordic popula s not displa also conta ave caused nism has it his detailed analysis. 2. Correlati each dam ation can o tion data e tly available 1970‐79 experience ation ayed in Tabl ains informa the failures ts own exp o information on between mage mec only be pe xist. In the e for weld s 1980‐89
RCS (F
history for le 2 above ation about s listed in T osure term n about the n flaw – me hanism ha rformed fo case of R s only. Thi 1990‐99Failures
RCS in PW is that the s t those da m Table 2. S i , see Fi gur service exp chanism – as its own r those c a CS, piping s informatio 9 2000‐0s/RCY)
WR; Non-Nor service exp mage mech nce each d e 2, it is c r perience da exposure te n exposure ases where population on constitu 7 No No 16 av 22 rdic perience hanisms damage rucial to ata used erms re term e piping data is utes the on‐nordic ordic SSM 2011:06 16empirical input to the analysis cases that ha ve been defined, see Table 3 and 4.
Table 3. PWR - RCS/313 - Non-Nordic Events (5274 RCY) – ASME Code Class 1
Degr. Mech. Component Material Failures Population
D&C Weld SS 9 1003,5
SCC Weld SS 16 1003,5
TF Weld SS 3 1003,5
VF Weld (DN <= 100) SS 2 1003,5
Abbreviations D&C: Design and Construction SCC: Stress Corrosion Cracking TF: Thermal Fatigue VF: Vibration Fatigue SS: Stainless Steel
Table 4. PWR - RCS/ 313 - Nordic Events (8 6 RCY) – ASME Code Class 1
Degr. Mech. Component Material Failures Population
D&C Weld SS 0 518,3
SCC Weld SS 1 518,3
TF Weld SS 0 518,3
VF Weld (DN <= 100) SS 0 518,3
Abbreviations D&C: Design and Construction SCC: Stress Corrosion Cracking TF: Thermal Fatigue VF: Vibration Fatigue SS: Stainless Steel
Based on the number of failures per degradation mechanism, the exposure time, the piping population and the method described in Section 0 a nd 0 yield results in th e form of failure rates for each degradation mechanism and piping component and adherent conditional leak rate probabilities per break flow threshold, see Table 1. In Table 5 and 6 the results for welds in stainless steel is presented for ASME Code Class 1, note th at other de gradation mechanisms than D&C and SCC have been left out from the tables.
Table 5. PWR - RCS/3 13 - Code Class 1 - Welds - Stainless Steel – Non-Nordic data
Case ID Parameters Rupture Mode Mean Percentiles 5% 50% 95%
Design & Construc-tion Errors (Incl.
Hu-man Error)
Rupture Frequency
SB 1,3E-08 6,9E-10 7,7E-09 4,3E-08 LB 1,1E-09 9,1E-11 8,5E-10 2,6E-09 MB 8,3E-10 2,4E-12 3,4E-10 3,4E-09
Failure rate -- 1,8E-06 9,1E-07 1,6E-06 3,5E-06
Stress Corrosion Cracking
Rupture Frequency
SB 2,2E-08 1,3E-09 1,4E-08 7,1E-08 LB 1,7E-09 1,6E-10 1,6E-09 3,6E-09 MB 1,7E-09 6,0E-12 7,0E-10 6,5E-09
Failure rate -- 3,2E-06 1,7E-06 2,9E-06 6,1E-06
Table 6. PWR - RCS/313 - Code Class 1 - Welds - Stainless Steel – Nordic data
From Table 5 and 6 one conclusion is that the contribution from D&C errors cannot be negle cted when comparing to the con tribution per weld from SCC.
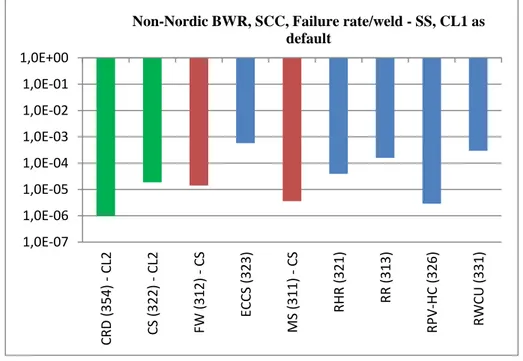
The data material provided in R-Book can be analyzed in many different ways. One such way is t o compare different systems with respect to failure rate for initial def ect. In Figure 3 and 4 t he failure
Case ID Parameters Rupture Mode Mean Percentiles 5% 50% 95%
Design & Construction Errors (Incl. Human
Error)
Rupture Frequency
SB 2,3E-08 4,3E-11 2,0E-09 6,6E-08 LB 2,2E-09 2,2E-12 1,5E-10 5,6E-09 MB 1,6E-09 3,4E-13 5,8E-11 3,1E-09
Failure rate -- 2,5E-06 1,4E-08 3,2E-07 9,2E-06
Stress Corrosion Crack-ing
Rupture Frequency
SB 1,6E-07 3,2E-09 6,3E-08 6,4E-07 LB 1,1E-08 2,7E-10 4,6E-09 3,7E-08 MB 8,3E-09 1,4E-11 2,0E-09 3,5E-08
Failure rate -- 1,8E-05 2,1E-06 9,5E-06 6,3E-05
rate due to SCC for Non-Nordic BWR (Figure 3) and PWR (Figure 4 ) respectively is illustrated.
Figure 3. Failure rate for initial defect (Non-Nordic BWR, SCC, Weld –
SS and Code Class 1 as default)
Figure 4. Failure rate for initial defect (Non-Nordic PWR, SCC, Weld –
SS and Code Class 1 as default)
The major conclusion from Figure 3 and 4 is that when it comes to failure rate for initial defect there ar e major diff erences between the
1,0E‐07 1,0E‐06 1,0E‐05 1,0E‐04 1,0E‐03 1,0E‐02 1,0E‐01 1,0E+00 CRD (3 54 ) ‐ CL2 CS (3 22 ) ‐ CL2 FW (3 12 ) ‐ CS ECCS (3 23 ) MS (3 11 ) ‐ CS RH R (3 21 ) RR (3 13 ) RPV ‐HC (3 26 ) RW CU (3 31 )
Non-Nordic BWR, SCC, Failure rate/weld - SS, CL1 as default 1,0E‐07 1,0E‐06 1,0E‐05 1,0E‐04 1,0E‐03 1,0E‐02 1,0E‐01 1,0E+00 CS (3 22 ) ‐ CL2 CVC (3 34 ) ECCS (3 23 ) RC S (3 13 ) RH R (3 21 )
Non-Nordic PWR, SCC, Failure rate/weld - SS, CL1 as default
systems, the difference is almost three orders of magnitude between the system with highest and lowest failure rates for BWR, less
difference for PWR though. It is th erefore very important to review and understand the different degradation mechanism’s that are active for each system.
6. Outline of R-Book – Sub-reports
R-Book is built up of several sub-reports. Firstly there is a report (34.800.021-R-000 - Theory) presenting the theoretical fra mework of R-Book, e.g. the considerations b ehind defining prior distributions, statements on validation and verification etc. Secondly, the analysis of each system is presented in separate reports with all in formation and appendices needed for that specific system. The systems reports can thus be used independently.
There are 16 sub-reports included in R-Book. These are: 34.800.021-R-000 - Theory 34.800.021-R-001 - ADS (314) 34.800.021-R-002 - AFW (327) 34.800.021-R-005 - CRD (354) 34.800.021-R-006 - CS (322) 34.800.021-R-007 - CVC (334) 34.800.021-R-011 - FW (312,415) 34.800.021-R-014 - ECCS etc. (323) 34.800.021-R-016 - MS (311,411) 34.800.021-R-018 - RCS (313) 34.800.021-R-019 - RHR (321) 34.800.021-R-020 - RR (313) 34.800.021-R-021 - RPV-HC (326) 34.800.021-R-023 - RWCU (331) 34.800.021-R-025 - SG (337) 34.800.021-R-026 - SLC (351)
The naming of the reports helps id entifying a certain syst em by the following rule as exemplified by 34.800.021-R-001 - ADS (314):
34.800.021 Scandpower project number
R Report
001 System index used in R-Book
ADS US designation
(314) Swedish designation/s
7. REFERENCES
1. SKI Report 2008:01, Reliability Data for Piping Components in Nordic Nuclear Power Plants “R-Book” Project Phase I, Anders Olsson and Bengt Lydell, January 2008.
2. Lydell, B., 2007. “The Probability of Pipe Failure on the Basis of Operating Experience,” PVP2007-26281, Proc. 2007 ASME Pressure Vessels & Piping Division Conference, July 22-26, 2007, San Antonio (TX).
3. Chrun, D., Mosleh, A. and Lydell, B., 2010. Technical Basis for Defining Prior Distribution Parameters for Conditional Pipe Failure Probabilities, Technical Report 35.900.003/R1,
University of Maryland and Sacandpower Inc. 4. SKI Report 03:02, 2003 Störningshandboken BWR,
ISSN1104-1374, 2003-03-24.
5. ANSI/ANS-52.1-1983, Nuclear Safety Criteria for the Design of Stationary Boiling Water Reactor Plants.
6. ANSI/ANS-51.1-1983, Nuclear Safety Criteria for the Design of Stationary Pressurized Water Reactor Plants.
7. EPRI 1013141, Pipe Rupture Frequencies for Internal Flooding PRAs, Revision 1.
8. OPDE PR01, OPDE 2007:1 CODING GUIDELINE (OPDE-CG) & OPDE 2007:1 USER’S GUIDE, B.O.Y. Lydell (OPDE Clearinghouse), 29-June-2007.
Strålsäkerhetsmyndigheten Swedish Radiation Safety Authority
SE-171 16 Stockholm Tel: +46 8 799 40 00 E-mail: registrator@ssm.se
Solna strandväg 96 Fax: +46 8 799 40 10 Web: stralsakerhetsmyndigheten.se
2011:06 The Swedish Radiation Safety Authority has a comprehensive responsibility to ensure that society is safe from the effects of radiation. The Authority works to achieve radiation safety in a number of areas: nuclear power, medical care as well as commercial products and services. The Authority also works to achieve protection from natural radiation and to increase the level of radiation safety internationally.
The Swedish Radiation Safety Authority works proactively and preventively to protect people and the environment from the harmful effects of radiation, now and in the future. The Authority issues regulations and supervises compliance, while also supporting research, providing training and information, and issuing advice. Often, activities involving radiation require licences issued by the Authority. The Swedish Radiation Safety Authority maintains emergency preparedness around the clock with the aim of limiting the aftermath of radiation accidents and the unintentional spreading of radioactive substances. The Authority participates in international co-operation in order to promote radiation safety and fi nances projects aiming to raise the level of radiation safety in certain Eastern European countries.
The Authority reports to the Ministry of the Environment and has around 270 employees with competencies in the fi elds of engineering, natural and behavioural sciences, law, economics and communications. We have received quality, environmental and working environment certifi cation.