© Michael Adgård and Carl Rehncrona
Department of Production Management Lund University Institute of Technology Master Thesis
Public Edition KFS in Lund AB Lund 2005 Printed in Sweden
Abstract
Title: Pricing Management at Alfa Laval Equipment Division Authors: Michael Adgård I-00
Carl Rehncrona M-00
Supervisors: Per Sandberg, General Product Manager, Alfa Laval ED
Bertil I Nilsson, Department of Production Management, Lund Institute of Technology
Steering committee: Per Sandberg, General Product Manager, Alfa Laval ED Lars Kayser, Senior Product Manager, Alfa Laval ED Anders Arnell, Senior Product Manager, Alfa Laval ED Bertil I Nilsson, Lund Institute of Technology
Research questions: What factors should be considered when setting a price of a new Plate Heat Exchanger, PHE? With these factors in mind, how should a logical pricing model be created and what kind of measurable data should be used to find logical relations?
Deliverables: The main focus has been towards creating a logical pricing model for new PHEs. Furthermore, the projects purpose has been to issue a status report of how the RCPL-strategy1 is implemented in different geographical locations, a benchmark of other Swedish export companies and last to verify the applicability of the logical pricing model.
Methodology: In the first phase of our project we tried to collect as much
primary and secondary data as possible. We read a lot of different literature, conducted several interviews at Alfa Laval and sent out a questionnaire together with a discount survey to different sales companies around the world.
In the second phase of our project we focused on creating a
logical pricing model. In order to do this we had to begin by collecting information to a database. We collected prices from an Alfa Laval sales system and product data by using product data sheets. Furthermore, the results from the questionnaire and discount survey was put together and analyzed.
In the third phase of the project most of the time was spent to
configure and optimize the database. After the database was
1
model by comparing prices from the model with prices from the sales tool.
Conclusions: By analyzing the data from the questionnaire and the discount survey it can be determined that the RCPL-strategy has been reasonably well implemented. However, there is a need to improve the communication between the sales companies and the central organization. There is also a need to specify the sales data in order to get a better understanding of the customer. By testing the logical pricing model that has been created it can be determined that the model is applicable and can be used as guidance when setting an RCPL-price of new PHEs. There are other factors that are not included in the logical pricing model but still need to be considered. Some of these factors can be viewed in an Ishikawa diagram which is thought to work as further guidance when an RCPL-price is set, see appendix V. Keywords: Logical Pricing, Pricing Strategy, Value-based Pricing,
Discount Pricing, Product Management, Marketing Management, International Pricing
Preface
This master thesis was carried out at Alfa Laval Equipment Division in Lund over the fall of 2004 and the beginning of 2005. Our task has been to design a logical pricing model for new plate heat exchangers, PHEs. Hopefully this will be a useful complement when prices are set for new PHEs and also to verify the price-levels of already existing PHEs.
Being stationed at Alfa Laval has contributed to a good insight in the company’s organization and has been a fun and rewarding experience.
Finally, we want to thank all the persons that have contributed by supplying us with basic data and reliable discussions of great importance for this master thesis. Especially we want to thank our supervisor at Alfa Laval, Per Sandberg and the steering committee, i.e. Anders Arnell and Lars Kayser, at Alfa Laval for supporting us in every possible way during the project. We also want to thank our supervisor at LTH, Bertil I Nilsson, for supporting us and leading us in the right direction. Furthermore we want to thank Alfa Laval for being welcoming and a having a nice atmosphere to work in.
Some of the material has been classified as confidential and has been edited in the public edition.
Lund, February 2005
Contents
1 Introduction... 11 1.1 Background ... 11 1.2 Project deliverables ... 13 1.3 Research questions ... 14 1.4 Educational purpose ... 14 1.5 Project limitations ... 15 1.6 Target audience ... 151.7 Disposition and Outline ... 16
2 Methodology ... 19
2.1 Introduction... 19
2.2 Different scientific approaches ... 20
2.3 Different ways of gathering data... 21
2.4 Different types of data... 23
2.5 Validity, Reliability and Objectivity ... 24
2.6 Induction, deduction and abduction ... 25
2.7 Practical approach ... 27
3 Theory ... 29
3.1 Introduction... 29
3.2 Product life cycle ... 30
3.3 Price elasticity ... 32
3.4 Pricing methods... 33
3.5 Pricing Tactics... 35
3.6 Ishikawa diagram – a tool to illustrate a problem ... 38
4 Company and product description... 39
4.1 Company description ... 39
4.2 The Plate Heat Exchanger... 41
5 RCPL-implementation within Alfa Laval today ... 45
5.1 Introduction... 45
5.2 Results from the questionnaire... 45
5.3 Results from the discount survey ... 46
5.4 Discussion of the present situation... 47
6 Pricing strategies at other Swedish export companies ... 49
6.1 Introduction... 49
6.2 Sandvik Mining and Construction ... 49
6.3 Atlas Copco Compressor... 50
6.4 Trelleborg... 50
6.5 Results from benchmarking ... 50
7 Creating a logical pricing model... 53
7.1 Introduction... 53
7.2 Factors that need to be considered when setting an RCPL-price ... 53
7.3 Finding a logical RCPL pricing model for new PHEs ... 54
7.4 Results from the database... 57
7.6 Risks... 61
7.7 Field of application ... 61
8 Conclusions... 63
8.1 Introduction... 63
8.2 Questionnaire, Discount Survey and Benchmarking ... 63
8.3 The Logical Pricing Model ... 64
8.4 Final Conclusions and Recommendations ... 65
9 References... 67
Appendix ... 71
I. Questionnaire... 71
II. Discount survey ... 74
III. Relations between component data and RCPL-prices ... 75
IV. Deviation... 88
1 Introduction
This chapter will introduce the reader to the background of the problem, research questions and purpose of the master thesis.
1.1 Background
In 2001 Alfa Laval launched a program to change their pricing method. They decided to move from a cost-plus-strategy to a market-driven-strategy and the new pricing method was named RCPL2 which is the highest price a customer will pay for an Alfa Laval product. The need to change the pricing-strategy was identified since:
- There was a need to have a more dynamical pricing system.
- Some of Alfa Laval’s customers are global and when buying products from Alfa Laval at different geographic locations they had to pay different prices for the same product. This was confusing to customers and lead to a discontent among Alfa Laval’s customers. It also made customers question the value of Alfa Laval’s products. In other words, having a global price list is one of the drivers behind the change of pricing-strategy.
Having one global price list would generate several benefits; among others Alfa Laval could implement one global sales system, One4AL, instead of having many different sales systems. This would improve the communication within Alfa Laval and also reduce the amount of administration.
The RCPL-strategy that was implemented can be seen as a reference price level from which different types of customers get discounts. The general customer classifications are: End User, Installer, Contractor and Distributor/System Builder, as shown in figure 1.1.
The implementation of the RCPL-strategy in a global perspective was done rather quickly and has never been well documented and evaluated. Instead of having one global RCPL- level there are three. The motive from the beginning was to set a global price level, however the price levels between these geographical locations differed too much to be able to unify at one global level
2
Figure 1.1 Discount structure showing different price levels
The application of the RCPL-strategy is going well in some countries and in some segments but worse in others. The change of pricing method has proven to be a big “mind set” for the entire Alfa Laval organization since it requires that the employees accept and adjust to another way of thinking and working. The employees had to move away from considering the cost of a product and instead focus on the value a customer experience by using it.3
Within the new sales system, One4AL, there are certain price levels that the sales persons have to take in consideration when selling Plate Heat Exchangers, PHEs, see figure 1.2. RCPL-price Actual price Warning price Alarm price Factory price Price band to manage locally Consolidated Profit Margin Discount
Figure 1.2 Pricing levels in One4AL
3
RCPL:
Recommended customer price list – the highest price a customer will pay for Alfa Laval products.
Actual price:
The price a customer pays for the product after given discounts.
Warning price:
The warning price level is set locally by the sales company. If a sales person need to sell at a lower price than the warning price, the sales person need confirmation from the local sales manager.
Alarm price:
This price is centrally set and a sales person need central confirmation to have the authority to close a deal at a price lower than the alarm price.
Factory price:
To get a profit from the sold product the price can not be lower than the factory price.
1.2 Project deliverables
The project was given to us by Per Sandberg, General product manager at Alfa Laval and he wanted the following deliverables to be accomplished:
- A status report of how the RCPL-strategy is implemented in different regions. - A benchmark of the RCPL-strategy compared to other Swedish export
companies.
- Create a logical pricing model of how to set the RCPL for a new PHE. - Verify the applicability of the logical pricing model
1.3 Research
questions
With this background in mind we have formulated the following research questions: - Has the RCPL-strategy been well implemented in the sales companies? It is of
great importance to find out how the RCPL-strategy is used by the sales companies since they are the closest link to the customers. Furthermore, we intend to look at the level of communication between the central organization and the sales companies.
- What are the factors that create value for a customer? The RCPL-strategy requires that the price of a PHE is set by looking at the received customer value. In other words there is a need for an understanding of the customer; we will therefore highlight some factors that create customer value.
- Are the levels of discounts appropriate or should it be increased or decreased? If the discount level given to different customers is too high it might undermine the pricing strategy that is used. Furthermore, it is of interest to know how the discounts affect the sales, are the discounts discussed or is the focus only on net sales prices?
- What are the Alfa Laval employees’ views of RCPL pricing? Has it made it easier to the employees to deal with customers and does it tie the customer closer to Alfa Laval? Can the RCPL-level act as a deterrent to the customers or does the high level of discounts undermine the price function as an indicator of the products value?
- How is an RCPL-price set for a new product and what factors need to be taken into consideration when creating a model for pricing new PHEs? How should these factors be measured and implemented in a model? We intend to highlight some of these factors and also try to make a simple and logical pricing model. - How has other Swedish export companies solved the problems with global
pricing? Are they in the same situation as Alfa Laval when it comes to cost-plus and market driven pricing decisions?
1.4 Educational
purpose
This master thesis is the final step of our engineering studies. The purpose is to apply the knowledge we have received during our education in a practical sense and also to learn more about pricing matters in an international company. Furthermore, the aim is to get an increased understanding of the company Alfa Laval and its products.
1.5 Project limitations
The logical pricing model will focus on two types of PHEs i.e. gasketed PHEs and SWHEs4. The thicknesses of the plates that are used in the database are 0.5 mm for the gasketed PHEs and 0.6 mm for SWHEs. The model will use prices for already existing products as a basis, in other words the prices are assumed to be correctly set according to the market level. The products taken in consideration for the model are classified as high-volume and standard products.5 Furthermore the model will be limited to titanium and stainless steel, which are the most commonly used materials for PHEs and SWHEs.
1.6 Target
audience
This master thesis targets two different groups:
Alfa Laval:
- The project sponsors/supervisors at Alfa Laval in Lund - Employees at Equipment Division at Alfa Laval in Lund
- Alfa Laval employees that come in contact with pricing of products by using the RCPL-strategy
Lund University:
- Students at Mechanical Engineering program and Industrial Management and Engineering program at Lund University of Technology
4
Semi Welded Heat Exchangers
5
1.7 Disposition and Outline
Chapter one: This chapter will introduce the reader to the background of the problem, research questions and purpose of the master thesis. Chapter two: The aim for this chapter is to construct a platform on which we
could manage our work in a scientific way. We will present theories that we have used in our way of collecting and transforming data.
Chapter three: In this chapter, theories that are relevant for further understanding of our master thesis are presented. We intend to highlight both different pricing strategies and other theories that can be relevant when setting a price of a product.
Chapter four: Chapter 4 contains a company description of Alfa Laval together with product descriptions of PHEs and SWHEs.
Chapter five: In this chapter we will present the current situation at Alfa Laval. The intention is to show how well the RCPL-strategy has been implemented into the sales companies.
Chapter six: The aim for this chapter is to describe how similar Swedish export companies handle their pricing- and discount strategies compared to Alfa Laval.
Chapter seven: This chapter describes the background and the development of the logical pricing model together with analysis of the test results.
Chapter eight: In this chapter the results of the research will be presented as well as recommendations of future work with pricing at Alfa Laval.
Chapter nine: The references used in the writing of this master thesis.
Appendix I: Questions and answers from the questionnaire that was sent out to the sales companies.
Appendix II: The discount survey that was sent out to the sales companies. Appendix III: Graphs showing the relations used in the logical pricing model
Appendix IV: Graphs showing the deviation for frames, connections, plates and gaskets from the verification test.
Appendix V: The Ishikawa diagram showing an example of factors that needs to be considered when setting an RCPL-price.
2 Methodology
The aim for this chapter is to construct a platform on which we could manage our work in a scientific way. We will present theories that we have used in our way of collecting and transforming data.
2.1 Introduction
There are different scientific approaches that can be used when doing an investigation. Figure 2.1 shows the scientific approach which is seen as a reference that will affect the choice of methodology. Different methods and practical approaches can be used depending on the methodology.
Scientific approach
Methodology
Method
Practical approach
Figure 2.1 Scientific approach
The theories described in this chapter are collected from Seminarieboken by Björklund and Paulsson, Utredningsmetodik för samhällsvetare och ekonomer by Lundahl and Skärvad and Den uppenbara verkligheten by Ib Andersen.
We will begin each subchapter by describing different methods that can be used and at the end describe the approach we have used in this master thesis.
2.2 Different scientific approaches
2.2.1 Explorative / Problem identifying
When an investigation is made in a context that is indefinite, the aim of the investigation is to explore and understand the fundamental environment. Furthermore the explorative investigation can be used to formulate and frame the nature of the problem.
The explorative investigation can also be a preparation to an explaining/understanding investigation (see 2.2.3). When used in this purpose, the combination of the two approaches formulates a hypothesis that later can be tested and validated.
An explorative investigation can be used to specify a problem, for example a consultant that has been given the assignment to identify a problem that the management and co-workers knows exists but are not able to describe.6
2.2.2 Descriptive
Descriptive studies are made when the essential environment is determined and the mission is to describe rather than to explain existing relations. The descriptive approach may contain description of a historical event as well as of an ongoing one. It may also describe the background to a phenomenon or the consequence and relations between different phenomenons.7
2.2.3 Explaining / understanding
These studies can be explanatory on a deep level of understanding but may also be used to give a general overview. The purpose is to answer the question of why and questions about the cause and its consequences.
This kind of investigations often includes statistical tests and verifications of an earlier made up hypothesis. The goal is to understand the environment and with this knowledge it is possible to determine cause and effect which in turn makes it possible to prevent and counteract in different situations.8
6
Den uppenbara verkligheten, Ib Andersen, page 18-19
7
Den uppenbara verkligheten, Ib Andersen, page 18
2.2.4 Diagnostic
This kind of investigation uses earlier noticed symptoms to diagnose the underlying factors. The establishment of a diagnostic investigation is often a result of a situation that is dissatisfying and needs to be taken care of. The goal is to find a solution to the arisen problem which often is a combination of qualified and quantified nature.9
2.2.5 Normative / Problem solving
The normative investigation is used when there is a certain amount of knowledge and understanding of the environment. The solution to the problem works as guidance and as a proposing measure. Often the work process is to suggest a number of alternative solutions and then with a further analysis chose the one that is the most applicable.10
2.2.6 Our scientific approach
Our approach for this master thesis is of a normative nature i.e. finding a solution to the pricing problem of new PHEs. However, to be able to do this, the beginning of our investigation has to be explorative and explaining since we need to understand the fundamental environment to create a hypothesis and a model that can be verified through different tests.
2.3 Different ways of gathering data
2.3.1 Written sources
Written sources are examples of secondary data i.e. published articles, books and Internet websites.
2.3.2 Interviews
To do interviews with persons that possess interesting information is a central method to gather primary data and to get a chance to ask the questions that are directly relevant for the research. There are a number of different interviewing techniques and they are classified as structured, semi-structured and non-structured. There are more or less predetermined questions and they can be asked in a more or less fixed sequence. The
9
Utredningsmetodik för samhällsvetare och ekonomer, Lundahl & Skärvad, page 48-49
10
well e.g. direct interviews or phone interviews. The objectivity of the questions is of interest i.e. if the questions are leading or if they are standardized to get more comparable answers.11
2.3.3 Surveys
A survey is a way of gathering primary data where there are few variables and numerous of units to be examined. The survey is a way of collecting data that could be used to describe a current situation. Examples of surveys are market researches, voter surveys and attitude researches.
The data that are gathered by a survey are of quantitative character and are often collected by standardized questionnaires or interviews. Parts of the population are examined and are used to represent the rest of the population.12
2.3.4 Questionnaire
A questionnaire is easier to use when collecting information from numerous persons compared to interviews. Even if a questionnaire is not as flexible and comprehensive as an interview it is an inexpensive and timesaving method. To receive comparable answers it is important that the questions are made plain and clear.
2.3.5 Triangulation
Triangulation is used to increase or secure the analysis that was conducted. The intention is to use a number of methods to confirm the result and in that way get a more accurate conclusion.13
2.3.6 Our approach of gathering data
The data that we have collected are from presentations at Alfa Laval, scientific articles, Alfa Laval’s intranet, Internet and books about pricing, marketing, quality and methodology. Many informal meetings with Alfa Laval employees have helped us to get an overview of the problem; they can be classified as non-structured interviews and are not directly referred to in text. We have also done several direct- and phone interviews
11
Utredningsmetodik för samhällsvetare och ekonomer, Lundahl & Skärvad, page 115-116
12
Den uppenbara verkligheten, Ib Andersen, page 125
that can be classified as semi-structured. Furthermore a questionnaire and a discount survey have been sent to sales companies in different countries. Triangulation is used since we have used different methods to gather data.
2.4 Different types of data
2.4.1 Primary or Secondary data
Primary data are the data that are collected by the researchers themselves for a specific purpose and secondary data are data that already exist and are collected by other people for other purposes.14
2.4.2 Quantitative or Qualitative data
The quantitative data is measurable and could be used in mathematical or statistical analysis whereas qualitative data is harder to measure and is used to create a deeper understanding of a specific situation. Outcomes from surveys are often of a quantitative nature and the outcomes from personal interviews are often of a qualitative nature.
2.4.3 Different types of data in our approach
Our collected data are of different types; interviews conducted at Alfa Laval, the discount survey and the questionnaire are sources of primary data. A lot of secondary data has been collected through scientific articles, literature and information brochures. Data used for creating the logical pricing model comes from both product data sheets and CAS15. These are secondary data.
The data that are collected from the questionnaire and the interviews are of qualitative nature while the data collected from the discount survey, the data sheets and CAS are of quantitative nature.
14
Den uppenbara verkligheten, Ib Andersen, page 150
15
2.5 Validity, Reliability and Objectivity
2.5.1 Validity
Validity is defined as the absence of systematic measurement deviation. There are two different versions of validity; internal and external.
Internal
The internal validity depends on whether the study really measures what it was supposed to measure. It is important to be aware of in what extent the method measures too much, too little or the wrong things.
External
The external validity depends on the way the people of the study answers the questions; did they lie, were they aware of how they would react in the situation or did they just remember wrong? All these factors affect the external validity of the study.16
2.5.2 Reliability
The reliability refers to the precision and exactness of the measuring tool. The result of the measurement should be the same regardless of whom and under which circumstances it is executed. Is the tool really measuring what it is supposed to and is it correctly calibrated? This means that the measurement tool should not have a random measurement deviation. The aim is to decrease the stochastic deviation. One way to increase the reliability of a study is to ask similar questions to make the answers more accurate. Another way is to use standardized questions which will result in a similarity of the answers given.17
2.5.3 Objectivity
High level of objectivity of the research means that the involvement of personal values is low. It is important that a scientific study is objective and that the personal values of the authors do not influence and affect the real data and the questions asked.18
16
Utredningsmetodik för samhällsvetare och ekonomer, Lundahl & Skärvad, page 150-151
17
Utredningsmetodik för samhällsvetare och ekonomer, Lundahl & Skärvad, page 152
2.5.4 Validity, Reliability and Objectivity of our collected data
Internal Validity
In order to get as high internal validity as possible for both the discount survey and the questionnaire we formulated the questions and the structure of the survey in consultation with our supervisor; Per Sandberg. The persons that were included in the research were provided to us by our supervisor, knowing who the relevant persons to contact are. Therefore we feel that we got every possible aspect included in the questionnaire and discount survey.
External Validity
Some of the answers from the questionnaire are brief and in some cases also missing. However, the majority of the answers are still detailed enough to indicate views and opinions and therefore we find the external validity to be high. The replies on the discount survey are an estimation made by the head of the sales companies rather than an “absolute truth”. They are not doing regular data analysis of their discount levels and therefore the external validity of the collected figures is not that high.
Reliability
To get as high reliability as possible of our investigation we have used a standardized questionnaire and a standardized discount survey.
Objectivity
A lot of the replies from the questionnaire may have been influenced by the respondents’ personal values and can therefore affect the objectivity to some extent.
2.6 Induction, deduction and abduction
2.6.1 Induction
Induction is about exploring the environment to collect empiric information. This information will be used to create theories.
2.6.2 Deduction
A deductive approach uses a general theory to move toward certain conclusions about separate events and proving them. This is a common way for management consultants to work; they are using general knowledge to adapt on various organizations.
2.6.3 Verification
Verification is used to confirm the result of an investigation.
2.6.4 Abduction
Abduction is a combination of the inductive and the deductive approach. The transition between theory and fact is shown in figure 2.2.
Theory Fact Theory Theory Fact Deduction Fact Ind u ction Verifica tio n
Figure 2.2 Induction, Deduction and Verification
2.6.5 Our approach
We have used an abductive approach when writing our master thesis. We have collected empirical data from the discount survey, the questionnaire and the interviews. We have used the collected empirical data together with theory from literature and scientific articles to create a logical pricing model.
2.7 Practical
approach
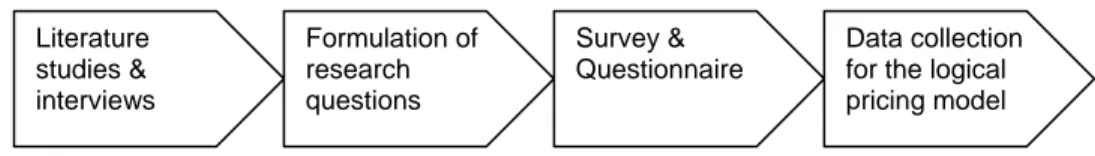
In the beginning of this master thesis we focused on literature studies; trying to understand the product and formulate the direction of the thesis.
In order to get an overview of the RCPL-strategy we conducted several formal and informal interviews. We collected data from sales companies around the world by sending out a discount survey and a questionnaire. The results from the discount survey, the questionnaire and the interviews were analyzed and were used to understand the present situation.
After the present situation was described we focused on creating a logical pricing model. A lot of time was spent at finding the data, setting up relations and creating a logic structure for the database. Analyzing the results of the database and configuring it to be functional was also an important aspect.
We have continuously been in touch with the steering committee showing them the progress of our work making sure that we were on the right track. At two occasions we have had “milestone” meetings, i.e. presentations of collected results and discussions of future direction.
The structure of the thesis is based on the earlier mentioned deliverables, see 1.2. We have tried to build the structure upon these four aspects in order to give the reader a good overview.
Literature studies & interviews Formulation of research questions Survey & Questionnaire Data collection for the logical pricing model
3 Theory
In this chapter, theories that are relevant for further understanding of our master thesis are presented. We intend to highlight both different pricing strategies and other theories that can be relevant when setting a price of a product.
3.1 Introduction
The marketing mix consists of the “four Ps” i.e. place, product, promotion and price. These are the tools that a company can use to influence the demand for its product and has to be coordinated to achieve marketing objectives. In the further theories we have focused on the price and pricing of new products. 19
Setting a products price is one of the most important decisions that a company makes. If the price level is set too high it can result in loss of customers or if the price is set too low the margins might not be high enough to cover cost and create a sustainable profit. Both scenarios can result in a decrease of a company’s growth and in a worst case scenario it can result in serious problems with sales and cash flow. With this in mind one realizes the importance of having a working pricing strategy in order to stay competitive.
In order to make good pricing decisions, there need to be an understanding of the basic differences between price, cost and value.
Definitions:
Cost - the amount of resources that is spent to make a product or service
Price - the financial contribution to a company for supplying a product or service Value - the value a customer receives from buying a product
The conclusion of this is that the price need to reflect the value perceived by a customer i.e. to maximize profits one need to finding the value of the products by e.g. find what benefits the customer gets by using the product. 20
19
Marketing, Armstrong & Kotler, page 63
20
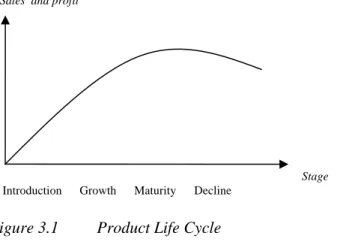
3.2 Product life cycle
The product life cycle (PLC) is a description of the different stages a product goes through over time. The classic diagram over the product life cycle is divided into four stages: introduction, growth, maturity and decline, see figure 3.1.
Introduction Growth Maturity Decline
Sales and profit
Stage
Figure 3.1 Product Life Cycle Introduction stage
Products in the introduction stage have recently been launched on the market. The sales have not yet started to grow and there is still an uncertainty whether or not the product will be successful.
Growth stage
Products in the growth stage are distinguished by high growth in sales. Often companies need to invest in larger production facilities to be able to meet the higher demand. Furthermore companies often have to expand its organization by recruiting and educating people.
Maturity stage
This stage represents a lower growth rate. The products are well known to customers and the level of competition is increasing. The maturity stage is the stage when most profits are earned for the whole market.
Decline stage
The growth in sales volumes are declining and competitors products are to the customer more or less the same. Price is often the determining factor for making a purchase.
There is often focus on the production cost in order to maintain profitability in this stage.21
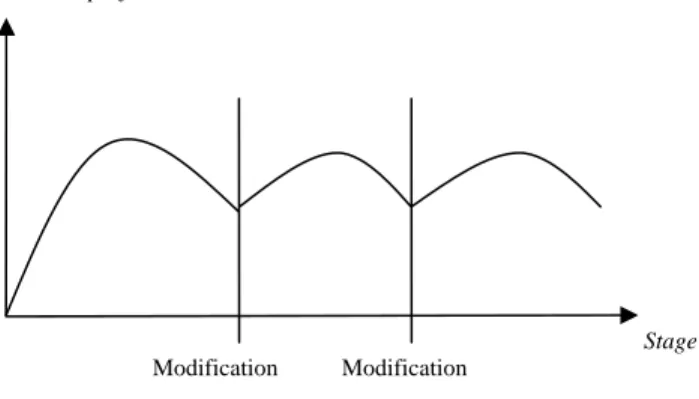
The life cycle of a product can be extended by modifying and improving the product in order to meet a change in demand and to get advantages compared to competitors’ products, see Figure 3.2.22
Modification Modification
Sales and profit
Stage
Figure 3.2 Modified product life cycle
21
Product life cycle, www.tutor2u.net, 2004-10-17
22
3.3 Price
elasticity
Some customers and products tend to be more sensitive than others for changes in price. Customers with small resources are more sensitive to price changes compared to customers with more resources. Commodity products tend to be more sensitive to price changes than unique products. Therefore it is important to a company to know how a price change will affect the demand. The theory behind this is called price elasticity.
P2 P1 P4 P3 Q2 Q1 Q4 Q3 Price Demand/ Quantity
Inelastic demand Elastic demand
Figure 3.3 Price elasticity diagrams
The left diagram in figure 3.3 shows that a small change in price results in a small change in demand (inelastic demand) and the right diagram shows that the same change in price results in a larger change in demand (elastic demand).23
23
3.4 Pricing
methods
There a two fundamental methods that can be used to put a price on a product, cost-plus-pricing and value-based-cost-plus-pricing
3.4.1 Cost-Plus Pricing
A common and simple pricing method is cost plus pricing. The cost of a product is multiplied with a standard mark-up to calculate the selling price. Because of its simplicity this method has become very popular; it is easier to calculate your own costs and add a margin than it is to estimate the customers’ value of the product. Though, in many situations cost plus pricing is not optimal, e.g. if the customers are willing to pay a higher price than the calculated, the selling company will not get as high revenue as they could and in the opposite situation if the price is higher than the customers demand, the company will not sell such a volume that they otherwise would. Often cost plus seems more fair than other ways of pricing since the seller do not trade upon the fact that the customers has a great demand of the product, instead the company gets what seems to be a fair margin on every sold product.
Break-even Pricing
The aim for the company is to calculate which price that is the break-even price or the price that will result in the profit that the company intended. A break-even chart is used to calculate the price that will be used, see figure 3.4 for an example. There has to be an estimation of the sales volume at a given price to be able to draw a chart.24
Fixed cost Total revenue Total cost 0 2000 4000 6000 8000 10000 12000 0 200 400 600 800 1000 1200 Sales volum e € Target profit Break-even
Figure 3.4 Break-even chart
24
3.4.2 Value-Based Pricing
The motive behind value-based pricing is to sell for the price that is best correlated with the customers demand (value). The price a customer pays need to reflect the value perceived by a customer i.e. to maximize profits one need to find the value of the products. A problem can occur if competitors’ use cost-plus pricing and sell at a lower price, this means that the value-based pricing company has to lower its prices as well and the result is that both companies miss the opportunity to sell at a higher price, even if the customer was willing to pay more. A company that use value based pricing has to be aware of all the benefits a customer gets by using your product to be able to motivate as high price as possible.25
Figure 3.5 shows the difference between a cost-plus approach and a value-based approach when setting a price on a product. Note that the customers is the first factor identified when using a value-based pricing method instead of the product when using a cost-plus method.
Product Cost Price Value Customers
Customers Value Price Cost Product
Cost-Plus Pricing
Vs.
Value-Based Pricing
Figure 3.5 The difference between cost-plus and value-based pricing.
The correlation between received value and the price paid is shown in figure 3.6. A too high price in relation to received value will result in missed opportunities i.e. sales volumes will go down. On the other hand if the price is set too low in relation to the received value the result will be unharvested value i.e. loss of profitability.26
It is of great importance to realize that the received value has to be defined before a price is set on a product to be able to get as high profitability as possible.
25
Marketing, Armstrong & Kotler, page 366-367
Figure 3.6 Designing value-based price metrics
3.5 Pricing
Tactics
3.5.1 Introduction
With the cost-plus and value-based pricing methods in mind a company can further develop its pricing strategy by choosing a pricing tactic.
3.5.2 Discount pricing
Discounting means that a customer gets a reduced price from what is printed in a price list. Advantages with this tactic are that competitors can not as easily see what prices your customers really pay for your products. Furthermore, discounting offers the possibility to charge different types of customers’ different prices and a global price can be used since the discount levels can be adjusted to different market conditions.27
27
Skimming pricing is a pricing tactic for new products which means that the price level is set at a high level. Skimming pricing can be used when a company has a unique product or service. Another possibility is that the high price level is used to make customers believe that the product is unique.
The opposite of skimming pricing is penetration pricing i.e. the price level is set low to attract customers and gain market shares. Later on when a loyal customer base has been built prices can be raised.28
3.5.4 Segmented pricing
Segmented pricing is when a company charges different price for the same product i.e. the price does not depend on the cost of the product. Different types of segmentation pricing methods can be customer-segment pricing (different customers pay different prices), product-form pricing (different versions of the product have different prices and not in relation to cost differences), geographical location pricing (different prices for different geographical locations despite that the cost is the same) and time pricing (the price varies with the season, day, hour).29
3.5.5 Psychological pricing
The idea behind psychological pricing is that the price indicates the quality of a product. Often when a customer lack information of a product or is not capable of making judgements concerning the quality, the price becomes an important factor when making a buy. In other words the salesman uses the price to say something about the product.30
3.5.6 International pricing
Setting prices on an international basis is very difficult. To be able to stay competitive a company must adjust its pricing of products to each of the different markets condition. The price in a country may depend on laws and regulations, the level of competition etcetera. A company’s objective may vary between different countries and thereby different strategies might be used.
28
Marketing, Armstrong & Kotler, page 371-372
29
Marketing, Armstrong & Kotler, page 376
Often the same product can have very different price levels depending on where in the world it is sold. A price may be higher because of shipping, tariffs, currency exchange rates etcetera.31
3.5.7 Profit- driven pricing
“Profit-driven pricing is a systematic procedure for maximizing profitability by making tradeoffs between changes in price and changes in sales volume.”
In other words the main focus when using profit-driven pricing is to keep the overall profitability. The procedure is simple and intuitive, and allows managers to make decisions even if the market response (customer demand) is uncertain and unquantifiable.
Since profit-driven pricing decisions are made depending on changes in price and changes in sales volume, many irrelevant variables that otherwise might come into context can be excluded. Focus can mainly be towards variables such as price, variable cost, incremental fixed cost and sales volume. Variables that do not need to be considered are e.g. administrative overhead and other fixed costs.
Prices have to be high enough to give a profit and yet low enough to attract customers. It is often hard to find a balance between these two perspectives.
Profit-driven pricing is about focusing on profit contribution and having knowledge of how the market will respond to changes in price. Example: if lowering a price, what volume is then needed to keep the overall profitability?
There are two perspectives, marketing’s view and the financial view:
By analyzing buyers, marketing can determine how low prices need to be to obtain the required sales objectives. On the other hand the financial department determines how high prices have to be in order to cover costs and meet the profit objectives. Often the solution is a compromise rather than having a coherent strategy. To achieve effective pricing decisions both sides have to be considered. The method that can be used is profit-driven pricing.32
31
Marketing, Armstrong & Kotler, page 382-383
32
3.6 Ishikawa diagram – a tool to illustrate a problem
An Ishikawa diagram is a tool that clarifies the reasons that results in a problem, see figure 3.7. It was first introduced at Kawasaki Steel Works in Japan by Kaoru Ishikawa in 1943 as a part of a quality improvement program.
Reason 4 Reason 1 Reason 3 Reason 6 Reason 2 Reason 5 Problem
Figure 3.7 Ishikawa diagram
After having determined the main reasons, a more detailed classification is made. Main reasons will further be broken down as an Ishikawa diagram, see figure 3.8.33
Reason 1
Figure 3.8 Detailed Ishikawa Diagram
An Ishikawa diagram is a method mostly used for finding reasons to quality problems, but the principle of the method can be applied in other types of situations to give an overview of a problem.
33
4
Company and product description
Chapter 4 contains a company description of Alfa Laval together with product descriptions of PHEs and SWHEs.
4.1 Company
description
4.1.1 History
The story of Alfa Laval begins with Gustaf de Laval, an engineer from Sweden. In 1877 he recognized the need for a centrifugal separator and began working on inventing one. In 1879 he introduced his separator to his partner Oscar Lamm and together they started AB Separator in 1883. The separator turned out to be a huge success, making AB Separator a very well known and recognized company worldwide. In 1938 one of AB Separators most important product was invented and introduced to the market i.e. the plate heat exchanger.
In 1963 AB Separator changes its name to Alfa Laval after having acquired AB Rosenblads patents in 1962. The patents were regarding the fish bone pattern that still today is used on the plates to give high turbulence and heat transfer and at the same time contribute to higher mechanical tolerance because of the many support points between the plates. The acquirement of Rosenblads patents turned out to be a major factor for Alfa Laval’s future success.34
In 1991 Alfa Laval was acquired by Tetra Pak where Alfa Laval became an independent industrial group within the Tetra Laval group. In the year 2000 there is a change in ownership and the new majority- and present owner is Industri Kapital.
4.1.2 Alfa Laval Today
Alfa Laval is a global leader in making specialized products and engineering solutions. Alfa Laval focuses on helping its customers to heat, cool, separate and transport products. Water, oil, chemicals, beverages, foodstuff, starch and pharmaceuticals are examples of products that are processed.
Today Alfa Laval has about 20,000 different customers worldwide. Tetra Pak, Bayer, BP, and Heineken are examples of some of Alfa Laval’s large global customers.
34
At the end of 2003 Alfa Laval had a total of 9,358 employees.35
Total net sales for 2003 were SEK 13,909 million and the result after tax was SEK 646 million.36
4.1.3 Organization
In 1998 Alfa Laval’s organization underwent a major reorganization. The concept was based on both centralization and decentralization. All the critical functions except marketing and sales companies were centralized. Today’s organization structure is shown in figure 4.1.
President and CEO
Finance, Legal and IT/IS
Human Resources
Corporate Development
Communications
Sales Companies Operations Process Technology Division
Equipment Division
Figure 4.1 Alfa Laval organization chart
Alfa Laval has become an organization that targets the following customer segments: - Energy
- Environmental - Food and Beverages - Comfort and Refrigeration - Water
- Biotech and Pharmaceuticals
- Chemical and other process industries
35
Presentation by Sigge Haraldsson at www.alfalaval.com
The customer segment has been separated into two divisions; Equipment Division (ED) and Process Technology Division (PTD).
The ED offers a wide variety of components to customers with well defined and regular needs while PTD offers unique process solutions. Alfa Laval provides everything from components to systems including service to its customers.
Parts & Service is an integrated function in both ED and PTD and give Alfa Laval’s customers added value such as: a secure supply of spare parts, preventive maintenance, personal training and technical support. Some spare parts are still available more than 30 years after the product itself has been taken out of production.37
4.2 The Plate Heat Exchanger
4.2.1 Background
There are many different kinds of Plate Heat Exchangers and the ones that will be a basis for this master thesis can be categorized as gasketed PHEs and SWHEs.
According to the laws of nature, heat is transferred from a warmer body to a colder one until equilibrium is at hand. There has to be a difference in temperature between the two mediums for the heat exchange to take place. The energy emitted by the hot medium is the same amount received by the cold medium except for the energy losses to the surroundings. The energy losses to the surroundings are less than 1 %.38
There are two types of heat transfer: direct and indirect. Direct heat transfer occurs when the two mediums are in direct contact with each other. Indirect heat transfer occurs when the hot and the cold mediums are separated. The indirect type of heat transfer is the kind that Alfa Laval uses for its plate heat exchangers.
The general appearance of a PHE is illustrated in figure 4.2. The main components of a PHE are: carrying bar, frame plate, plate pack, pressure plate, support column and tightening bolts. The arrows represent the flow direction of the hot and the cold medium.
37
Anders Arnell, Senior Product Manager, Alfa Laval ED
38
Figure 4.2 Plate Heat Exchanger
Depending on the number of plates that are needed for the application a frame is chosen. The more plates that are used for the application, the higher pressure will occur within the PHE and therefore the framework has to be adjusted to meet the pressure requirements. A PHE is classified as a pressure vessel and has to follow international regulations set by e.g. the European Union.
Some of the advantages with a PHE are that:
- they are smaller compared to a shell and tube solution.
- the plates that transfer the heat are very thin and give an optimal heat transfer.
- high turbulence contributes to a self cleaning effect of the plates which results in fewer process stops for an Alfa Laval customer.
- a PHE is easy to clean since it is easy to take apart.
- a PHE is a flexible product in the sense that you can add and remove the number of plates used and thereby use it for different processes.
4.2.2 Gasketed PHE
The gaskets are used to separate the plates and direct the fluids into alternate channels. To achieve a temperature transfer there has to be inlets and outlets for both a hot medium and a cold medium. The plates are corrugated in a fishbone pattern which promotes fluid turbulence and supports the plate against differential pressure, see figure 4.3.
Gasket
Fishbone Pattern
Figure 4.3 Gasketed PHE-plate
The gasketed PHE is a universally product and used in a multitude of applications. Typical uses are:
- Heating - Cooling - Condensation - Evaporation39
39 www.alfalaval.com, 2005-01-21
4.2.3 Semi-Welded Plate Heat Exchanger
The difference between the SWHE and the PHE is the plate pack. The semi-welded plate pack consists of welded channels which alternate with gasketed channels as shown in figure 4.4. This means that the SWHE is able to handle aggressive media, which floats in the welded channels instead of the gasketed ones that are not resistant.
Gasket
Welding
Figure 4.4 Semi-Welded Heat Exchanger
Typical uses are:
- Heating and cooling of petrochemicals - Cooling of sulphuric acid
- Evaporation and condensing in refrigeration plants40
40
5
RCPL-implementation within Alfa Laval today
In this chapter we will present the current situation at Alfa Laval. The intention is to show how well the RCPL-strategy has been implemented into the sales companies.
5.1 Introduction
In order to get an overview of the level of RCPL-implementation we have put together the collected empirical data with the analysis of the questionnaire and discount survey. The results are presented below.
5.2 Results from the questionnaire
The aim for this questionnaire was to get a better understanding of how well the RCPL-strategy has been implemented within the sales companies. Together with our supervisor at Alfa Laval, Per Sandberg, we made a questionnaire concerning the sales companies views of RCPL, see appendix I. We sent out the questionnaire together with a discount survey to different sales companies around the world, see chapter 5.3. The countries that are represented in the questionnaire are: Japan, Germany, Sweden, Finland, USA and Russia.
The questionnaire that was sent out had ten main questions and a couple of sub questions and the answers were of different character, see appendix I. Some of the respondents had answered the questions briefly, while others had taken more time to develop their answers. Reminders were sent out at two occasions, one before the deadline and one a couple of days after the deadline.
A summary of the replies that are relevant for our further study are listed below: 1. There are no indications that the sales companies need a change of the RCPL-level. 2. It seems that the warning-level has not been well communicated within the sales companies. The warning-level does not affect the day to day business in most of the sales companies.
3. The alarm-level has been well communicated however it does not seem to affect the day to day business to a great extent.
4. The RCPL-strategy has changed the way the sales companies work. They are positive to RCPL-pricing and the discount structure.
5. In most of the markets the customers have accepted the RCPL-strategy, even if they are more interested in net sales price than in the discount structure.
6. Variables that are important when giving discounts according to the sales companies are volume (current and potential), loyalty, competition, sales costs and sales channel. 7. Variables that have to be considered when making a RCPL-pricing model according to the sales companies are: market price, production cost, market demands and competitors pricing.
8. According to the sales companies the level of communication with the central organization is not adequate. Furthermore, they feel that their knowledge of customers could contribute to improve the RCPL-strategy.
9. The sales companies do not see a risk with a high price-level in the price list. The maximal discounts that can be given without losing credibility are between X-Y % according to the sales companies
.
5.3 Results from the discount survey
In addition to the questionnaire a discount survey was made to find out how much discount the sales companies give to different types of customers and for different types of products. The warning- and alarm-level that the sales companies use was also asked for. The products that are included in the discount survey are standard configurations of PHEs and SWHEs which will result in a high volume product. See appendix II for the survey that was sent out.
The outcome of this survey was not as complete as we wanted it to be. Even though we did remind the sales companies a number of times we still lack some of the discount levels given for different products and different types of customers. The insufficient answers on the survey was surprising to us since we expected that the sales companies had better overview of the discount levels given to different types of customers and products.
Even if the sales managers in some way estimated the numbers instead of having the 100 % correct data we believe that they have enough knowledge about their discount structures that we can make the conclusion that the discount levels for the different customer groups look like. The result is shown in figure 5.1; there can still be some deviation because of the fragmentary material that was collected.
X %
Y %
Z %
Figure 5.1 Discount levels intervals according to discount survey
To verify the discounts that were collected from the sales companies, we gathered the corresponding figures from a business controller41. The figures that were collected came from the new sales system, One4AL, which only is applied in Europe so far. The old system did not collect discount data. The discounts that were provided from the One4AL-system are on a more general level than the specified products that was analysed in the discount survey. Even if the figures are more general we see that the One4AL discount levels are about the same levels as the figures collected from the survey.
A risk that may surface with global pricing is that the price variations and culture differences results in a need of a very high price level which in turn require very high discount levels. A very high price may act as a deterrent to some customers and a very high discount level can undermine the reliability of a company’s pricing strategy. Global customers might get different prices on the same product depending on what market you are in. For global customers you need to establish discount levels that are used globally so that the customers pay the same price no matter where in the world they are.
5.4 Discussion of the present situation
By looking at the results from the questionnaire it can be determined that the RCPL-strategy has been reasonably well implemented within the sales companies. There seems to be an understanding and acceptance of the RCPL-strategy. However we do not see that the sales companies have applied the RCPL-strategy to its full extent. The net sales prices are still in focus and the cost-plus-thinking still seems to be a part of the working process. The level of implementation is shown in figure 5.2.
41
Initiation Understanding Acceptance Applied practically
Cost-plus Value-based
Alfa LavalImplementation phase
Figure 5.2 The level of implementation at Alfa Laval
Furthermore, there is a need to increase the level of communication since there is a lack of information flow in both directions between the central organization and the sales companies as shown in figure 5.3.
Central Organization
Sales Companies
Customer
Figure 5.3 Flow of communication within Alfa Laval
We are under the impression that the central organization needs to improve the guidelines concerning the discount structure in order to create the opportunity for the sales companies to use the RCPL-strategy to its full extent. The sales companies do not seem to keep track of the discount levels given to different types of customers and for different products. The follow-up of the discount data needs to be improved since it will help Alfa Laval to improve the understanding of their customers.
There need to be more focus on the discount structure and to accomplish this there has to be greater incentives e.g. a salesman’s performance can be related to the discount levels he gives.
6
Pricing strategies at other Swedish export
companies
The aim for this chapter is to describe how similar Swedish export companies handle their pricing- and discount strategies compared to Alfa Laval.
6.1 Introduction
We have conducted a benchmarking on three Swedish export companies to see how they handle their international pricing. The benchmarking was made through semi-structured phone interviews and the companies that are included in the research are Sandvik, Atlas Copco and Trelleborg AB. The reason that we chose these companies are that they represent industrial companies selling mature products on a global market.
6.2 Sandvik
Mining and Construction
Sandvik Mining and Construction sell products that have been sold for a long time i.e. mature products according to the PLC. This result in a great knowledge about the price the customers are willing to pay. Sandvik use this knowledge to adjust the price of the products to the market price level. Even if the price is not set according to cost, they always have the cost in mind when the prices are set. Prices of new products are set in relation to existing ones.
Some market segments have price lists for different regions i.e. different continents, while others have pricelists for each country. Only the after market sales segment have a global pricelist.
The discount structure is mostly based on volume but in some occasions when a customer is doing business with different market segments the customer is considered as loyal and is given higher discounts. The discounts that are given for a product can be different depending on in which region it is sold. Sometimes discounts for a product can be 0-60 % in one region while the same product is sold at a 0-30 % discount in another.42
42
6.3 Atlas Copco Compressor
Atlas Copco Compressor considers the market price when setting the prices of their products, even though they add a percentage to the factory transfer price to get the Swedish market price.
At the present moment, Atlas Copco is developing a joint European price list instead of country divided price lists.
Atlas Copco uses discounts depending on sold volume and if there are any general agreements etcetera.43
6.4 Trelleborg
AB
Trelleborg AB has two different sales approaches depending on the kind of customers. The products can be sold directly to manufactures or through the after market sales to wholesalers.
The after market sales uses regional gross price lists for each country. These prices are adapted to market level but the cost is also taken into consideration. After market sales use discounts when selling products; a typical wholesaler gets 0-40 % discount. Since tractor tires are very ungainly products and are difficult and expensive to transport, customers are not able to take advantage of the different price levels in different countries.
When doing business with manufacturers of tractors Trelleborg AB set prices more accordingly to a cost-plus strategy than the after market sales does. Every sales opportunity has its own negotiation and there is no printed list to consider, instead a net price list is used to calculate the total sale price. With these customers, Trelleborg AB tries to coordinate the sales in order to have the same price for the international customers regardless of which region they act in.44
6.5 Results from benchmarking
The companies in the benchmarking all look at market price levels and most of them are familiar with having a discount structure. However, there are many indications that the cost still is the main driver behind the pricing decisions.
43
Stefan Björnmark, Atlas Copco Compressor 2005-01-05
We are under the impression that Alfa Laval in many ways is more value-based driven in its pricing-strategy compared to the other companies in the study. This is probably the result from having focused on the RCPL-strategy during the last couple of years.
In figure 6.1 we have estimated and tried to mark out in what extent the companies use value as a price driver. The estimation is based on our perception of the present situation and the phone interviews that were conducted.
Cost-plus Value-based
Trelleborg AtlasCopco Sandvik Alfa Laval
7
Creating a logical pricing model
This chapter describes the background and the development of the logical pricing model together with analysis of the test results.
7.1 Introduction
From discussions with our supervisor Per Sandberg a need for having a model that logically would indicate an RCPL-price for a new PHE was identified. The idea behind the model is that a user will be able to enter a few data about the new PHE and that the model will calculate an RCPL-price that will be logically priced in comparison to other PHEs. Further usage for the model will be to indicate if already existing products have been priced logically, and if this is not the case then the model can be used to motivate a change in the RCPL-price for these products.
7.2 Factors that need to be considered when setting an
RCPL-price
From discussions and interviews with our supervisor and other employees at Alfa Laval we have listed possible factors that come into consideration when setting an RCPL-price:
1. Prices of already existing similar products
2. Customer savings- how much does it save for the customer? 3. Prices of competitors products
4. Quality in comparison to competitors
5. User friendly- Easy to use, easy to clean, easy to repair? 6. Aftermarket- accessibility to spare parts
7. Service e.g. technical assistance
8. Environment- what kind of culture, level of competition 9. Phase in the PLC
10. Delivery- delivery time, delivery safety
The list of factors can be made very long, however the ones listed above are examples of what can be considered when setting a price of a new PHE. These factors are illustrated in an Ishikawa diagram in order to make it easier to grasp, see appendix V. Note that
existing PHEs and then adjust the price with other factors e.g. factor 2-10.
We have decided not to further investigate the influence of factors 2-10 since the main focus will be towards creating the logical pricing model by using factor 1. However, factors 2-10 in the Ishikawa diagram can be used a complement to the logical pricing model.
7.3 Finding a logical RCPL pricing model for new PHEs
The idea of creating a logical pricing model for new PHEs is to find logical relations for already existing PHEs. Those relations will be used when the RCPL-price for a new PHE is set i.e. the logical pricing model is based on a joint logic of already existing PHEs.
In order to find logical relations we had to brake down the PHE in its main components.
PHE
FRAME (FM,FG,FD,FS)
CONNECTION PLATE GASKET
LT (tightening bolt) LC (carrying bar) SC (support column) FRAME PLATE PRESSURE PLATE UNLINED PIPE RUBBER LINING SHEET LINING SS SHEET LINING Ti GPHE SWHE 304 316 Ti 316 Ti NBRB NBRP EPDMC CR
Figure 7.1
The
breakdown structure of a PHEAs figure 7.1 shows, the database for a PHE will be broken down into four main components i.e. frame, connection, plate and gasket.
Frame
A frame mainly consists of tightening bolts, carrying bar, support column, frame plate and pressure plate. These components are considered when the weight is calculated for the PHE. Furthermore the frame is divided into FM, FG, FD, FGR, FDR and FS. The