SKI Report 02:2
R2/R0-WTR Decommissioning Cost
Comparison and Benchmarking Analysis
Dr. Geoff Varley
Mr. Chris Rusch
October 2001
Background
Assuring appropriate financial contributions to the Swedish Nuclear Waste Fund is crucial for
the sustainability and long term credibility of the financing system that underpins Sweden’s
nuclear waste liabilities. A deficit situation may be at risk if the level of accruals to the fund
becomes insufficient in relation to future disbursements. Hence, it is important that provision
to the fund accurately reflects the real cost of performing the necessary work in the future.
SKI is conducting pro-active work by way of studies on some major cost groups, in order to
reduce the uncertainties in the estimated costs of these program elements and thereby to
mitigate the risk of creating a deficit in the Swedish Nuclear Waste Fund. The
decommissioning cost for older research reactors is one of the major cost areas where scrutiny
in more depth is warranted.
Purpose of the project
At present there is very limited empirical data from work within Sweden that is pertinent to
estimating decommissioning costs for Swedish research reactors. Therefore, newer and better
estimates of decommissioning costs for such reactors needs to be derived to enhance the
quality of capital budgeting and planning.
Accordingly, the prime objective of this study has been to acquire detailed empirical
information on the resources expended in actual decommissioning programs for pertinent
research reactors elsewhere. A secondary objective has been to collect, analyse and present
data in a more structured way, in order to provide a meaningful, quantitative basis for future
cost comparisons and the development of more accurate cost estimates for the Swedish
research reactors.
Results
The report presents analyses of selected discrete work packages within the decommissioning
program of the Westinghouse Test Reactor (WTR) at the Westinghouse Waltz Mill site near
Pittsburgh in Pennsylvania. WTR decommissioning was completed in mid-2001 and
accordingly is a valuable, contemporary reference in a generic sense. It also has many
similarities to the Studsvik R2/R0 research reactor in Sweden.
The WTR work packages were in eight fields, ranging from reactor vessel and internals
dismantling to project management, licensing and engineering. The detailed raw data has been
normalised into resources needed on a unit basis, e.g. per cubic meter, per metric ton and per
unit of equipment, for selected parts of the decommissioning program. The principal results of
this study represent a first step towards developing premium benchmarking data for
The report identifies the need for future studies concerning the development of non-monetary
estimates, e.g. labour hours expected, to facilitate pan-European and/or international
comparisons. This non-monetary approach has the intrinsic benefit of mitigating external
effects from exchange-rate fluctuations and exchange-rate conversions, as well as differences
in fundamental economic conditions from country to country, hereby facilitating the
comparison of cost estimates between different countries and/or geographical areas. In the
short run this may contribute to better understanding of the major cost-drivers in the
decommissioning process.
Effects on SKI work
SKI will be able to draw inferences from this study in the ongoing monitoring of the yearly
cost estimates presented by the company AB SVAFO. The results of the study will also be
pertinent to the yearly review of the cost estimates of SKB´s programme.
Project information
At SKI Staffan Lindskog and Bengt Hedberg have been responsible to supervise and
co-ordinate the project.
SKI Report 02:2
R2/R0-WTR Decommissioning Cost
Comparison and Benchmarking Analysis
Dr. Geoff Varley¹
Mr. Chris Rusch²
¹NAC International
6 Brampton Chase
Lower Shiplake
Henley-on-Thames RG9 3BX
England
²NAC International
655 Engineering Drive
Norcross, Georgia 30092
USA
October 2001
This report concerns a study which has been conducted for the Swedish Nuclear Power Inspectorate (SKI). The conclusions and viewpoints presented in the report are
Contents
1. Introduction...1-1
2. Comparison of R2 and WTR ...2-1
2.1 Basic Assumptions and General Information for the Comparison ...2-1 2.2 Reactor Vessel and Internals Dismantling...2-1 2.2.1 Definition of the Task...2-1 2.2.2 Labour Hours, Labour Cost, Work Week and Productivity...2-3 2.2.3 External Costs ...2-4 2.2.4 Waste Volumes and Cost...2-4 2.2.5 Total Costs ...2-5 2.2.6 Normalised Resources and Comparison...2-5 2.2.6.1 Basic Data ...2-7 2.2.6.2 Analysis of WTR Vessel Removal Costs...2-7 2.2.6.3 Analysis of WTR Vessel Segmentation Costs...2-8 2.2.6.4 Comparison with R2 Segmentation and Removal...2-8 2.3 Dismantling of the Bioshield ...2-10
2.3.1 Definition of the Task...2-10 2.3.2 Labour Hours, Labour Cost, Work Week and Productivity...2-11 2.3.3 External Costs ...2-12 2.3.4 Waste Volumes and Cost...2-12 2.3.5 Total Costs ...2-13 2.3.6 Normalised Resources and Comparison...2-13 2.3.6.1 Transport and Disposal ...2-14 2.3.6.2 Dismantling...2-14 2.4 Dismantling Primary Coolant Piping ...2-15
2.4.1 Definition of the Task...2-15 2.4.2 Labour Hours, Labour Cost, Work Week and Productivity...2-15 2.4.3 External Costs ...2-15 2.4.4 Waste Volumes and Cost...2-15 2.4.5 Total Costs ...2-16 2.4.6 Normalised Resources and Comparison...2-16 2.5 Electrical Equipment Removal...2-17
2.5.1 Definition of the Task...2-17 2.5.2 Labour Hours, Labour Cost, Work Week and Productivity...2-17 2.5.3 External Costs ...2-18 2.5.4 Waste Volumes and Cost...2-18 2.5.5 Total Costs ...2-18 2.5.6 Normalised Resources and Comparison...2-18 2.6 Project Management, Engineering and Licensing ...2-19
2.6.1 Definition of the Task...2-19 2.6.2 Hours, Cost, Work Week and Productivity ...2-20 2.6.3 External Costs ...2-21 2.6.4 Waste Volumes and Cost...2-21 2.6.5 Total Costs ...2-22
2.7 Packaging, Transportation and Disposal of Radioactive Concrete and Reactor Components ...2-22 2.7.1 Radioactive Concrete Definition ...2-22 2.7.2 Reactor Components Definition ...2-23 2.7.3 Packaging, Transportation and Disposal of Radioactive Concrete ...2-23 2.7.4 Packaging, Transportation and Disposal of Reactor Components...2-24 2.7.5 Normalised Resources and Comparison...2-25 2.8 Dismantling of Ancillary Facilities (Sub-pile Room) ...2-25
2.8.1 Definition of the Task...2-25 2.8.2 Labour Hours, Labour Cost, Work Week and Productivity...2-26 2.8.3 External Costs ...2-26 2.8.4 Waste Volumes and Cost...2-26 2.8.5 Total Costs ...2-27 2.8.6 Normalised Resources and Comparison...2-27 2.9 Conclusions ...2-27
2.9.1 General...2-27 2.9.2 Dismantling Comparisons ...2-29 2.9.2.1 WTR Dismantling Benchmark Data...2-29 2.9.2.2 Reasonableness of the R2 Dismantling Hours Estimate...2-29 2.9.3 Overall Reasonableness of the R2 Estimate...2-30
Appendix A ... A-1
Appendix B ... B-1
Tables
Table 2.1 Labour Hours and Associated Costs (2000 currency values)...2-3 Table 2.2 External costs (MSEK - Year 2000) ...2-4 Table 2.3 Cost of Waste Disposition for Reactor Vessel (MSEK - Year 2000)...2-4 Table 2.4 Total Costs for Vessel Removal and Disposal (MSEK - Year 2000)...2-5 Table 2.5 Selected Key Data for Reactor Vessel Removal and Disposal (SEK per unit) ...2-5 Table 2.6 Labour Hours and Associated Costs (2000 currency values)...2-11 Table 2.7 External costs (MSEK - Year 2000) ...2-12 Table 2.8 Cost of Waste Disposition for Bioshield Concrete (MSEK - Year 2000)...2-13 Table 2.9 Total Costs for Bioshield Dismantling (MSEK - Year 2000)...2-13 Table 2.10 Normalised Costs for Bioshield Dismantling (SEK per unit) ...2-13 Table 2.11 Labour Hours and Associated Costs (2000 currency values)...2-15 Table 2.12 Cost of Waste Disposition for Primary Coolant Piping Removal (MSEK - Year 2000)2-16 Table 2.13 Total Costs for Primary Coolant Piping Removal (MSEK - Year 2000) ...2-16 Table 2.14 Normalised Costs for Primary Coolant Piping Removal (SEK per unit)...2-16 Table 2.15 Labour Hours and Associated Costs (2000 currency values)...2-17 Table 2.16 Total Costs for Electrical Equipment Removal (MSEK - Year 2000) ...2-18 Table 2.17 Normalised Costs for Electrical Equipment Removal (SEK per unit)...2-18 Table 2.18 Hours and Associated Costs (2000 currency values)...2-20
Table 2.19 Total Costs for Project Management, Licensing & Engineering (MSEK - Year 2000)2-22 Table 2.20 Transportation Modes for Radioactive Concrete ...2-23 Table 2.21 Transportation Modes for Reactor Components...2-24 Table 2.22 Total Costs for Disposal, Packaging and Transportation (SEK per unit - Year 2000)2-25 Table 2.23 Labour Hours and Associated Costs (2000 currency value) ...2-26 Table 2.24 External costs (MSEK - Year 2000) ...2-26 Table 2.25 Waste Costs for Sub-pile Room D&D (MSEK - Year 2000)...2-26 Table 2.26 Total Costs for Sub-pile Room D&D (MSEK - Year 2000) ...2-27 Table 2.27 Normalised Costs for Sub-pile Room D&D (SEK per unit) ...2-27 Table 2.28 Summary of WTR Dismantling Benchmark Results ...2-29 Table 2.29 Derived Labour Estimates for R2 using WTR Benchmarks (Percentages of R2
Dismantling Labour Hours) ...2-30
Figures
FIGURE 2.1 Lifting the Tank with the 600 Ton Jacking Tower ...2-3 FIGURE 2.2 Removing the Biological Shield...2-11
1. Introduction
Statenskärnkraftinspektion (SKI) charged NAC International with the task of determining whether or not the decommissioning cost estimates of R2/R0 (hereafter simply referred to as “R2”) and Ågesta research reactors are reasonable. The associated work was performed in two phases. The objective in Phase I was to make global
comparisons of the R2 and Ågesta decommissioning estimates with the estimates/actual costs for the decommissioning of similar research reactors in other countries. In January 2001, the Phase I results were presented in the report, "Comparisons of Cost Estimates for the Decommissioning of Nuclear Research Reactors".
This report presents the results of the Phase II investigations.
Phase II focused on selected discrete work packages within the decommissioning program of the WTR reactor. To the extent possible a comparison of those tasks with estimates for the R2 reactor has been made, as a basis for providing an opinion on the reasonableness of the R2 estimate. The specific WTR packages include:
reactor vessel and internals dismantling biological shield dismantling
primary coolant piping dismantling electrical equipment removal waste packaging
transportation and disposal of radioactive concrete and reactor components project management, licensing and engineering
removal of ancillary facilities
The specific tasks were characterised and analysed in terms of fundamental parameters including
task definition
labour hours expended labour cost
labour productivity length of work week working efficiency
working environment and impact on job execution
external costs (contract labour, materials and equipment) total cost
waste volumes
waste packaging and transport costs
Based on such detailed raw data, normalised unit resources (e.g. per cubic meter, per MT, per unit of equipment) have been derived for selected parts of the
decommissioning program, as a first step towards developing benchmarking data for D&D activities at research reactors.
2.
Comparison of R2 and WTR
2.1
Basic Assumptions and General Information for
the Comparison
The Swedish Crown is the currency used in this report. The WTR decommissioning work occurred principally during mid-1999 and mid-2001 with the majority of the expenditures falling in the later half of this time period. Therefore, the SEK-U.S. dollar exchange rate for December 2000 (SEK9.78 per dollar) was selected. The basis for selecting one exchange rate is that the financial information gathered will not permit a time-value of money calculation on a monthly basis.
Two subcontractors performed the majority of the work. The labour subcontractor was Washington Group International, Inc. (hereinafter referred to as "WGI") that was formed in July 2000 through the acquisition of Raytheon Engineers & Constructors by Morrison Knudsen Corporation. The health physics contractor was GTS (formerly GTS Duratek), which performed radiation control activities including access control, radiation work permit compilation, health physics monitoring, final radiation surveys and packaging waste for shipment.
There was no high or intermediate level radioactive waste associated with the entire WTR D&D project; therefore, all radioactive waste from D&D operations is low-level waste.
2.2
Reactor Vessel and Internals Dismantling
2.2.1 Definition of the Task
In terms of component removal, reactor vessel and internals dismantling was the most significant activity of the WTR decommissioning program. The task was separated into subtasks including:
Conceptual and final engineering for vessel removal and transport. This task was performed by WGI. The original plan was to have Westinghouse Nuclear Service Division (NSD) engineers design the removal and transport of the reactor vessel but as the project progressed it was determined that NSD did not have the manpower for this effort and so WGI provided engineering design and subcontracts.
Stabilisation of the reactor internals to ensure that internals remain in a safe and stable condition during rigging, removal and transport.
Decontamination and removal of the reactor vessel top head lifting frame; structural steel platforms, stairs and handrails; reactor head stand and head stand platform; and a pre-cast concrete pipe chase.
Erection of the Hake Engineering equipment (figure 2.1) and removal, packaging and transport of the reactor vessel as a one-piece assembly to the railroad spur as follows:
1. Reinforcing/shoring the truck lock platform to support the weight of the reactor vessel, down- ending (rotating the vessel from the vertical to a
horizontal position) sled, and saddle during down-ending and removal through the truck lock door.
2. Attaching lifting trunions to the top of the reactor tank.
3. Staging and erection of the lifting tower (Hake equipment) inside the containment.
4. Rigging the reactor vessel for lifting.
Lifting the reactor vessel in order to modify the existing lower vessel supports for use as supports/pivoting lugs.
Erecting the down-ending sled and transfer system.
Performing an initial weight and load test of the lifting system.
Lifting, down-ending and removing the reactor vessel through the truck lock door. Placing the reactor tank in a protective barrier on a fabricated skid mounted on a
transport vehicle.
Preparing and packaging of the reactor vessel for shipping including obtaining all necessary permits.
Transporting the reactor vessel to the rail spur for shipment to Alaron (subcontractor who segmented the vessel and disposed of the segments at the Envirocare LLW facility in Clive, Utah, which is one of two operating LLW facilities that is open to all generators of LLW in the U.S. - hereafter referred to as “Envirocare”).
FIGURE 2.1 Lifting the Tank with the 600 Ton Jacking Tower
2.2.2
Labour Hours, Labour Cost, Work Week and Productivity
Table 2.1 lists the labour hours and associated costs expended by the principal contractors, broken down by main task area. Table 2.1 excludes the costs associated with major subcontract labour, consumables and other materials, equipment and supplies.
Table 2.1 Labour Hours and Associated Costs (2000 currency values)
Task / Category Hours Labour Cost (MSEK)
SEK per Hour
WGI - Engineering for vessel removal and
transport 5,724 5.1802 905.0
WGI labour - Removal of interference 2,575 0.9386 364.5
GTS health physics - Removal of interference 2,436 1.0377 426.0
WGI Labour - Remove & ship vessel 4,645 1.7160 369.4
GTS health physics - Remove & ship vessel 2,049 0.7957 388.4
Appendix A lists the labour categories for WGI craft labour, GTS health physics, WGI engineering and Westinghouse engineering. The SEK per hour rate in table 2.1 for WGI labour is consistent with a base craft labour rate of just under SEK 300 per hour ($30 per hour). The average effective WGI labour rate in table 2.1 exceeds SEK 300 per hour because the rate includes supervisor hours and program management hours that can be assigned to a specific job rather than the general overhead category of program management for the WTR D&D program. This applies to subsequent
WGI labour rates listed in this report.
Hake Engineering had a time constraint that caused the project to be worked 10 hours per day. In terms of efficiency, this proved to be valuable because Hake was interested in finishing the project as soon as possible and consistently pushed WGI staff such that there was little downtime during the vessel removal and transport project.
The bioshield with contaminated and irradiated concrete was removed prior to the major vessel work so there were no abnormal or unexpected radiation problems that impacted productivity.
2.2.3 External
Costs
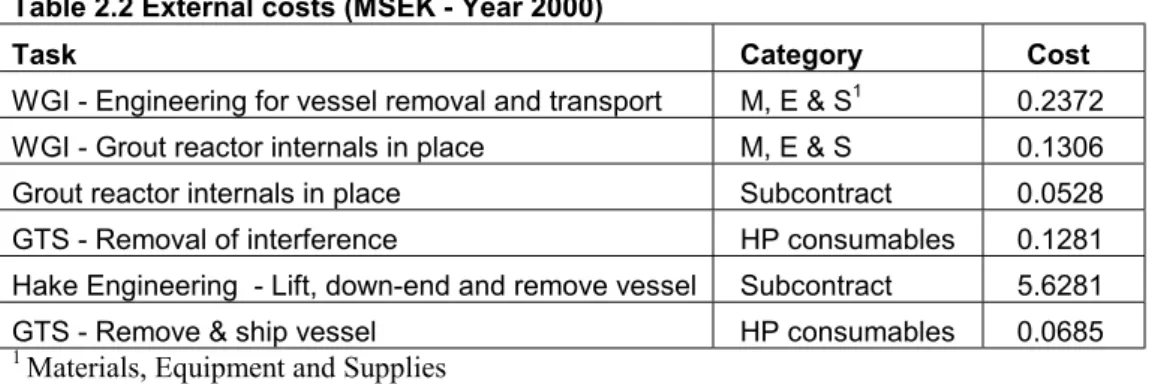
The vessel removal project involved considerable external costs as noted in table 2.2. The cost of waste disposition is listed in section 2.2.4.
Table 2.2 External costs (MSEK - Year 2000)
Task Category Cost
WGI - Engineering for vessel removal and transport M, E & S1 0.2372
WGI - Grout reactor internals in place M, E & S 0.1306
Grout reactor internals in place Subcontract 0.0528
GTS - Removal of interference HP consumables 0.1281
Hake Engineering - Lift, down-end and remove vessel Subcontract 5.6281
GTS - Remove & ship vessel HP consumables 0.0685
1 Materials, Equipment and Supplies
The major external cost was the subcontract with Hake Engineering to remove and transport the vessel. The other external costs were relatively minor by comparison.
2.2.4
Waste Volumes and Cost
The main waste component of the vessel removal project was the vessel itself, which was delivered in one piece (112.04 MT) to the disposal contractor (Alaron) which segmented the vessel and transported the segments to Envirocare. Table 2.3 contains the pertinent information.
Table 2.3 Cost of Waste Disposition for Reactor Vessel (MSEK - Year 2000)
Task Waste Processing Transport Containers
Removal of interference 2.2205 0.1689 0.0525
Remove, segment & ship segments to Envirocare – Subcontract
7.2976 0.29341
Remove & Ship Vessel - misc. waste 0.1166
The major waste volume cost is the expenditure for the services of Alaron who segmented the vessel, shipped the segments to Envirocare and paid for final disposal at the Envirocare facility. The shipment of the vessel from WTR to the Alaron facilities was handled by MHF logistics.
Detailed information regarding containers is addressed in section 2.7.
2.2.5 Total
Costs
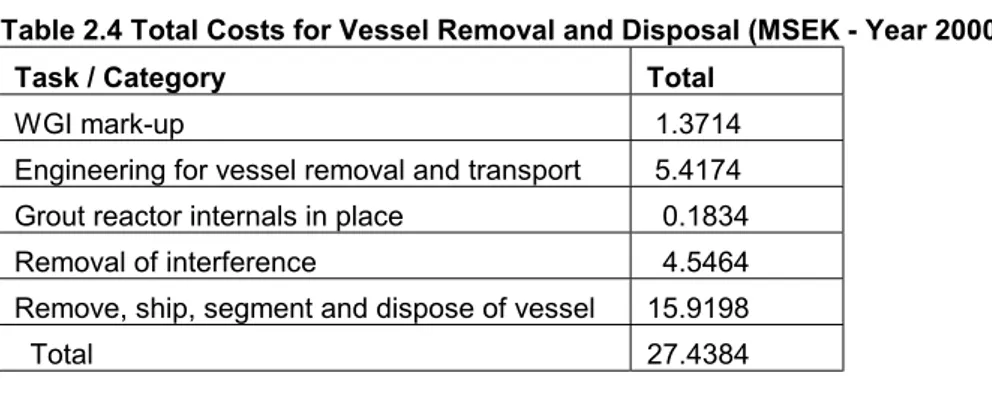
Table 2.4 summarises total costs based on the information in sections 2.2.2 through 2.2.4 but with a mark-up on WGI labour, materials, equipment and supplies and WGI subcontracts, that averages about 10 percent.
Table 2.4 Total Costs for Vessel Removal and Disposal (MSEK - Year 2000) Task / Category Total
WGI mark-up 1.3714
Engineering for vessel removal and transport 5.4174
Grout reactor internals in place 0.1834
Removal of interference 4.5464
Remove, ship, segment and dispose of vessel 15.9198
Total 27.4384
2.2.6 Normalised
Resources and Comparison
Table 2.5 lists selected key man-hour and other expenditure data for the major functions in the WTR reactor vessel removal project. The table also indicates the comparable estimated rates for R2 D&D work.
Table 2.5 Selected Key Data for Reactor Vessel Removal and Disposal (SEK per unit) WTR Task Category WTR Unit Cost R2
Equivalent Unit Cost
General WGI Craft Labour Rate 293.4 per hour 570 per hour
WGI Rate 364.5 – 369.4 per hour 570 per hour
GTS Health Physics Rate 388.4 – 426.0 per hour 700 per hour
Transport of vessel to Alaron 2.62 per kg 1
Segmentation of vessel at Alaron 28.47 – 39.47 per kg
-Transport of segmented waste to
Envirocare 1.68 per kg
1
Final disposal of vessel segments 21 - 32 per kg 160 per kg1
1 Disposal in CLAB then SFL @ SEK 160 per kg and transportation (first to CLAB then to SFL) @ SEK 50 per kg
The unit cost of disposal for R2 is considerably higher than that of WTR. The difference undoubtedly is based on the difference in facilities. CLAB and SFL are highly engineered facilities in underground granite vaults. The Envirocare facility is
basically a landfill in open desert west of Salt Lake City, Utah at which radioactive waste is disposed of in shallow-land burial trenches. It has a remaining capacity of 11,326,800 cubic meters, which is eight times the forecast needed capacity for the next 60 years for all U.S. reactors. Therefore, volume and quantity are not an issue at Envirocare compared with CLAB or SFL where space is valuable.
The decommissioning estimates for R2 indicate that the reactor vessel is to be segmented on-site followed by the demolition of activated concrete. In contrast, the WTR vessel was removed as one piece and shipped to Alaron (a distance of about 70 km). Alaron decontaminated the metal, segmented the vessel and shipped the pieces to Envirocare. The WTR reactor vessel was removed after much of the radioactive concrete was removed.
Removal of the WTR reactor vessel required about two months. The reactor
segmentation required four months and the demolition of activated concrete about 6 months. The technology for dismantling that is planned to be used at R2 is quite similar to that actually used at WTR, as noted below:
The removal of concrete layers and blocks is to be performed using similar technologies; demolition and component removal equipment may include jackhammers, hoe rams, concrete saws, diamond wire saws or cutting torches. Surface decontamination methods will include strippable coatings, scrubbing or
pressurised water (at various pressures - power wash, hydrolaser or ultra high pressure [2.812 million g per cm2]).
Temporary services will be installed on an as-needed basis as dismantling proceeds (ventilation, water, lighting and power).
However, as stated, the overall approach to dismantling is quite different, which complicates any cost comparison. Furthermore, WTR segmentation costs can only be estimated, because the subcontractor (Alaron) provided a fixed bid for vessel
segmentation plus transportation to disposal at Envirocare. The segmentation estimate is approximately SEK 31to 42 per kg. There is significant fixed cost associated with setting up to segment a vessel regardless of location and size. In the case of WTR, Alaron constructed a large tent enclosure that provided containment. The segmentation tooling was located in the containment and access was restricted to ensure that radioactive contamination was not spread.
In spite of all these drawbacks, an analysis of the WTR vessel removal and
segmentation costs has been performed, in order to derive first order benchmarking estimates for these activities. The analysis excludes transportation and disposal activities, because these typically are very dependent on the national and local conditions of the country concerned.
2.2.6.1 Basic Data
P
RINCIPALC
ONTRACTORL
ABOUR 5,724 hrs @ engineering rates for removal and transport – estimate 5,000 hrs excluding transport related activities
4,645 hrs @ average dismantling team rates
2,575 hrs @ average dismantling team rates for removal of interference 2,436 hrs HP&S rates removal of interference
2,049 hrs HP&S rates removal and shipping (say 85% just for removal)
H
AKEE
NG. S
UBCONTRACTH
OURSMSEK 5.6281 subcontract for lift, down-end and removal of vessel @ estimated SEK500/hr equivalent = 11,256 hrs.
O
THERE
XTERNALC
OSTS MSEK 0.3678 M,E & S
MSEK 0.0528 Grout subcontract
MSEK 0.1966 HP consumables
MSEK 0.6172 Total
2.2.6.2 Analysis of WTR Vessel Removal Costs
11,400 hrs @ average dismantling team rates
5,000 hrs principal contractor engineering premium rates for removal External contractor hours for removal ~ 11,000 hrs
Other costs MSEK 0.6
Overall about 22,000 hrs for removal at normal team rates plus additional 22 percent of hours at premium engineering rates.
Part of the cost will be fixed irrespective of vessel size and part of the cost will be sensitive to vessel size. Therefore a simple conversion to a unit cost per kg, or per m3 or per m2 is not necessarily meaningful. An alternative analysis follows:
5,011 hrs for removal of interference and related HP&S proportional to vessel volume
5,000 (est.) engineering hours fixed
6,390 internal hours on removal 2/3 fixed and 1/3 proportional to vessel volume 11,000 external Hake hours 2/3 fixed and 1/3 proportional to vessel volume Other external costs of MSEK 0.6 fixed
This gives the following picture:
11,590 hrs fixed + V hrs/m3 @ average dismantling team rates (where V = 10,807/ WTR vessel volume hrs/m3 = 10,807/46.5 = 232 hrs/m3)
5,000 hrs at premium engineering rates (fixed) Other external costs of MSEK 0.6 (fixed)
2.2.6.3 Analysis of WTR Vessel Segmentation Costs
The total WTR cost for vessel segmentation and two transport legs (one from the reactor site to Alaron and one from Alaron to Envirocare) plus disposal, was the equivalent of $746,172. With a vessel weight of 112,040 kg this translates to a unit cost of SEK65.12/kg. The segmentation proportion of this is estimated at SEK 28.5 to 39.5 per kg, or in total for 112,040 kg approximately MSEK3.2 to MSEK4.4. At an average labour rate of SEK400/hr, this translates to approximately 8,000 to 11,000 hrs. Making the assumption that 1/3 of the segmentation cost is fixed and 2/3 is proportional to the size (surface area) of the vessel, a fixed component of 2,670 to 3,670 hrs is derived, plus a variable component of 67 to 92 hrs/m2 of vessel surface area (assumed to be the relevant measure for cutting activity).
2.2.6.4 Comparison with R2 Segmentation and Removal
The R2 estimate does not provide a breakdown of costs in sufficient detail to make a direct comparison of vessel removal and segmentation costs. Furthermore, the R2 vessel will be segmented before removal, so the approach is not the same as at WTR. As a first comparison, the WTR benchmarking numbers may be applied to the R2 vessel characteristics to obtain an idea of reasonableness in the context of the overall R2 estimate.
R
EMOVALC
OST R2 average dismantling team labour rate = 75% @ 570 + 25% @ 700 (HP&S) = SEK600/hr
R2 engineering labour rate = SEK800/hr (estimate)
Applying the WTR formula, (11,590 hrs x 600 SEK/hr) + 600,000 = MSEK7.554 incl. ext. other costs.
Add 5,000 hrs x 800 SEK/hr = MSEK4.0 fixed engineering cost
V x R2 vessel Volume x 600 SEK/hr = 232 x 10.3 x 600 = MSEK1.43 variable dismantling team cost
Total is MSEK13.0
Removal at R2 should be a lot cheaper, because a lot of the engineering work related to lifting a large, heavy object would not be needed. It would not seem unreasonable for the R2 removal cost to be approximately half of the number derived using WTR benchmarking data, or MSEK6.5. This might comprise MSEK 0.6 of fixed external costs and 8,500 hours at average dismantling team labour rates and approximately 1,000 hours of engineering effort. On this basis the benchmarking data would be as follows:
(7,048 hrs x 600 SEK/hr) + 600,000 = MSEK 4.83 incl. ext. other costs. Add 1,000 hrs x 800 SEK/hr = MSEK 0.8 fixed engineering cost
V x R2 vessel Volume x 600 SEK/hr = 141 x 10.3 x 600 = MSEK 0.87 variable dismantling team cost
Total is MSEK 6.5
A detailed method statement would have to be developed and analysed in order to reach a more rigorous and robust conclusion.
S
EGMENTATIONC
OSTAt R2 segmentation will take place in situ, under water. At WTR this activity was performed off-site inside a purpose built tent structure. The working environment at R2 almost certainly will add considerably to the segmentation cost. Adding 50% to the WTR benchmarking costs gives for R2:
4,000 to 5,500 hours fixed
100 to 138 hours per m2 variable cost and an R2 surface are of 27 m2 for a total effort of approximately 2,700 to 3,700.
Total hours of 6,700 to 9,200 at SEK 600/hr average for a total activity cost of MSEK4 to MSEK5.5.
C
OMBINEDS
EGMENTATION ANDR
EMOVALThe R2 project estimate includes for decontamination and dismantling activities 80,000 craft labour hours and 35,000 hours on engineering, licensing etc.
The above rough estimates for R2 indicate a requirement of approximately 15,000 to 17,500 hours of craft labour and 1,000 hours of dedicated engineering effort.
Additional engineering effort might be applicable related to planning and licensing etc. The estimate for craft hours needed corresponds to about 20 per cent of the total R2 budget estimate for craft labour.
Comments on the reasonableness of this estimate are made in section 2.9, in a broader context that pulls together costs for several of the major dismantling activities.
2.3 Dismantling
of the Bioshield
2.3.1 Definition of the Task
In terms of dismantling work, this project was notable because the project involved the removal of the largest volume of material. Figure 2.2 illustrates the process of bioshield removal. The task included:
Instructions for diamond wire cutting of the concrete bioshield that surrounds the reactor vessel
Locating and drilling the wire feed holes Locating the wire saw and hydraulic units The supply of a water/slurry control system. Diamond wire cutting of the concrete bioshield.
Disposal of the concrete bioshield blocks at Envirocare. The following support activities:
1. Securing the loose surface contamination on the reactor vessel. 2. Capping and plugging all penetrations on the reactor vessel. 3. Installing permanent shielding around the core region. 4. Cutting, trimming and capping the neutron beam hole. 5. Rigging and removal details of the concrete blocks. 6. Removal of structural platforms.
FIGURE 2.2 Removing the Biological Shield
2.3.2
Labour Hours, Labour Cost, Work Week and Productivity
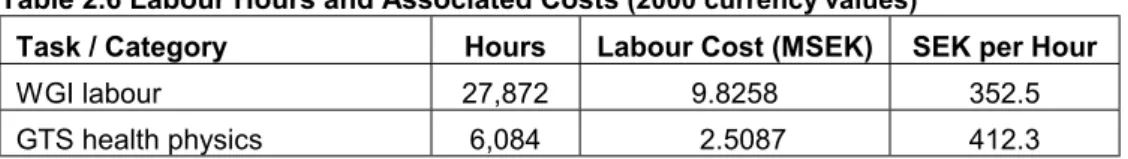
Table 2.6 lists the labour hours expended by the principal contractors and the associated costs.
Table 2.6 Labour Hours and Associated Costs (2000 currency values)
Task / Category Hours Labour Cost (MSEK) SEK per Hour
WGI labour 27,872 9.8258 352.5
GTS health physics 6,084 2.5087 412.3
The WGI craft labour and GTS health physics rates differ slightly from WGI craft labour and GTS health physics rates for other projects discussed in this report because the amount of supervisory and project management hours assigned to this project differs from the other projects.
Initially, the project involved five days per week and eight hours per day. The daily set-up process was slow and so the workweek was changed to four days per week and 10 hours per day. The work progressed slower than anticipated and so the effort was increased to five days per week and eventually six days per week. The increased effort was required in order to meet the Hake Engineering schedule for removing the reactor vessel.
The labour rate does not reflect much overtime pay because more labourers were added as the demand for more hours per week increased.
The work required full anti-contamination clothing and, when diamond wire cutting was in progress, full-face breathing masks were required. The clothing did not affect progress but the discomfort of wearing masks did affect productivity.
For the most part, the concrete did not stick to the reactor vessel. Some debris entered the transfer canal because slurry from diamond wire cutting entered piping that penetrated the bioshield. This did not present a significant clean-up problem because the canal already contained sludge that had to be removed.
The blocks were removed from the containment through the truck lock, staged onsite and then loaded onto gondola train cars for transportation to Envirocare.
2.3.3 External
Costs
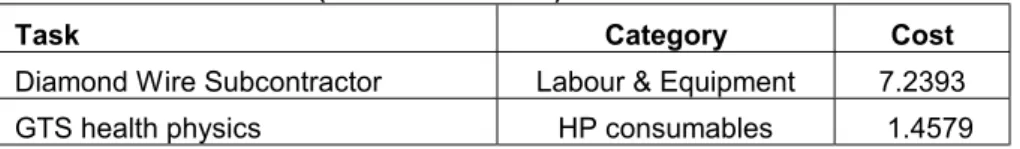
The bioshield project involved considerable external costs as noted in table 2.7. The cost of waste disposition is listed in section 2.3.4.
Table 2.7 External costs (MSEK - Year 2000)
Task Category Cost
Diamond Wire Subcontractor Labour & Equipment 7.2393
GTS health physics HP consumables 1.4579
The major external cost was the diamond wire-cutting subcontract to cut the bioshield concrete into blocks for shipment and disposal. The other external cost for health physics coverage was large because of the liquid slurry that resulted from the cutting process.
From two to six subcontractor staff were employed on this job at different phases of the work. The total labour content of the job is estimated at 2,200 to 2,750 hours i.e. approximately 2,500 hrs. The rate for these staff was considerably higher than for the general dismantling teams and is estimated at $70 to $80 per hour, equivalent to about SEK 730 per hour at the mid point. On this basis the labour content of the diamond wire subcontract would have cost about MSEK 1.8 and the equipment hire about MSEK 5.4.
2.3.4
Waste Volumes and Cost
The main waste component of the bioshield dismantling project was the concrete blocks, which cumulatively weighed 1,018 MT and occupied 813.2 m3. Appendix B lists the weight, volume and radioactivity content of the bioshield shipments. The blocks were packaged in nylon bags (see Section 2.7), removed from the containment
through the truck lock, temporarily stored onsite, loaded on a flatbed truck for transfer to the rail spur and then loaded into gondola train cars for transportation to Envirocare for final disposal. MHF Logistic Solutions provided transportation equipment and logistics. Table 2.8 contains the pertinent quantified information.
Table 2.8 Cost of Waste Disposition for Bioshield Concrete (MSEK - Year 2000) Waste Processing Transport Containers Other1 Disposal
1.1512 1.7067 0.0584 1.0193 4.6771
1 Lift liners, loading frames, lumber, tarpaulins, stencils for labelling, concrete bags and
crane rental
The itemised cost of containers and the concrete bags is addressed in section 2.7.
2.3.5 Total
Costs
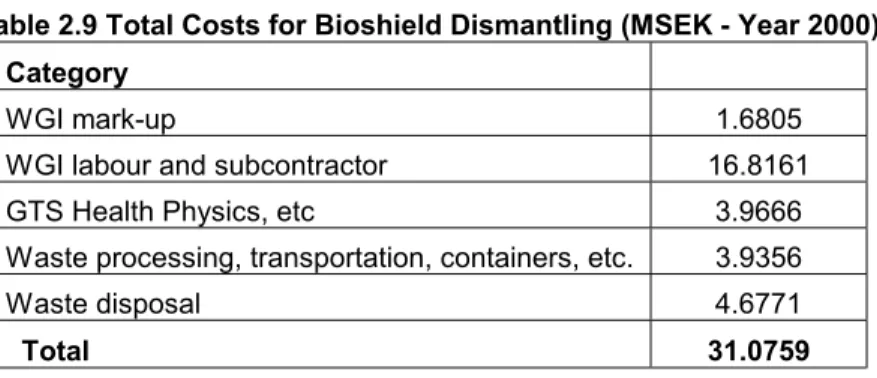
Table 2.9 summarises the total costs based on information in sections 2.3.2 through 2.3.4 but with the WGI mark-up discussed in section 2.2.5 and a MSEK 0.249 adjustment associated with WGI materials.
Table 2.9 Total Costs for Bioshield Dismantling (MSEK - Year 2000) Category
WGI mark-up 1.6805
WGI labour and subcontractor 16.8161
GTS Health Physics, etc 3.9666
Waste processing, transportation, containers, etc. 3.9356
Waste disposal 4.6771
Total 31.0759
2.3.6 Normalised
Resources and Comparison
The definition of unit costs in respect of the clearly defined WTR bioshield dismantling and disposal exercise is relatively straightforward. In contrast the R2 scope of work and volumes of concrete to be dealt with is less well defined. Table 2.10 lists the available base data and derived unit costs for both WTR and R2. The labour rates and derived unit costs for waste transport and disposal are relatively clear. The key benchmarking cost related to dismantling needs some interpretation however.
Table 2.10 Normalised Costs for Bioshield Dismantling (SEK per unit)
WTR Task Category WTR Unit Cost R2 Equivalent Unit Cost
General WGI Craft Labour Rate 293.4 per hour 570 per hour
WGI Rate 352.5 per hour 570 per hour
GTS Health Physics Rate 412.3 per hour 700 per hour
Waste Transportation 1.676 per kg .526 per kg
Waste disposal 4.594 per kg 5.714 per kg
2.3.6.1 Transport and Disposal
The difference in transportation can be explained in terms of distance, transport mode and charges related to moving empty transportation vehicles to the nearest shipping centre. The distance from western Pennsylvania (WTR location) to Utah by rail is about 2,900 km. The distance from R2 to the SFR is at most a few hundred kilometres. In addition, truck transport was used in the R2 case. Finally, there would be deadheading charges because there would not be other shipments to be picked up at Envirocare and so the train would have to be moved empty to a transportation centre in the western United States. The difference in unit disposal costs reflects the individual national situations. Neither the transport data nor the disposal data provide the basis for a meaningful comparison of unit cost data on a benchmarking basis.
2.3.6.2 Dismantling
At WTR the approach is clear and the costs relate to dismantling and removal of the entire bioshield volume – 813.2 m3 for a weight of 1,018 MT. The R2 estimate is less well defined. A gross amount of concrete is mentioned plus an estimated amount of radioactive concrete. The available information seems to indicate that the bioshield concrete has a gross volume of about 1,650 m3. The approach mentioned is to remove the first 20 cm of this material, on the basis that this would be the maximum extent of radioactivity. Approximately 500 m3 would be removed on this basis, for a weight of about 1,750 MT. The cost for performing this work appears to be MSEK14. What would happen to the remaining volume of concrete is not clear. MSEK14 and 1,750 MT is the basis for the unit cost of SEK8/kg included in table 2.10.
Some of the MSEK total cost figure will correspond to equipment and materials. However, as a first approximation, if the total cost were assumed to relate to labour, it would imply a total of about 23,300 hours, or 13.3 hrs/MT. The corresponding figure from the WTR estimate is approximately 35.8 hrs/MT (including the estimated diamond wire subcontractor labour). On this basis the actual WTR cost is approximately 2.7 times the R2 estimate. The reason for this difference is not apparent. The 23,300 hours figure would correspond to approximately 30 per cent of the 80,000 craft labour hours included in the R2 estimate specifically for dismantling.
2.4 Dismantling
Primary Coolant Piping
2.4.1 Definition of the Task
In terms of dismantling work, this project was the most difficult in terms of access to the work area. Special access was required from outside the containment building. Workers had to descend two ladders while wearing safety harnesses that were connected by rope to a safety monitor station that had to be manned continually during the work. The task included:
Removal of existing piping not required for continued site operations, within the primary coolant tunnels and emergency primary piping coolant water pump shaft pit.
Decontamination and disposal of the removed piping with disposal volumes based on the results of decontamination.
Decontamination of the surfaces of the primary coolant tunnels and emergency primary piping coolant water pump shaft pit.
2.4.2
Labour Hours, Labour Cost, Work Week and Productivity
Table 2.11 lists the labour hours expended and the associated costs.
Table 2.11 Labour Hours and Associated Costs (2000 currency values)
Task / Category Hours Labour Cost (MSEK) SEK per Hour
WGI labour 21,657 6.1969 286.1
GTS health physics 11,897 4.9493 416.0
The WGI craft labour and GTS health physics rates differ slightly from WGI craft labour and GTS health physics rates for other projects discussed in this report because the amount of supervisory and project management hours assigned to this project differs from the other projects.
As noted, productivity was hampered through the access process, which required approximately two hours per man-day and an extra labourer to man the safety rope/harness station.
The workweek was based on four days at ten hours gross per day.
2.4.3 External
Costs
Consumables for GTS health physics coverage totalled MSEK 1.332.
2.4.4
Waste Volumes and Cost
weight of 44,484 kilograms. Piping segments that were determined to have low enough contamination such that free release would be possible after decontamination, were loaded into SeaLand containers and shipped to GTS where decontamination and disposal services were provided. Following decontamination, the piping segments were disposed of in non-radioactive landfills, even though free release theoretically was an option. Piping segments that could not be decontaminated were shipped to Envirocare for final disposal. Hittman provided transportation services. Table 2.12 lists the associated costs.
Table 2.12 Cost of Waste Disposition for Primary Coolant Piping Removal (MSEK -Year 2000)
Waste Processing Transport Containers and Equipment
2.0485 0.0299 0.0573
The nominal price quoted for contaminated piping disposal was US$2.00 per pound, which is equivalent to SEK 43.12 per kg. The total cost of for primary coolant pipe processing listed in table 2.12 is consistent with this nominal unit cost.
2.4.5 Total
Costs
Table 2.13 summarises the total costs based on information in sections 2.4.2 through 2.4.4 but with the WGI mark-up discussed in section 2.2.5.
Table 2.13 Total Costs for Primary Coolant Piping Removal (MSEK - Year 2000) Category
WGI mark-up 0.6197
WGI labour 6.1991
GTS Health Physics, etc 6.2815
Waste processing, transportation, containers, etc. 2.1357
Total 15.236
2.4.6 Normalised
Resources and Comparison
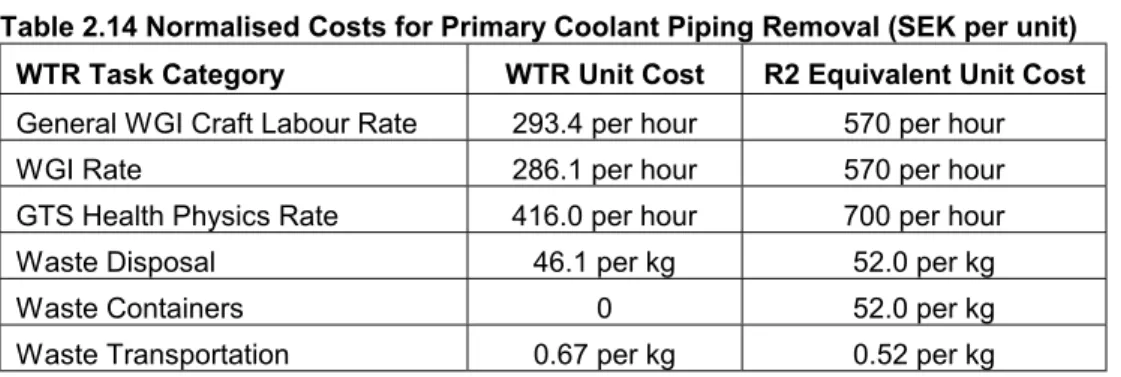
Table 2.14 lists man-hour rates and derived unit costs for the transport and disposal functions in the WTR primary coolant piping removal project. The table also indicates the comparable R2 estimates.
Table 2.14 Normalised Costs for Primary Coolant Piping Removal (SEK per unit) WTR Task Category WTR Unit Cost R2 Equivalent Unit Cost
General WGI Craft Labour Rate 293.4 per hour 570 per hour
WGI Rate 286.1 per hour 570 per hour
GTS Health Physics Rate 416.0 per hour 700 per hour
Waste Disposal 46.1 per kg 52.0 per kg
Waste Containers 0 52.0 per kg
Apparently, SFR requires that piping segments be packaged in containers whereas Envirocare can accept the piping segments for burial without special packaging. The Sealand transportation containers are rented and returned after shipment is complete. The rental charge is about SEK 4,300 with about seven containers used.
A benchmarking estimate for WTR can be derived by dividing the total number of hours expended by the total weight of piping dismantled – 33,554 hours and 44,484 kg, for a unit cost of about 750 hours/MT.
The R2 case is based on 5,000 kg of radioactive waste remaining after decontamination of a much larger gross quantity of primary coolant piping. The exact quantity involved is not known, because it is subsumed into the category of “other process equipment”. Accordingly there is no meaningful basis for the derivation of a unit dismantling cost for R2. The WTR figure of 33,554 labour hours would correspond to approximately 40 per cent of the 80,000 craft labour hours included in the R2 estimate specifically for dismantling.
2.5
Electrical Equipment Removal
2.5.1 Definition of the Task
Initial planning focused on using portions of the electrical system in support of D&D efforts. In actuality, none of the system could be used due to its age and the resultant potential for causing harm to the D&D staff. Therefore, temporary lighting and power systems were installed and the entire original system removed. The task included decontamination and disposal of electrical cables, cabinets, conduits, junction boxes, motors and lighting fixtures.
This work was required in order to remove the bioshield concrete and reactor vessel.
2.5.2
Labour Hours, Labour Cost, Work Week and Productivity
Table 2.15 lists the labour hours expended and the associated costs.
Table 2.15 Labour Hours and Associated Costs (2000 currency values)
Task / Category Hours Labour Cost (MSEK) SEK per Hour
WGI labour 1,794 0.5273 293.9
GTS health physics 325 0.1250 384.7
The WGI craft labour and GTS health physics rates differ slightly from WGI craft labour and GTS health physics rates for other projects discussed in this report
because the amount of supervisory and project management hours assigned to this project differs from the other projects.
The work progressed well and there were no factors that limited accessibility, so productivity was not affected. Most of the work was completed on gross ten-hour days.
2.5.3 External
Costs
The main external cost, which totalled MSEK 0.025, was for consumables related to GTS health physics coverage.
2.5.4
Waste Volumes and Cost
The waste volume of the project was estimated to be 12.233 m3. The waste
processing, transportation and disposal costs were MSEK 0.5377 translating into a unit cost of approximately SEK 44,000 per m3.
2.5.5 Total
Costs
Table 2.16 summarises the total costs based on information in sections 2.5.2 through 2.5.4 but with the WGI mark-up discussed in section 2.2.5.
Table 2.16 Total Costs for Electrical Equipment Removal (MSEK - Year 2000) Category
WGI mark-up 0.0527
WGI labour 0.5273
GTS Health Physics, etc 0.1500
Waste processing, transportation, containers, etc. 0.5377
Total 1.2677
2.5.6 Normalised
Resources and Comparison
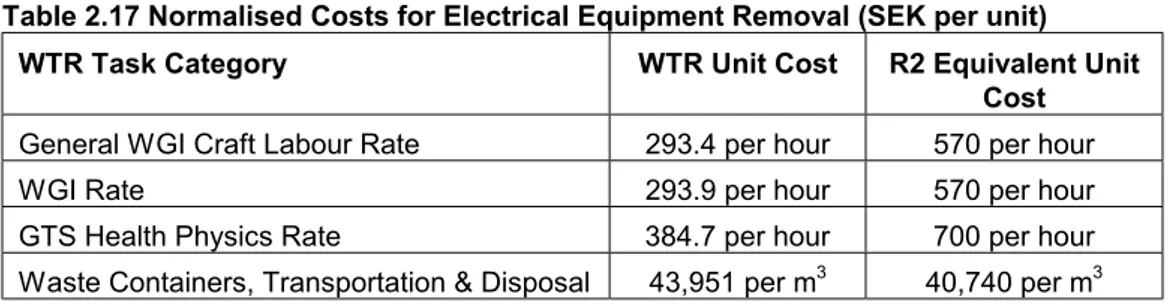
Table 2.17 lists man-hour rates and derived unit costs for the transport and disposal functions in the WTR electrical equipment removal project. The table also indicates the comparable estimated rates for R2 D&D work.
Table 2.17 Normalised Costs for Electrical Equipment Removal (SEK per unit) WTR Task Category WTR Unit Cost R2 Equivalent Unit
Cost
General WGI Craft Labour Rate 293.4 per hour 570 per hour
WGI Rate 293.9 per hour 570 per hour
GTS Health Physics Rate 384.7 per hour 700 per hour
In respect of the actual dismantling work, a benchmarking estimate for WTR can be derived by dividing the total number of hours expended by the total weight of equipment – 2,119 hours and 12.233 m3 for a unit cost of about 173 hours/m3. The R2 estimate quantifies electrical equipment at 200 MT. With a density characteristic of steel or copper and 100 per cent packing density, this would translate to a volume of 25 m3. The actual volume involved may well be larger. Accordingly there is not a robust basis for the derivation of a total or unit dismantling cost for R2 electrical equipment. The WTR benchmarking figure of 173 hrs/m3 if applied to 25 m3 at R2 would give a labour effort of approximately 4,300 hours, equivalent to about 5 per cent of the 80,000 craft labour hours included in the R2 estimate specifically for dismantling. If the packing density of the electrical equipment waste were only 50 per cent, the estimate would increase to 8,600 hours (10 per cent) and if only 25 per cent up to 17,800 hours (20 per cent).
2.6 Project
Management,
Engineering and Licensing
2.6.1 Definition of the Task
Project management, engineering and licensing included the following activities. Develop the decommissioning plan
Co-ordinate and control the Waltz Mill Decommissioning Project (WTR D&D is part of the project) which includes co-ordination of decommissioning team activities, communications, control of work, customer interface and conflict resolution
Prepare radiation work permits to include work practices to maintain exposure as low as reasonably achievable, contamination control measures, and estimates for personnel exposure and radioactive waste volumes
Provide health physics technician support for asbestos abatement, ventilation installation and inspection and sampling
Provide engineering support for design and installation of the WTR ventilation system
Assist in defining the technical basis and requirements for effluent monitoring of the WTR ventilation system
This experience notes the importance of site characterisation in determining sound, reasonable estimates of the cost of decommissioning. Based on a site visit to R2 by NAC personnel in March 2001, R2 has no conditions that would be expected to increase the R2 D&D estimate substantially in relation to the above listed activities at WTR.
2.6.2
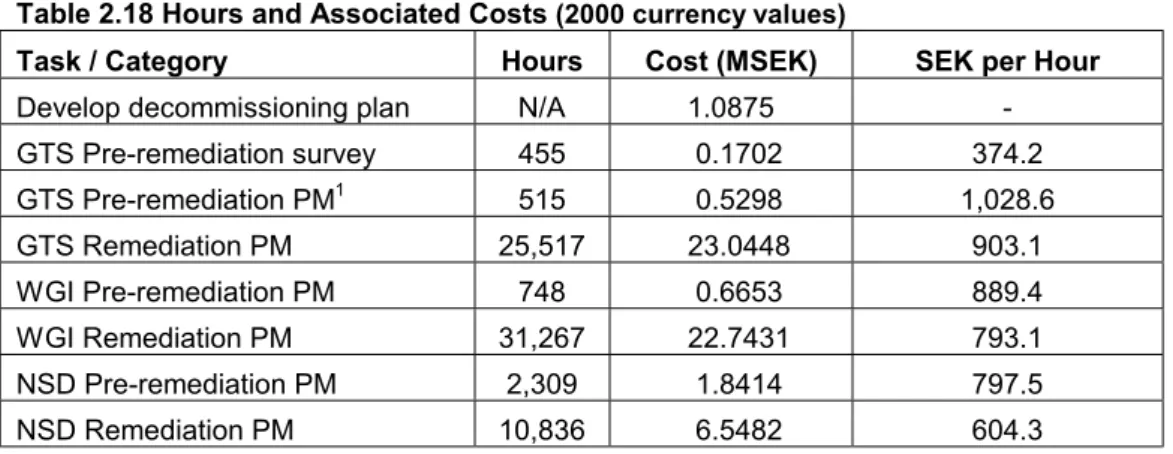
Hours, Cost, Work Week and Productivity
Table 2.18 lists the labour hours expended and the associated costs.
Table 2.18 Hours and Associated Costs (2000 currency values)
Task / Category Hours Cost (MSEK) SEK per Hour
Develop decommissioning plan N/A 1.0875
-GTS Pre-remediation survey 455 0.1702 374.2 GTS Pre-remediation PM1 515 0.5298 1,028.6 GTS Remediation PM 25,517 23.0448 903.1 WGI Pre-remediation PM 748 0.6653 889.4 WGI Remediation PM 31,267 22.7431 793.1 NSD Pre-remediation PM 2,309 1.8414 797.5 NSD Remediation PM 10,836 6.5482 604.3 1PM = project management
The SEK per hour cost for management functions varies widely according to the type of management performed. The lower rates are consistent with supervisory functions whereas the higher rates are consistent with fully loaded rates for engineering, licensing and project management.
There were no accessibility issues with these functions. The original D&D estimate for the WTR of MSEK 122.25 turned out to be very low for the reasons stated below. Government regulations require nuclear organisations to maintain reserves on the
accounting books for decommissioning facilities. In order to maintain the least amount of reserves possible, for many years, the estimate for decommissioning the entire Waltz Mill site was MSEK 244.5. WTR decommissioning accounted for about half of this estimate.
Site characterisation provides the information needed in order to confirm or change major assumptions about the D&D project
Actual hours exceeded projections because of erroneous assumptions or unknown scope (lack of site knowledge) as outlined below.
2. The bioshield could be decontaminated (erroneous assumption).
3. Concrete walls in the tunnels were only contaminated to a depth of a few centimetres (erroneous assumption).
4. The concrete walls in the retention basins were mildly, if at all, contaminated (erroneous assumption).
5. Labour intensive work was required in the tunnels in order to position equipment and work in cramped spaces (unknown scope)
6. Management of the entire project would only require a few personnel (unknown scope).
7. Health physics hours exceeded expected hours because of the requirements of the Waltz Mill site. Other portions of the site are operational and the site management did not want the WTR D&D work to interfere with the ongoing operations of the site (unknown scope).
These experiences highlight the value of thorough site characterisation. This work can confirm major assumptions, quantify waste volumes, delineate obstacles to
completing work, provide an understanding of plant layout for proper scheduling of activities and form the basis for a D&D plan. If site characterisation is properly performed and the information is used in conjunction with proven D&D technologies, the need for contingencies definitely can be reduced.
The WTR D&D tasks were mutually independent from other D&D activities at the Waltz Mill site so that there were no financial benefits or disadvantages associated with being a part of the larger Waltz Mill D&D project, other than the HP&S issue mentioned above.
2.6.3 External
Costs
The main external cost, which totalled MSEK 1.4398, was for consumables related to the GTS health physics coverage. These consumables were used largely for site surveys in order to characterise the site contamination.
The other external cost (MSEK 0.8893) was for materials associated with NSD project management work.
2.6.4
Waste Volumes and Cost
As indicated in Section 2.6.3, the work scope of GTS with respect to pre-remediation involved site surveys in order to characterise contamination. This resulted in the
generation of radioactive waste that required disposal at a charge of MSEK 0.5694.
2.6.5 Total
Costs
Table 2.19 summarises the total costs based on information in sections 2.6.2 through 2.6.4 but with WGI mark-up discussed in section 2.2.5. In addition, where available, the similar R2 cost estimates are listed.
Table 2.19 Total Costs for Project Management, Licensing & Engineering (MSEK - Year 2000)
WTR Category WTR R2 Category R2
WGI mark-up 2.0558
GTS decommissioning plan 0.0774 Planning, licensing documents,
procurement & permits
7.600
GTS Pre-remediation survey 2.1795 Licensing fees, expert opinion,
cleaning & arranging temporary services
15.200
GTS Pre-remediation PM1 0.5298
GTS Remediation PM 23.0448 Remediation PM 13.600
WGI decommissioning plan 0.2771
WGI Pre-remediation PM 0.6653 WGI Remediation 22.7431 NSD decommissioning plan 0.7331 NSD Pre-remediation 1.8414 NSD Remediation 7.4374 Total 61.5847 36.400 1PM = project management
The WTR experience indicates that the R2 assumptions may be approximately 40 percent low. However, this specific part of the R2 estimate does not include health physics management. If the GTS management values are subtracted from the WTR total in table 2.19, the WTR total becomes MSEK 38.010, which is just slightly higher than the R2 estimate.
2.7 Packaging,
Transportation and Disposal of
Radioactive Concrete and Reactor Components
2.7.1 Radioactive
Concrete Definition
The three categories of concrete radioactive wastes include:
Concrete blocks from the reactor bioshield totalling 1,018 MT (813.2 m3) at 53.25 Curies and requiring 12 shipments
Concrete blocks from test cubicles in the reactor building totalling 78.64 MT at 6.2 Curies and requiring five shipments
Concrete dust and debris from scabbling operations consisting of 34.75 MT (38.7 m3) at 16.9 Curies.
2.7.2
Reactor Components Definition
The reactor components include the reactor vessel as an intact waste container, piping and components from the reactor coolant system.
2.7.3 Packaging,
Transportation and Disposal of Radioactive
Concrete
Table 2.20 lists the modes of transportation and packaging for radioactive concrete.
Table 2.20 Transportation Modes for Radioactive Concrete
Category Transport Mode Packaging
Bioshield concrete blocks Flatbed truck to rail spur then train(Gondola cars) Liftliner bag Test cubicle concrete blocks Same as for Bioshield blocks or Intermodal
containers placed on train flat cars Liftliner bag
Scabble debris Same as for Bioshield blocks Liftliner bag
Concrete radioactive waste (scabbling debris and blocks from the bioshield and test cubicles) was disposed of at Envirocare.
The Liftliner Soft-sided Disposal System is a double-layer, nylon type material bag supplied by MHF Logistic Systems. The bag has a weight limit of 10.886 MT, a volume capacity of 7.3058 cubic meters and a cost of SEK 3,520.8. The bag is licensed for radioactive transport of LLW and is principally used for containment of loose debris and contamination. The bag has no radiation shielding capability. The concrete bioshield blocks were cut into segments such that one bag contained two segments.
Intermodal containers have approximately the same volume as the bed of a “dump truck” or about 13.6 cubic meters. Six intermodal containers can be placed on a train flat car. These containers were used to ship concrete blocks from the test cubicles to Envirocare.
GTS had the capability to measure the contamination levels of the concrete (80-90 percent accuracy) in order to assess if the concrete could be disposed of in a landfill in the state of Tennessee. If concrete passed this initial screening while at the WTR site, it was shipped to the GTS facility for further processing. Most of the concrete that passed the initial screening was in fact disposed of in a landfill. Concrete that
passed the initial screening but failed further inspection upon arrival at the GTS facility was shipped back to the WTR site at GTS’s expense. The concrete was then shipped to Envirocare by one of the modes listed in table 2.20.
As noted in table 2.10, the unit cost of transportation for the concrete bioshield blocks was SEK 1.676 per kilogram. Since the test cubicle concrete blocks and concrete scabbling debris were transported by rail, the same rate applies to these forms. The basic disposal charge for radioactive concrete with no other costs included was SEK 3.88 per kilogram.
2.7.4 Packaging,
Transportation and Disposal of Reactor
Components
Table 2.21 lists packaging and transportation modes for reactor components. The piping components were sent to GTS for decontamination. If the components remained radioactive after the decontamination process, the components were
subsequently disposed of at Envirocare. The reactor vessel was shipped to the Alaron facilities, segmented at those facilities and the segments shipped to Envirocare.
Table 2.21 Transportation Modes for Reactor Components
Category Transport Mode Packaging
Reactor vessel and internals Train to Alaron Shrink Wrap
Reactor Components Train to Envirocare or GTS B-25 metal containers &
SeaLand van
A SeaLand van is a container designed for multi-modal transport including air, truck, train and ship. It has a capacity of 38.5 m3. These containers were used to carry LLW waste that was packaged in other containers (e.g. B-25s) or packed loose in the SeaLand container. The containers were rented for transporting the waste to Envirocare and GTS. The rental charge was SEK 4,300 per container.
The SeaLand vans can be returned for further use and therefore are not purchased. Other than the shielding effect of its metal frame and structure, the van has no specific radiation shielding capability.
The B-25 metal containers have a volume of 2.55 m3, a weight capacity of 1,360.8 kg and a lid and latch mechanism so that the contents can be sealed. These containers were used to ship some of the primary coolant piping components to Envirocare. The container cost was SEK 1,956 per container, which translates to SEK 767.1 per m3
and SEK 1.437 per kg.
2.7.5 Normalised
Resources and Comparison
Table 2.22 lists the unit costs of the major functions for the packaging and transportation of radioactive concrete and reactor components. The table also indicates the comparable estimated rates for R2 D&D work.
Table 2.22 Total Costs for Disposal, Packaging and Transportation (SEK per unit -Year 2000)
WTR Task Category WTR Unit Cost R2 Equivalent Unit Cost
Concrete packaging (Liftliner bag) 0.3234 per kg
Concrete transportation 1.676 per kg 0.526 per kg
Concrete disposal 4.594 per kg 5.714 per kg
Final disposal of reactor vessel segments 32.34 - 43.12 per kg 160 per kg
Reactor vessel transport to Alaron 2.62 per kg
-Reactor component packaging Note 1 52.0 per kg
Reactor component transport 0.67 per kg 0.52 per kg
Reactor component disposal 46.1 per kg 52.0 per kg
1Some of the components were loaded directly into SeaLand vans without special boxes or
packaging. When packaging was used, the B-25 container was used and the unit cost was SEK 1.437 per kg.
The estimated unit cost of disposing the R2 reactor vessel and internals is more than double the WTR rate. The R2 cost is based on storage first in CLAB and then SFL, with the cost of CLAB storage alone (about SEK 80 per kg) being greater than the WTR total unit cost.
Based on the information in table 2.22, the SFR packaging requirements are significant compared to a LLW facility at which the waste is placed in near-surface burial. The moulds for waste burial in SFR are estimated to cost SEK 20,000 and contain one m3 compared to SEK 767.1 per m3 for a B-25 container, when required.
Since the weights are known from the data or information, the concrete disposal rate difference is associated with the differing costs between SFR and Envirocare.
2.8
Dismantling of Ancillary Facilities
(Sub-pile Room)
2.8.1 Definition of the Task
Demolition of the components in and decontamination of the surfaces in the sub-pile room at WTR were selected as a reasonable reference for comparison with the D&D of an ancillary facility at R2. The sub-pile room contains primary coolant piping, rabbit tubes, test loop and instrumentation piping, a section of the fuel transfer chute
and a movable access platform. The task was separated into the following subtasks: Demolition of the mechanical components in the sub-pile room.
Decontamination of the walls, floor and ceilings to acceptable radiation levels. Plug/cap all openings to prevent airborne particulate migration.
2.8.2
Labour Hours, Labour Cost, Work Week and Productivity
Table 2.23 lists the labour hours expended by task and associated costs.
Table 2.23 Labour Hours and Associated Costs (2000 currency value)
Task / Category Hours Labour Cost (MSEK) SEK per Hour
WGI labour 2,410 0.8418 349.3
GTS health physics 1,488 0.5785 388.7
Productivity was hampered through the access process, which required approximately one hour per man-day.
The workweek was based on four days at ten hours per day.
2.8.3 External
Costs
The sub-pile room D&D project incurred external costs as noted in table 2.24.
Table 2.24 External costs (MSEK - Year 2000)
Task Category Cost
WGI M, E & S1 0.0244
GTS health physics HP consumables 0.2364
1 Materials, Equipment and Supplies
The consumables for health physics were used in the decontamination of the sub-pile room.
2.8.4
Waste Volumes and Cost
There were many waste components from the project including mechanical
components, plus scabbling and other debris from the decontamination of the walls, floor and ceilings. The mechanical components were either shipped to GTS, if radiation levels indicated that the components could be successfully decontaminated, or placed into SeaLand containers and shipped to Envirocare for final disposal. Table 2.25 lists the associated costs.
Table 2.25 Waste Costs for Sub-pile Room D&D (MSEK - Year 2000) Waste Processing Transport
The cost of containers is addressed in section 2.7.
2.8.5 Total
Costs
Table 2.26 summarises the total costs based on information in sections 2.8.2 through 2.8.4 but with WGI mark-up.
Table 2.26 Total Costs for Sub-pile Room D&D (MSEK - Year 2000)
Task / Category Total
WGI mark-up 0.0816
WGI labour and materials 0.8662
GTS Health Physics, etc 0.8148
Waste processing and transportation 3.4157
Total 5.1783
2.8.6 Normalised
Resources and Comparison
Table 2.27 lists man-hour rates and derived unit costs for the major functions in the sub-pile room D&D project at WTR. The table also indicates the comparable estimated rates for R2 D&D work.
Table 2.27 Normalised Costs for Sub-pile Room D&D (SEK per unit)
WTR Task Category WTR Unit Cost R2 Equivalent Unit Cost
General WGI Craft Labour Rate 293.4 per hour 570 per hour
WGI Rate 349.3 per hour 570 per hour
GTS Health Physics Rate 388.7 per hour 700 per hour
Waste disposal 46.1 per kg 52.0 per kg
Waste transportation 0.67 per kg 0.52 per kg
While the weight of the waste from the sub-pile room D&D is unknown, the disposition of the waste is virtually the same as for the Primary Coolant Piping (see section 2.4). It therefore has been assumed that they will have the same unit costs as shown in table 2.14.
On this basis, the R2 and WTR combined waste disposal and transportation unit costs are fairly close (within 12 percent).
2.9 Conclusions
2.9.1 General
Several general conclusions emerged from the WTR decommissioning project.
Site characterisation can confirm or negate major assumptions, quantify waste
layout for proper scheduling of activities and form a robust basis for a D&D plan. If site characterisation is properly performed and the information is used in conjunction with proven D&D technologies, the need for contingencies definitely can be reduced. The loss of expert knowledge between the time of plant shutdown and the beginning of D&D activities can be an obstacle to D&D efficiency. The WTR was shutdown for over 30 years between final shutdown and the beginning of D&D work. The obstacles can be reduced if:
Plant drawings and records are updated during the operational phase of plant life so that such documents accurately reflect the condition of the plant at the time of final shutdown. In the case of WTR, drawings and records were segregated at the time of shutdown according to those records needed for D&D and those records that would not be needed. Unfortunately, plant staff confused the two groups of records and the records needed for D&D were discarded. Fortunately, the records that did exist provided enough information such that the D&D work was not greatly hindered. If the reactor is associated with a large organization (e.g. Westinghouse in the case
of WTR), a search of the organization for those with knowledge should be performed. Such a search was conducted by the WTR D&D staff and one person with operational WTR knowledge who had been away from WTR for many years was located. The WTR D&D representatives indicated that if the records (No. 1 above) are up to date and of good quality, the need for personnel knowledge is diminished.
Given the difference in labour rates between R2 and WTR, the work for an equivalent task at R2 would have to be performed about 30 to 40 percent more efficiently in order for the labour cost of the task to equal the WTR labour cost. The overall projected cost of the R2 D&D is MSEK 190.93 (2000 money values) compared to the WTR actual figure of MSEK 274.653. The overall scale and composition of R2 is very similar to WTR, albeit with a smaller and lighter reactor vessel. With the major difference in labour rates, it is therefore somewhat surprising to find that the R2 estimate is approximately 30 per cent lower than the WTR actual cost.
The adjusted project management WTR costs are just slightly more than the estimated project management costs for R2, whilst transport and disposal costs for WTR tend to