Steps Control the Dissociation of CO
2
on Cu(100)
Benjamin Hagman,
†,#Alvaro Posada-Borbón,
‡,#Andreas Schaefer,
§Mikhail Shipilin,
∥Chu Zhang,
†Lindsay R. Merte,
⊥Anders Hellman,
‡Edvin Lundgren,
†Henrik Grönbeck,
‡and Johan Gustafson
*
,††Synchrotron Radiation Research, Lund University, Box 118, 221 00 Lund, Sweden
‡Department of Physics and Competence Centre for Catalysis, and§Department of Chemistry and Chemical Engineering and
Competence Centre for Catalysis, Chalmers University of Technology, 412 96 Gothenburg, Sweden
∥Department of Physics, AlbaNova University Center, Stockholm University, 106 91 Stockholm, Sweden
⊥Department of Materials Science and Applied Mathematics, Malmö University, 205 06 Malmö, Sweden
*
S Supporting InformationABSTRACT: CO2 reduction reactions, which provide one
route to limit the emission of this greenhouse gas, are commonly performed over Cu-based catalysts. Here, we use ambient pressure X-ray photoelectron spectroscopy together with density functional theory to obtain an atomistic
understanding of the dissociative adsorption of CO2 on
Cu(100). We find that the process is dominated by the
presence of steps, which promote both a lowering of the
dissociation barrier and an efficient separation between
adsorbed O and CO, reducing the probability for
recombi-nation. The identification of steps as sites for efficient CO2
dissociation provides an understanding that can be used in the
design of future CO2reduction catalysts.
1. INTRODUCTION
Because of global warming, there is a strong need to reduce
emissions of greenhouse gases, such as CO2, into the
atmosphere. In the case of CO2, one possible path is to
convert the molecule into useful chemicals, such as methanol.
The approach to recycle CO2will not only reduce the issues
with global warming but also provide a closed carbon loop for
production of essential chemicals.1,2
Recycling of CO2is challenging because of the inertness of
the molecule with high barriers for activation. To promote the development of new catalysts, it is desirable to have a fundamental understanding of the activation and dissociative
adsorption of CO2on relevant surfaces. Industrially, Cu-based
catalysts, especially combined with ZnO, play an important
role for both the reversed water−gas shift reaction and
methanol synthesis from CO2. The roles of the Cu, ZnO, and
Cu/ZnO interface have been discussed during the last 2
decades.3−9 To reach a fundamental understanding of the
reaction process, it is important to study the two components
also individually. Thus, the interaction and dissociation of CO2
on copper and copper oxide surfaces have received
considerable attention.10−22
Rasmussen et al. observed CO2dissociation on Cu(100) at
close to atmospheric pressures and at temperatures between
475 and 550 K.10Exposure to CO2left adsorbed oxygen on the
surface, while the CO resulting from the dissociation desorbed.
The determined10dissociative sticking coefficient of CO2was
on the order of 10−12. This implies that any in situ experiments
need to be performed at elevated pressures to be able to observe adsorbed oxygen. Ambient pressure X-ray photo-electron spectroscopy (AP-XPS) has made it possible to study
the dissociative adsorption of CO2 on copper surfaces at
elevated pressures, which is not possible with traditional XPS.
Using AP-XPS, Eren et al. have shown that CO2 adsorbs
dissociatively on Cu(100) at pressures in the range 0.1−10
mbar at 300 K.11 Chemisorbed CO2δ− as well as adsorbed
atomic oxygen were observed on the surface. Furthermore, at a
coverage of 0.3 ML (MonoLayers, 1 ML = 1.53× 1015cm−2),
adsorbed oxygen was found to hinder the adsorption of CO2,
which emphasizes the need of CO in the gas mixture to remove the chemisorbed oxygen. However, the knowledge of
how CO2interacts with pristine and oxygen-covered Cu(100)
is limited and there is a need for uncovering the role of surface oxygen in this process.
We have studied the dissociative adsorption of CO2 on
Cu(100) using AP-XPS and density functional theory (DFT) calculations. In contrast to previous studies, we continuously followed the evolution of the oxygen layer, which allows for a deeper understanding of the dissociation process. In agreement Received: July 25, 2018
Published: September 18, 2018
Article pubs.acs.org/JACS
Cite This:J. Am. Chem. Soc. 2018, 140, 12974−12979
copying and redistribution of the article or any adaptations for non-commercial purposes.
Downloaded via MALMO UNIV on November 1, 2018 at 16:06:17 (UTC).
with previous studies,10,11wefind that CO2dissociates on the surface, resulting in adsorbed O, and that the rate of dissociation drops as the oxygen coverage approaches 0.25
ML. Interestingly, we find that the oxygen uptake curve is
linear with different slopes in the coverage ranges of 0−0.25
and 0.25−0.45 ML. This suggests that the adsorption is
unaffected by the O coverage within these ranges. To explain
this behavior, we propose a model where steps dominate the
CO2dissociation process. The calculations show that the effect
of the steps is twofold; it both lowers the dissociation barrier
and provides an efficient separation between adsorbed O and
CO, reducing the probability for the back reaction of CO2
formation. 2. METHODS
2.1. Sample Preparation. The Cu(100) surface was cleaned by cycles of argon ion bombardment at 1 kV, 10 mA, and 2× 10⁻⁶Torr for 20 min and subsequent annealing to 850 K for 20 min. The surface was considered clean when only copper was detected in the XPS.
To obtain a calibration of the oxygen coverage, the O 1s peak of the missing row (MR) structure,23which contains 0.50 ML of oxygen, was used as reference. This structure was prepared by saturating the clean surface with oxygen by exposure to 1200 L of O2 at 370 K,
which according to scanning tunneling microscopy (STM) and low-energy electron diffraction (LEED) gives the MR structure; see Supporting Information.
2.2. XPS Measurements. The AP-XPS experiments were conducted at Beamline 9.3.2 of the Advanced Light Source at Lawrence Berkeley National Laboratory.24 The C 1s and Cu 3p spectra were measured using a photon energy of 435 eV, while O 1s was measured at 650 eV. The evolution of the oxygen coverage was monitored by measuring the O 1s region continuously, while the Cu(100) surface was exposed to 300 mTorr CO2 at 370 K. As the
surface is exposed to CO2, adsorbed atomic oxygen appears on the
surface, which originates from the following sequence of reactions:
+ * ⇆ * CO (g)2 CO2 (1) * ⇆ * + * CO2 O CO (2) * ⇆ + * CO CO(g) (3)
We exclude that the oxygen uptake originates from residual O2gas
because the observed oxygen uptake curve does not match the expected signature from O2gas.25After the O 1s signal saturated, the
CO2 was pumped out and O 1s, Cu 3p, and C 1s spectra were
measured. The O 1s signal at UHV is then compared to the O 1s signal of the MR to achieve an oxygen coverage calibration.
The series of O 1s spectra was deconvoluted byfitting each peak using a Doniach-Šunjić function convoluted with a Gaussian as well as a linear background. After determination of the positions and line shapes of all the components, thefitting of the spectra was carried out byfixing all parameters except the intensity of the peaks. In this way, the description of the system is consistent for the entire series of spectra. For the peaks at 530.0 and 529.5 eV, the determined asymmetry parameter and fwhm of the Gaussian are 0.098 and 0.86 eV, respectively.
2.3. DFT Calculations. The calculations were performed within density functional theory (DFT) using PBE exchange-correlation functional26as implemented in the Vienna ab initio package27−30and described in ref23. Carbon, oxygen, and copper were treated with 4, 6, and 11 electrons in the valence, respectively. The (100), (611), and Cu(11 1 1) surfaces are modeled with slabs consisting of four (100) andfive (stepped) layers separated by at least 15 Å of vacuum. For the (100) [stepped] surface, the top two [three] layers were allowed to relax in response to adsorption, whereas the bottom two layers were keptfixed at the bulk positions.
The calculated lattice constant of Cu in fcc bulk is 3.637 Å, in good agreement with the experimental value of 3.615 Å.31 The bond
lengths for carbon dioxide and carbon monoxide in gas phase are calculated to be 1.18 and 1.14 Å, respectively. This is close to the experimental values of 1.16 and 1.13 Å.
Reaction barriers were calculated using the climbing-image nudged elastic band (CI-NEB) technique as implemented in the transition-state tools module for VASP.32All reported states in the potential energy diagram are zero-point energy-corrected. Transition states in the dissociative adsorption of CO2were corroborated by vibrational
frequency analysis.
3. RESULTS
3.1. AP-XPS Measurements. Figure 1 shows the
evolution of the O 1s spectrum as the surface is exposed to
300 mTorr CO2at 370 K. Upon CO2exposure, a coverage of
atomically adsorbed oxygen starts to appear, originating from
CO2dissociation. Initially, the spectrum consists of one peak at
529.5 eV. As the oxygen coverage increases, the peak is observed to shift toward higher binding energy, reaching 530.0 eV at the saturation coverage of 0.5 ML. As reported by Eren
et al.,11there is an additional peak at∼531 eV, corresponding
to adsorbed CO2δ
−
. Under the current conditions, however, the corresponding coverage of this species is never above 0.02 ML, and as the O coverage increases, this peak, if present, is hidden in the tails of the O peaks. Hence, we do not draw any
conclusions concerning the presence of the adsorbed CO2
from these measurements, but refer to the study by Eren et al.,
who reported adsorbed CO2at low O coverages but not at 0.3
ML at room temperature.
We have in a recently published study23concluded that, up
to a coverage of 0.25 ML, the adsorbed oxygen forms a
disordered p(2 × 2) phase, with oxygen in fourfold hollow
sites. This structure converts into a missing row reconstruction,
where each O atom is coordinated to three Cu atoms.23The
calculated O 1s core level shift between four- and threefold coordinated O atoms is 0.7 eV, which is in good agreement
with the measured shift of 0.5 eV inFigure 1. With the two
peaks at 529.5 and 530.0 eV assigned to be oxygen at the unreconstructed and reconstructed part of the surface, Figure 1.Measured O 1s sequence as the surface is exposed to 300 mTorr of CO2at a temperature of 370 K. The right side of thefigure
shows examples of deconvoluted spectra.
respectively, the individual spectra of the O 1s sequence in
Figure 1 can be deconvoluted using these peaks. Such an
analysis is shown to the right inFigure 1for three cases.
The integrated intensities of the peaks at 529.5 and 530.0 eV, as well as their sum, for the entire series of spectra are
shown inFigure 2. We find that the oxygen uptake curve can
be characterized by three regions: (i) A linear region in the coverage range up to 0.25 ML, (ii) another linear region with a gentler slope up to a coverage of 0.45 ML, and (iii) an exponentially decaying increase up to the saturation coverage of 0.5 ML. A linear uptake curve indicates that the rate of dissociative adsorption is constant and the number of sites responsible for dissociation does not depend on coverage. The change in slope at 0.25 ML shows that the rate constant is lowered by the presence of oxygen, although the active sites
remain unoccupied. These effects are corroborated by the DFT
calculations.
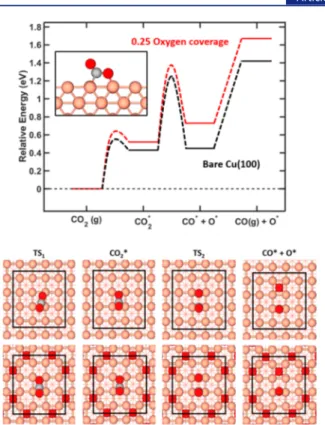
3.2. DFT Calculations. 3.2.1. Dissociative Adsorption of
CO2 on Cu(100). The calculated energy landscape for the
dissociation of CO2 over Cu(100) is shown in Figure 3. In
agreement with previous reports,22wefind that CO2adsorbs as
a bent activated CO2δ
−
species. This is a crucial step for the
dissociation process as C−O bond cleavage from linear CO2is
associated with a barrier of ∼3 eV. The adsorption is
endothermic by 0.43 eV on the pristine surface, with respect
to CO2in the gas phase, and has an energy barrier of 0.55 eV.
This barrier is associated with both the cost of the charge transfer from the surface to the molecule and the structural distortion of the molecule and the surface. To complete the
dissociation, the activated CO2δ
−
is elongated and the C−O
bond is broken over the adjacent bridge site. The dissociation step has a barrier of 0.83 eV and is endothermic by 0.02 eV
with respect to adsorbed CO2δ
−
. A configuration of CO* + O*
is left at the surface, where the CO* molecule occupies the
initial bridge site, while the oxygen atom occupies a fourfold hollow site. The CO molecule is adsorbed to the surface by
0.97 eV. Note that the barrier for desorption of CO2from the
CO2δ− configuration is only 0.12 eV. The entropy difference
between CO2in the gas phase and CO in the gas phase with
adsorbed O is ∼0.08 eV in favor of CO2. The endothermic
nature of the reaction explains the high pressure needed to drive the reaction.
The effect of adsorbed O on the CO2 dissociation was
investigated through a systematic test of the stability of
activated CO2δ
−
at an oxygen coverage of 0.083 ML. All eight
possible nonequivalent configurations of CO2and oxygen
co-adsorption in a c(4× 3) surface cell were explored; seeFigure
4. Wefind that the stability of CO2on the O-covered surface is
sensitive to its relative position with respect to the adsorbed oxygen atoms. Especially, it is shown that the available number
of sites for CO2 is reduced significantly with a coverage of
oxygen.
At a coverage of 0.25 ML, oxygen is predicted to form a p(2
× 2) adsorption structure.23
According to our calculations, the
chemisorbed bent CO2δ
−
is not stable on this surface, which Figure 2.Evolution of adsorbed oxygen from CO2. The two peaks at
529.5 eV (green dots) and 530 eV (blue dots) arefitted for the entire series of spectra inFigure 1. The coverage is estimated by normalizing the integrated intensities to the MR structure.
Figure 3.CO2dissociation on pristine and O-covered Cu(100). The
upper panel shows the zero-point-corrected energy diagram of the two-step dissociative adsorption process. The inset shows adsorbed CO2. The lower panel shows the atomic models of the dissociative
process on both the pristine and O-covered Cu(100). The c(4× 4) surface cell is indicated by black lines. Atomic color codes: Cu (pink), O (red), and C (light gray).
Figure 4. CO2 on Cu(100) with preadsorbed oxygen. The
(endothermic) adsorption energy with respect to CO2 in the gas
phase is indicated. The c(3× 4) surface cell is indicated by black lines. Color codes as inFigure 3.
suggests that the O coverage should saturate at 0.25 ML
instead of 0.5 ML as observed experimentally (Figure 2). CO2
may adsorb at a 0.25 ML oxygen coverage provided that the O
atoms are clustered. We have considered such a configuration
inFigure 3. This structure is only 0.09 eV higher in binding
energy than the p(2 × 2) and might form at 370 K.23 The
structure is similar to the c(4× 6) presented by Fujita et al.33
CO2has a stable minimum when adsorbed on this structure,
with an endothermic adsorption energy of 0.52 eV, which is roughly 0.1 eV higher than for the pristine surface. Although
these calculations indicate that CO2may dissociate at Cu(100)
with an O coverage higher than 0.25 ML, this possibility does not provide any explanation for the linear uptake curve as the number of sites for dissociation should decrease monoto-nously.
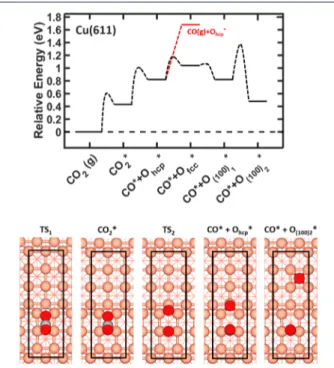
3.2.2. CO2 Dissociation on Stepped Surface. To find an
explanation for the linear uptake curve, we have investigated
the dissociative adsorption of CO2 over the stepped copper
surface. As the close-packed (111) steps are expected to be the
more dominant step,34we chose to study a Cu(611) surface,
which has a surface unit cell comprising two (100) terraces
separated by a (111) step.Figure 5shows the corresponding
energy landscape and models. The dissociation process is similar to the one at Cu(100), proceeding through adsorbed
CO2δ−with subsequent elongation and breaking of the C−O
bond over the step. Atomic oxygen is transferred over the bridge site to occupy a threefold hollow site below the step,
while CO* remains on the initial bridge site. The barrier for
adsorption is slightly higher than that on Cu(100): 0.60 eV
instead of 0.55 eV. The activated CO2has, however, the same
endothermicity as on Cu(100). Dissociation of CO2δ− has a
barrier of 0.57 eV and (CO* + O*) configuration is
endothermic by 0.39 eV with respect to the activated CO2.
However, diffusion of O from the threefold hollow site at the
step to a fourfold position on the (100) terrace makes CO2δ
−
and the (CO* + O*) isoenergetic.
The barrier for CO2dissociation from the adsorbed state is
0.26 eV lower on the step as compared to the (100) terrace.
Additionally, the barrier for CO2desorption is slightly higher:
0.17 eV as compared to 0.12 eV. With use of the Arrhenius
expression, these differences give, at 370 K, a higher probability
of CO2 dissociation on Cu(611) as compared to that on
Cu(100) by 4 orders of magnitude; see Supporting
Information.
In addition to lowering of the dissociation barrier, steps enable a facile separation between adsorbed CO and O. This is an important aspect as the barrier for CO and O recombination is lower than the barriers associated with
diffusion of O to the terrace sites. From the threefold hollow
site on the step, which is the position of O after dissociation,
there is a sequence of three barriers for O to diffuse out on the
lower terrace. The highest of these barriers is 0.54 eV, whereas
the barrier for O diffusion on Cu(100) is 0.80 eV.
3.2.3. Avoiding Poisoning of Step Sites. Preferential CO2
dissociation at steps would rationalize the linear uptake curves provided that the steps are not poisoned by the reaction products. Importantly, there is a thermodynamic driving force for oxygen to diffuse away from the step and instead occupy
sites on the terraces. This is exemplified by calculating the
stability of p(2× 2) and c(2 × 2) types of structures on Cu(11
1 1) (Figure 6). The oxygen coverage in the two cases is 0.25
and 0.42 ML, respectively. For p(2 × 2), this is the same
coverage as on the extended surface whereas the c(2 × 2)
structure has a coverage of 0.5 ML on Cu(100). On Cu(11 1
1), the average oxygen binding energy is−1.86 and −1.74 eV
for the low- and high-coverage case, respectively. This should be compared to the corresponding binding energies on
Cu(100), which are −2.02 and −1.77 eV. The considerable
reduction in stability is related to the occupation of the
fourfold site below the step. The differential binding energy for
this site is−1.63 and −1.32 eV for the p(2 × 2) and c(2 × 2)
types of structures, respectively. The reduced binding energies on the Cu(11 1 1) surface can partly be attributed to
compressive strain as Cu−Cu bond distances are reduced in
the topmost surface layer.
When the coverage increases, oxygen resulting from
dissociation processes on one step will by diffusion eventually
reach the next lower step. This is expected to happen when the coverage approaches 0.25 ML, that is, when the surface is
covered by a p(2× 2) structure. As for Cu(100), this would
block the adsorption of CO2and, thereby, hinder the reaction.
Figure 5. CO2 dissociation on pristine Cu(611). The upper panel
shows the zero-point-corrected energy diagram of the two-step dissociative adsorption process. The lower panel shows the atomic models of the dissociative process on Cu(611). The surface cell is indicated by black lines. Color codes as inFigure 3.
Figure 6.p(2× 2) (a) and c(2 × 2) (b) types of structures on Cu(11 1 1). The circle highlights the oxygen atom adsorbed right below the step for which differential adsorption energies are calculated. The surface cell is indicated by black lines. Color codes as inFigure 3.
Still the dissociation is measured to continue until a coverage of 0.5 ML has been reached. The reason for this is most likely that the step is kept free from O through reaction with CO. As long as the dissociation rate is high enough relative to the O
diffusion rate, and considering the high barrier for CO
desorption, there will always be CO from another dissociation
event available for reaction with the O that, by diffusion,
reaches the active step sites. This will, of course, result in continuous removal of some O, and a reduced increase of the O coverage. This scenario is consistent with the change of the slope of the uptake curve when the coverage approaches 0.25 ML.
4. DISCUSSION
On the basis of our combined AP-XPS and DFT results, we
suggest a model for the dissociative adsorption of CO2 on
Cu(100), where dissociation on steps dominate. The effect of
the steps is twofold, both lowering the activation barrier for the dissociation and separating the resulting O and CO, thus hindering recombination. This scenario agrees with the linear behavior of the O uptake. A similar importance of steps has previously been suggested by Somorjai et al., for adsorption of
CO2on Cu(311).17
In addition, our model is consistent with previous reports, of which the recent combined AP-XPS and HP-STM study by
Eren et al. is of special interest.11Eren et al. show that CO2is
able to adsorb on the clean Cu(100) surface; while at an O
coverage of 0.3 ML, the CO2coverage is below the detection
limit. This agrees well with our DFT calculations showing that
the adsorption of CO2 is efficiently blocked by adsorbed O
such that no CO2 adsorption can occur on the p(2 × 2)
structure found to be the stable phase at 0.25 ML coverage.
The O coverage increases above 0.3 ML in both Eren’s and
our studies, suggesting that the adsorbed CO2found by
AP-XPS is not involved in the reaction. This problem is solved by the reaction taking place on steps rather than the terraces,
given that oxygen diffuses away from the active sites.
Another detail to take into account is that different studies
have shown significantly different adsorption rates. According
to ref 11, similar exposures of Cu(100) to 0.3 Torr CO2 at
room temperature for approximately 3 min at ALS Beamlines 9.3.2 and 11.0.2 results in 0.34 and 0.48 ML O coverage,
respectively. This was attributed to different background
pressures in the experimental chambers. We made a similar exposure for approximately 20 min, also at Beamline 9.3.2,
resulting in an O coverage of about 0.06 ML; seeSupporting
Information. We do not believe that this large difference can be explained by the experimental environment, especially since the experiments were performed at the same beamline. Instead,
we believe that the difference is due to the reaction occurring
at steps since the step density depends strongly on the sample preparation.
5. CONCLUSIONS
We have studied the dissociation of CO2 over the Cu(100)
using AP-XPS and DFT. Our results show that CO2adsorbs
dissociatively on Cu(100) with a resulting O uptake that is
initially unaffected by the O coverage. This is incompatible
with CO2adsorbing on the (100) terraces, as O would block
the adsorption, resulting in a gradually reduced uptake rate. Instead, we propose a model where dissociation on surface steps completely dominate. In this scenario, the steps both
lower the activation barrier for the dissociation and separate the resulting CO and O, thus hindering recombination. Furthermore, there is a thermodynamic driving force for the
resulting O to diffuse away from the steps out on the terrace,
leaving the active step sites available for further adsorption.
Our results emphasize the importance of steps in CO2
hydrogenation catalysis and form a basis for further studies to establish the roles of Cu, ZnO, and the Cu/ZnO interface in industrial catalysts. Such fundamental understanding is, in turn, a prerequisite for a rational design of future catalysts aimed at reducing the emission of greenhouse gases into the atmosphere.
■
ASSOCIATED CONTENT*
S Supporting InformationThe Supporting Information is available free of charge on the
ACS Publications websiteat DOI:10.1021/jacs.8b07906. STM and LEED image of the missing row reconstruc-tion, additional AP-XPS spectra, and a comparison between the theoretical dissociation rates on Cu(100)
and Cu(611) (PDF)
■
AUTHOR INFORMATION Corresponding Author *johan.gustafson@sljus.lu.se ORCID Andreas Schaefer:0000-0001-6578-5046 Anders Hellman: 0000-0002-1821-159X Edvin Lundgren: 0000-0002-3692-6142 Henrik Grönbeck:0000-0002-8709-2889 Johan Gustafson: 0000-0003-3325-0658 Author Contributions#Benjamin Hagman and Alvaro Posada-Borbón have
con-tributed equally to this article. Notes
The authors declare no competingfinancial interest.
■
ACKNOWLEDGMENTSThe authors thank the Knut and Alice Wallenberg Foundation (No.: KAW 2015.0058), the Swedish Research Council, and
the Swedish Foundation for Strategic Research for financial
support. This work is done within the Röntgen-Ångström
collaboration “Time-resolved in situ methods for design of
catalytic sites within sustainable chemistry”. The staff at the ALS are gratefully acknowledged. This research used resources of the Advanced Light Source, which is a DOE Office of Science User Facility under contract no. DE-AC02-05CH11231. The calculations have been performed at C3SE
(Göteborg) through a SNIC grant.
■
REFERENCES(1) Wang, W.; Wang, S.; Ma, X.; Gong, J. Recent advances in catalytic hydrogenation of carbon dioxide. Chem. Soc. Rev. 2011, 40, 3703−3727.
(2) Porosoff, M. D.; Yan, B.; Chen, J. G. Catalytic reduction of CO2
by H2 for synthesis of CO, methanol and hydrocarbons: challenges
and opportunities. Energy Environ. Sci. 2016, 9, 62−73.
(3) Behrens, M.; Studt, F.; Kasatkin, I.; Kühl, S.; Hävecker, M.; Abild-Pedersen, F.; Zander, S.; Girgsdies, F.; Kurr, P.; Kniep, B. L.; Tovar, M.; Fischer, R. W.; Nørskov, J. K.; Schlögl, R. The Active Site of Methanol Synthesis over Cu/ZnO/Al2O3 Industrial Catalysts.
Science 2012, 336, 893−897.
(4) Nakamura, J.; Nakamura, I.; Uchijima, T.; Kanai, Y.; Watanabe, T.; Saito, M.; Fujitani, T. A Surface Science Investigation of Methanol Synthesis over a Zn-Deposited Polycrystalline Cu Surface. J. Catal. 1996, 160, 65−75.
(5) Nakamura, J.; Choi, Y.; Fujitani, T. On the Issue of the Active Site and the Role of ZnO in Cu/ZnO Methanol Synthesis Catalysts. Top. Catal. 2003, 22, 277−285.
(6) Palomino, R. M.; Ramírez, P. J.; Liu, Z.; Hamlyn, R.; Waluyo, I.; Mahapatra, M.; Orozco, I.; Hunt, A.; Simonovis, J. P.; Senanayake, S. D.; Rodriguez, J. A. Hydrogenation of CO2on ZnO/Cu(100) and
ZnO/Cu(111) Catalysts: Role of Copper Structure and Metal-Oxide Interface in Methanol Synthesis. J. Phys. Chem. B 2018, 122, 794− 800.
(7) Kattel, S.; Ramírez, P. J.; Chen, J. G.; Rodriguez, J. A.; Liu, P. Active sites for CO2hydrogenation to methanol on Cu/ZnO catalysts.
Science 2017, 355, 1296−1299.
(8) Nakamura, J.; Fujitani, T.; Kuld, S.; Helveg, S.; Chorkendorff, I.; Sehested, J. Comment on Active sites for CO2 hydrogenation to
methanol on Cu/ZnO catalysts. Science 2017, 357, eaan8074. (9) Kattel, S.; Ramírez, P. J.; Chen, J. G.; Rodriguez, J. A.; Liu, P. Response to Comment on Active sites for CO2 hydrogenation to methanol on Cu/ZnO catalysts. Science 2017, 357, eaan8210.
(10) Rasmussen, P. B.; Taylor, P. A.; Chorkendorff, I. The interaction of carbon dioxide with Cu(100). Surf. Sci. 1992, 269-270, 352−359.
(11) Eren, B.; Weatherup, R. S.; Liakakos, N.; Somorjai, G. A.; Salmeron, M. Dissociative Carbon Dioxide Adsorption and Morphological Changes on Cu(100) and Cu(111) at Ambient Pressures. J. Am. Chem. Soc. 2016, 138, 8207−8211.
(12) Favaro, M.; Xiao, H.; Cheng, T.; Goddard, W. A.; Yano, J.; Crumlin, E. J. Subsurface oxide plays a critical role in CO2activation
by Cu(111) surfaces to form chemisirbed CO2, the first step in
reduction of CO2. Proc. Natl. Acad. Sci. U. S. A. 2017, 114, 6706−
6711.
(13) Bonicke, I. A.; Kirstein, W.; Thieme, F. A Study on CO2
dissociation on a stepped (332) copper surface. Surf. Sci. 1994, 307− 309, 177−181.
(14) Schneider, T.; Hirschwald, W. Interaction of Carbon dioxide with clean and oxygenated Cu(110) surfaces. Catal. Lett. 1992, 14, 197−205.
(15) Nakamura, J.; Rodriguez, J. A.; Campbell, C. T. Does CO2
dissociatively adsorb on Cu surfaces? J. Phys.: Condens. Matter 1989, 1, 149−160.
(16) Funk, S.; Hokkanen, B.; Wang, J.; Burghaus, U.; Bozzolo, G.; Garcés, J. E. Adsorption dynamics of CO2on Cu(110): A Molecular
beam study. Surf. Sci. 2006, 600, 583−590.
(17) Fu, S.; Somorjai, G. Interactions of O2, CO, CO2, and D2with
the stepped Cu(311) crystal face: comparison to Cu(110). Surf. Sci. 1992, 262, 68−76.
(18) Ernst, K.-H.; Schlatterbeck, D.; Christmann, K. Adsorption of carbon dioxide on Cu(110) and on hydriogen and oxygen covered Cu(110) surfaces. Phys. Chem. Chem. Phys. 1999, 1, 4105−4112.
(19) Koitaya, T.; Yamamoto, S.; Shiozawa, Y.; Takeuchi, K.; Liu, R.-Y.; Mukai, K.; Yoshimoto, S.; Akikubo, K.; Matsuda, I.; Yoshinobu, J. Real-Time Observation of Reaction Processes of CO2on Cu(997) by
Ambient-Pressure X-ray Photoelectron Spectroscopy. Top. Catal. 2016, 59, 526−531.
(20) Bendavid, L. I.; Carter, E. CO2Adsorption on Cu2O(111): A
DFT+U and DFT-D Study. J. Phys. Chem. C 2013, 117, 26048− 26059.
(21) Mishra, A. K.; Roldan, A.; de Leeuw, N. H. CuO Surfaces and CO2 Activation: A Dispersion-Corrected DFT+U Study. J. Phys.
Chem. C 2016, 120, 2198−2214.
(22) Liu, C.; Cundari, T. R.; Wilson, A. K. CO2 Reduction on
Transistion Metal (Fe, Co, Ni, and Cu) Surfaces: In Comparison with Homogeneous Catalysis. J. Phys. Chem. C 2012, 116, 5681−5688.
(23) Posada-Borbón, A.; Hagman, B.; Schaefer, A.; Zhang, C.; Shipilin, M.; Hellman, A.; Gustafson, J.; Grönbeck, H. Initial oxidation of Cu(100) studied by X-ray photo-electron spectroscopy
and density functional theory calculations. Surf. Sci. 2018, 675, 64− 69.
(24) Grass, M. E.; Karlsson, P. G.; Aksoy, F.; Lundqvist, M.; Wannberg, B.; Mun, B. S.; Hussain, Z.; Liu, Z. New ambient pressure photoemission endstation at Advanced Light Source beamline 9.3.2. Rev. Sci. Instrum. 2010, 81, 053106.
(25) Okada, M.; Hashinokuchi, M.; Fukuoka, M.; Kasai, T.; Moritani, K.; Teraoka, Y. Protective layer formation during oxidation of Cu3Au(100) using hyperthermal O2molecular beam. Appl. Phys.
Lett. 2006, 89, 201912.
(26) Perdew, J. P.; Burke, K.; Ernzerhof, M. Generalized gradient approximation made simple. Phys. Rev. Lett. 1996, 77, 3865−3868.
(27) Kresse, G.; Hafner, J. Ab initio Molecular Dynamics for Liquid Metals. Phys. Rev. B: Condens. Matter Mater. Phys. 1993, 47, 558−561. (28) Kresse, G.; Hafner, J. Ab initio molecular-dynamics simulations of the liquid-metal-amorphous-semiconductor transition in germa-nium. Phys. Rev. B: Condens. Matter Mater. Phys. 1994, 49, 14251− 14269.
(29) Kresse, G.; Furthmüller, J. Efficenciey of ab-initio Total Energy Calculations for Metals and Semiconductors Using a Plane-Wave Basis Set. Comput. Mater. Sci. 1996, 6, 15−50.
(30) Kresse, G.; Furthmüller, J. Efficent Iterative Schemes for ab initio Total-Energy Calculations Using a Plane-Wave Basis Set. Phys. Rev. B: Condens. Matter Mater. Phys. 1996, 54, 11169−11186.
(31) Tran, F.; Laskowski, R.; Blaha, P.; Schwarz, K. Performance on molecules, surfaces, and solids of the Wu-Cohen GGA exchange-correlation energy functional. Phys. Rev. B: Condens. Matter Mater. Phys. 2007, 75, 115131.
(32) Henkelman, G.; Uberuaga, B. P.; Jonsson, H. A Climbing Image Nudged Elastic Band Method for Finding Saddle Points and Minimum Energy Paths. J. Chem. Phys. 2000, 113, 9901−9904.
(33) Fujita, T.; Okawa, Y.; Matsumoto, Y.; Tanaka, K. Phase boundaries of nanometer scale c(2× 2)-O domains on the Cu(100) surface. Phys. Rev. B: Condens. Matter Mater. Phys. 1996, 54, 2167− 2174.
(34) Liu, C.-L. Energetics of diffusion processes during nucleation an growth for the Cu/Cu(100) system. Surf. Sci. 1994, 316, 294−302.