MASTER: IN ECONOMICS
THESIS WITHIN: ECONOMICS
NUMBER OF CREDITS: 30
PROGRAM OF STUDY: ECONOMICS, TRADE AND POLICY
AUTHOR: ERIC JUSTINIAN LUGEIYAMU
SUPERVISOR: SCOTT HACKER
MARK BAGLEY
JÖNKÖPING: MAY 2016
Is Export Diversification a Key Force to
Africa’s Economic Growth?
i
ABSTRACT
This study examines the influence (effects) of export diversification in defining economic growth differences across Africa and it tests its robustness in different samples and estimation techniques compared to other variables of trade namely, trade openness and export growth. It applies an augmented Solow growth model in a cross-section dataset for the period of 1998 to 2009 with all three trade variables tested under a single framework. It is found that countries with more diversified exports generally experienced faster economic growth; therefore, variation in export diversification levels explains the observed growth differences across Africa. The results show that both export diversification and export growth are robust determinants of economic growth rates in the region while trade openness is not. The findings have a strong bearing on trade policy by emphasising the importance of more diversified exports to mitigate the negative impacts of global economic shocks to economic growth in the region.
ii
ACKNOWLEDGEMENTS
I like to express my earnest appreciation to the Swedish Institute of Scholarship (SI) for fully granting me to study at Jönköping International University. I am equally grateful to my teacher and supervisor Professor Scott Hacker for his guidance, reviews, suggestions and comments to my thesis in spite his busy schedule. I consider it an honour to work with him. I extend my thanks to my young brother, Linus, for useful comments, and Mr. Mark Bagley, Mr. A. Chikoyo, Ms. F. Pacho, Mr. H. Ndagula, too.
I am thankful to my parents, Mr & Mrs Lugeiyamu, my young sisters, Dafrosa & Firmina, and my youngest brother Vitalis for their encouragements and material supports during my entire period of master studies in Sweden. Last, but not the least, I express gratitude to all who made valuable contributions to this work but their names do not appear in this part. All errors remain my own.
iii
Table of Contents
1. INTRODUCTION ... 1
2. LITERATURE REVIEW ... 3
2.1. Export Diversification: What Does It Really Mean? ... 4
2.2. Theoretical Review: Export Diversification and Growth ... 5
2.3. Determinants of Export Diversification ... 8
2.4. Empirical Review ... 9
3. EXPORT DIVERSIFICATION IN AFRICAN ECONOMIES ... 11
4. METHODOLOGY ... 13
4.1. Export Diversification Measure ... 13
4.2. Empirical Growth Model and Estimation ... 13
4.3. Variables... 15
4.4. Data ... 17
5. EMPIRICAL RESULTS AND DISCUSSION ... 18
6. CONCLUDING REMARKS ... 22 REFERENCES ... 23 APPENDIXES ... 27 Appendix 1: ... 27 Appendix 2: ... 28 Appendix 3: ... 29
Tables
Table 1: A list of variables ... 15Table 2: Descriptive statistics of variables ... 18
Table 3: Pairwise correlations of variables ... 18
Table 4: Regression results ... 19
Figures
Figure 1: Average export diversification trend ... 111
1. INTRODUCTION
Africa faces a serious challenge on which policy priority to adopt to effectively promote economic growth with respect to variables of international trade. Referring to the UNECA1 (2012) report and Osakwe (2007), the evidence suggests that the region has lost its market share in the world market for primary goods-led exports. This phenomenon may find an explanation in the fact that prices of primary goods have fallen because they are subject to more volatility than value-added goods which leads to serious consequences on the stability of macroeconomic variables. Such experience forces the region to attempt diversifying its exports from a heavy dependence on primary goods exports to more value-added product exports and embrace new market potentials. This policy shift was adopted in the 2012 African Union summit to promote sustainable economic growth in the region (UNECA, 2012). In policy priority, however, the challenging and interesting questions still remain to Africa policymakers on what influence does export diversification has in defining the region’s economic growth differences and its strength as a policy tool over other trade variables namely, trade openness and export growth, as a growth determinant.Therefore, the concern of policymakers lies on how to diversify export production and its structure to decrease vulnerability to external economic shocks, similar to the 2008 global crisis, in order to boost economic growth.
In the literature, there exists a disagreement when it comes to export structure compositions and its effects on economic growth. On one hand, the neoclassical trade models, for instance, a Ricardian theory suggest that specialisation or concentration of a country on production and export of goods in which it has a comparative advantage is efficient and beneficial to economic growth (Salvatore, 1998; Matthee and Naudé, 2008). This proposition implies that a country to achieve economic growth should promote the sector in which it has a comparative advantage. One the other hand, the new trade theories have partly downplayed the classical theorists claim on the grounds that under uncertainty (or instability), the idea of specialisation is less effective to economic growth (Turnovsky, 1974; Ruffin, 1974; Osakwe, 2007). Many authors in the literature demonstrate that with price instability, export diversification might be a better trade policy option than specialisation policy based on comparative advantages. Authors like Herzer and Lehman (2006), Prebisch (1950), and Singer (1950) underlines that diversifying economies away from a small number of goods prevents weakening of exchange relationships, unfavourable and declining terms of trade, low-value addition, and slow productivity growth in the developing countries. Both export diversification-growth hypothesis and its robustness over other trade variables are supported by the vast amount of empirical study findings from developing countries. The study evidence on the diversification of exports in Africa is limited to the levels of a country and sub-regions.
A high export concentration and heavy dependence on primary commodity exports is a very overriding feature of export composition in the African economies. A report jointly published by the UNECA and AUC2 (2012) shows that Africa’s share of the total regional trade comprises a mere 12% and is dominated by food and beverages which generally account for well over 50% of merchandise exports in non-oil shipping African countries. The same report finds that Africa lags behind other regions with regards to export diversification and is practically moving towards a more concentration in its export products. One of the reasons attributed to these findings is a dominant role of fuel in the total exports due to an increase in fuel prices over the period. It raised the value of oil exports compared to non-oil exports and thus makes the basket more concentrated. According to the UNCTAD3 (2003), 17 of the 20 most significant goods exported by African countries (85%) are primary commodities and resource-based
1
United Nations Economic Commission for Africa (UNECA) 2
African Union Commission (AUC)
2 manufactures. Economic activities in most of the African countries remain lowly or less diversified and exports are often dominated by mineral resources or few primary products (UNECA, 2012).
The heavy dependence on primary commodities is of a great concern because it raises the instability of terms of trade and other macroeconomic variables, with potential consequences on growth (Osakwe, 2007). Diversification of exports and economy, in general, is important for Africa as it builds a resilience of countries to absorb external economic shocks. Diversification is currently more important to Africa which helps it to avoid the similar impacts to the 2008 global financial crisis (UNECA, 2012). Export diversification is generally plausible as a positive trade objective in sustaining economic growth which can be a convenient tool in the fight against poverty. Delgado (1995) claimed that diversity in the agricultural export base and economy across sectors is an important long-term growth strategy in Africa due to the high concentration of export in agricultural products. The conclusion that can be drawn from the proposition is that Africa should embark on the development strategies which promote export diversification and reduce the dependence on primary commodities which face frequent fluctuations in the world prices. Diversification is argued sometimes to be a pre-requisite for economic growth and it is not only important for resource-rich countries (ECA, 2007, UNECA, 2012).
This study attempts to contribute to this ongoing trade policy discussion on how to improve the African trade to achieve economic growth in the following manner. First, the study objective is to examine and measure a cross-country effect of export diversification variable on the variations of economic growth rates in Africa. Second, it evaluates its robustness in different samples and estimation techniques compared to other trade variables namely, trade openness and export growth, as a growth determinant. It hypothesises that countries with a higher level of export diversification grow faster than those with a lower level of diversification in the region. Moreover, the study is one of the initial African studies to consider and compare export diversification variable with other trade variables in the same single regression model.
A framework of the neoclassical Solow model is applied with some modifications by adding export diversification as a key variable. The variable is used as a proxy for the level of technology along with a normal set of control variables. The novelty in its regression model is that other variables of trade, trade openness and export growth are introduced in a single framework. The robustness check on results of export diversification is done using two samples and the GMM method which takes care of a potential problem of endogeneity in the model.
It is found that export diversification has a positive and significant influence in explaining the differences in growth rates across Africa and countries with a more diversified export composition experienced faster growth. Moreover, both export diversification and export growth variables are found to be the only robust determinants of growth in Africa. The findings have a strong bearing on the trade policy by emphasising the importance of more diversified exports to mitigate the negative impacts of global economic shocks to growth in the region. This reflection is consistent with the successful economic experiences in the East Asian countries, such as China, Korea, and Taiwan.
This study begins by first discussing the theoretical and empirical foundations of export diversification and economic growth relationship, which includes a description of export diversification determinants. Second, there is a brief review of exports diversification in Africa. Third, an overview of the methodology, variable selection, and data is presented. Fourth, the section discusses empirical results with economic and policy implications. Fifth, the final section ends with concluding remarks.
3
2. LITERATURE REVIEW
Economic growth is one of the most and still discussed issues in economics literature with diverse views on its determinants. The literature identifies several factors that contribute to economic growth such as policies, institutions and geography (Lee and Kim 2009). In those factors, mostly in international trade, policies are often represented by trade openness and integrations with the so-called “Washington Consensus” (Williamson 1994, 1996, 1990). However, the literature argues that good policy prescriptions fail due to poor institutional environments such as insecure property rights and a weak rule of law (Acemoglu, Johnson, and Robinson 2001, 2002). Specifically, traditional factors would not bring about effects on economic performance in an absence of stable and trustworthy institutional environment to sustain the economy (Easterly, 2005). Other authors, alike, have a divergent view on the robustness of institution variable. Glaeser et al. (2004) argued that it is economic growth which brings in good institutions, such as democracy, citing the case of formerly authoritarian states like South Korea.Lee and Kim (2009) find that low- and lower-middle-income countries are the only countries where institutions are significant.
The other stream of research addresses economic growth question by focusing on the ‘growth spurts and collapse’ in short periods of time which is a more prevalent phenomenon in many countries in the South. It has been established that most of the third world countries could show growth spurts for a certain period of time, less than a decade, then fail to sustain that growth over a longer period (Jones and Olken, 2005; Hausman et al, 2005; Rodrik, 2006). This underlines the importance of building a more sustainable growth rather than focusing only on initial growth. A closely related phenomenon is the so-called ‘middle-income trap’, which indicates the problem of declining growth in middle-income countries (Eichengreen et al, 2012, 2013; Lee, 2013; World Bank, 2010).
Another well-studied area of economic growth factors is connected to economic integration and openness, or trade variables in the literature. The real effects of openness and variables that would best represent the international integration are still under debates (Dollar 1992; Ben-David 1993; Sachs and Warner 1995; Edwards 1989; Vamvakidis 1999; Harrison 1996). Researchers like Frankel and Romer (1999), Rodriguez and Rodrik (2001) and Yanikkaya (2003) find that economic growth and trade openness are positively linked. While some studies find that trade openness, as a factor for economic growth, is not robust (Rodriguez and Rodrik 2001; Vamvakidis 2002; Lee and Kim 2009). Similar disagreements are observed for the FDI4 variable between pro-FDI and skeptical-FDI groups (Hermes and Lensink, 2003; Carkovic and Levine, 2002; Adams, 2009). Another controversy is around the export diversification where some studies find this idea is significant for economic growth in the South while others find export specialisation to have significant effects on growth (Ramanayake and Lee, 2015). The study by Ramanayake and Lee (2015) tested the robustness of export specialisation variable as a growth determinant using different estimation techniques and finds that the variable was a robust determinant of growth in developing countries.
Export diversification has been a dominant element in the discussion of growth dynamics in developing countries since the 1950s. There has been a mix of different theoretical and empirical propositions since then regarding its growth effects.
4
FDI is not included as a variable of interest in this study because it does not necessarily influence growth through export.
4 2.1. Export Diversification: What Does It Really Mean?
Export diversification can generally be defined as the changing of country’s export composition and structure. The process can be achieved by changing existing export commodities pattern or through expanding innovation and technology on them. Dennis and Shepherd (2007) describe export diversification as broadening the variety of products that a country is exporting. Actually, export diversification can take mainly two-dimensional forms namely, horizontal and vertical (Ali et al., 1991; Herzer and Nowak-Lehnmann, 2006).
Generally, a horizontal diversification of exports is simply an increase in the number of primary products mix which usually takes place within the same export sector. Referring to studies by Herzer and Nowak-Lehnmann (2006) and Samen (2010), adding new products on existing export basket within the same sector helps reduce the effects of fluctuation of global commodity prices and alleviate adverse economic risks. This brings forth the stability in export-oriented sector earnings and independence of export-export-oriented growth from a certain sector (Al-Marhubi, 2000). To achieve economic growth by a way of horizontal diversification, a country should either increase its share of products in the market to increase export earnings or introduce new products which can fetches good prices in the world market (Ali et al., 1991). Herzer and Nowak-Lehnmann (2006) argues that a horizontal diversification of exports generates positive externalities to other sectors of the economy brought about by the dynamic learning activities in export-oriented sectors acquired through exposure to foreign firms and international competitions.
On the other hand, a vertical diversification of exports occurs when a country’s export structure shift from primary products to secondary or tertiary sectors, or manufactured products. The process employs a use of existing and new advanced merchandises by undertaking value-addition such as processing and marketing (Poverty and Development Division, United Nation, June 2004). A manufacturing production process of this nature creates spill-over effects in the form of externalities on knowledge and new technologies, relative to a production of primary exports which does not generate such spillovers (Matthee and Naudé, 2008). Al-Marhubi (2000) and Herzer and Nowak-Lehnmann (2006) stress that such spill-over benefits going to other sectors generate and improve capabilities of other industries to compete in the world market. These improvements bring the stability of export earnings as prices of manufactured exports are less fluctuating compared prices of primary exports (Ali et al., 1991). According to Ali et al., 1991, growth via vertical export diversification comes either by introducing and expanding value-added activities or select new products based on their value-added potentials. Hausmann et al. (2007) concluded that export structure matters in a country that has a higher productive capacity with a diversified export structure and it performs better in the world export market.
Both horizontal and vertical export diversifications can produce positive results for a country’s economic growth, but their performances have different dependencies on the technology, marketing and skills. Vertical diversification requires more advanced technology, sophisticated policies, skills and initial capital investment relative to the horizontal diversification. As noted above, vertical diversification may result to more dynamic externalities than that of horizontal diversification.
5 2.2. Theoretical Review: Export Diversification and Growth
A theoretical argument for a connection between export diversification and economic growth was originally advanced in the 1950s by Raul Prebisch and Hans Singer. The idea mainly focused on growth hindrance by the export of primary goods. The argument by Prebisch (1950) and Singer (1950) is that a strong export concentration of developing countries on primary goods impedes growth, declines the terms of trade and escalates the instability of income. This theoretical proposition is known as the “Prebisch-Singer Hypothesis”. To prevent instability of income, a country needs to diversify its export composition, the effect identified as the “portfolio
effect”. Moreover, developing countries need to compete in the international market with other
countries that export similar goods. Consequently, the rise of prices in one country renders products of that country less competitive in the international market since their products will easily be substituted by products of their rivals. This mechanism works mainly due to a low-income elasticity of the international demand for primary products. The demand for manufactured goods increases more rapid than the demand for primary products, making the terms of trade for exporters of primary commodities to weaken in the long run. Dogruel and Tekce (2011) noted that there is a low growth spillover to another sectors from the production of primary products in the economy due to the impact of low-skills and poor technology in the primary sector. Under this framework, “diversification” has become a common goal of economic policies in the less developed countries (Brainard and Cooper, 1968; Dogruel and Tekce, 2011).
The second mechanism by which export diversification might positively affect economic growth is through the dynamic knowledge spillover effects. Knowledge spillovers range from new techniques of production, new management, or marketing practices from exporting industries to possibly assist other industries through imitations and adoptions (De Piñeres & Ferrantino, 2000). Al-Marhubi (2000) noted that an improved production technique which is associated with export diversification in one of exporting sectors is likely to assist other industries through knowledge spillovers. The knowledge externalities include productivity improvements resulting from increased international competitiveness, more efficient management styles, better organisation forms, labour training, and knowledge in terms of technology and international marketing (Herzer & Nowak-Lehnmann; 2006). The success of this strategy brings desirable effects on resource allocation and increases firms’ profits. While resource reallocation raises the income level, the dynamic profit from export diversification plays an important role in increasing the rate of income growth (Hamed et al, 2014). This follows from the result of increased use of factory’s capacity utilisations, achieving economies of scale, and job creations. Growth is stimulated through exporting labour-intensive products which trigger a multiplier effects to increase the demand for intermediate inputs, consumer goods and leads to the rise of total factor productivity (TFP). Moreover, the life cycle models literature (e.g Vernon, 1966; Krugman, 1979; Grossman and Helpman, 1991) argues that the diversity of export products innovated by the North is imitated by the South and exploited by taking the advantage of cheap labour the South has.
However, the whole concept of export diversification appears to challenge the classical trade theories predictions, particularly the Ricardian theory of comparative advantage which predicts countries to specialise (Salvatore, 1998, Matthee and Naudé, 2008). Ricardo argues that countries gain in the international market by specialising in the production of products in which they have a comparative advantage and thereby increase total productivity. So to achieve economic growth by means of Ricardo’s conception, a country should promote a sector in which
6 it has a comparative advantage. A similar view is shared with other classical theories which are based on perfect competition, comparative advantage and constant returns to scale. The theories are based on Adam Smith’s idea of division of labour and specialisation for economic growth and development, and the Heckscher-Ohlin-Samuelson (HOS) model of international trade, which predicts that countries would specialise in producing goods in which they have a comparative advantage based on their factor endowments. Contemporary literature, however, finds that the acceleration of global trade in the latter half of the 20th century has revealed a pattern of trade which is vastly contrary and countries appear to diversify their production and exports as they grow (Krugman, 1980: Hesse, 2006). Helpman and Krugman (1985) argue that greater economies of scale caused by increased exports can lead to growth in the level of productivity. Uncertainty, however, still remains in many scholars on impacts of specialisation on long run growth despite all the relationships identified between trade and productivity. For example, Sachs and Warner (1997) identified the negative influence of comparative advantage in raw materials on economic growth.
Lately, diversification and specialisation issues have been examined as part of the endogenous consequence of a country’s stage of development (Acemoglu and Zilibotti, 1997); Imbs and Wacziarg, 2003). The model used is constructed based on country’s production because the level of production affects the level of exports. Ramacharan (2006) identifies that a one standard deviation rise in diversification is accompanied with about a 0.81 standard deviation growth in the level of credit to the private sector. From that finding, diversifying a structure of sectors in an economy will favour developments of the financial sector which further allows a country to involve in a more specialised mode of export, provided that a financial market provides an insurance cover against risks (Chang, 1991). In view of the thesis above, it is more plausible to argue that export composition structure may go by phases, from low diversified to more diversified, then followed by a phase of a small extent of diversification and more specialisation, as financial sector expansion develops (Saint-Paul, 1992). This would further imply that diversification of production structure for domestic economy requires export diversification first and later export specialisation.
Other researchers also pointed out theoretical reasons which suggest export diversification leads to a higher per capita income growth in the long-run. In order to stabilise the country’s exports in the long-run, many developing countries opt for the policy of export diversification and liberalisation. As a result of the above-stated volatility, risk-averse firms would not invest in a country where its macroeconomic environment are unstable and can be unfavourable to the long-term economic growth. In that respect, many countries liberalise their trade. Michaely (1958) conducted the study on export and import concentration using the GINI coefficient for a dataset of 44 countries and 150 Standard International Trade Classification of commodities and found that countries with a more diversified export structure are more developed in terms of income per capita. He also noted that countries with a higher diversification were more industrialised in terms of primary commodity share in the total exports. Therefore, export diversification can be useful for long-term policy targets to stabilise export earnings (Ghosh and Ostry, 1994; Bleaney and Greenaway, 2001). This proposition is also supported by the structural economic model which infers that for a country to achieve a sustainable growth, it should move from primary export to manufactured exports (Syrquin, 1989).
7 Another theoretical explanation was advanced by Marianne Matthee and Wim Naudé who argue that a move towards more diversification leads to a spatial inequality. The observation was made from trade liberalisation effects which cause small businesses to suffer and further leads to a fall in GDP and consequently retards economic growth. Once firms have the capacity to export more in the international market due to liberalisation domestic firms become less dependent on the domestic market resulting in a decrease of agglomeration forces (Matthee and Naudé, 2008). Moreover, not all developing countries benefit from more exports since their country location can also be an important factor for their low export tendency. However, export diversification still contributes to country’s growth (Herzer and Nowak-Lehnmann, 2006).
At this juncture, the emerging theoretical idea is that a heavy dependence on a narrow range of export products renders the country’s exports unstable in case of a negative demand shock for her products. Export diversification makes the country’s export more stable and less vulnerable to demand shocks. According to Matthee and Naudé (2008), however, the stability from diversification comes at a price of effective resource allocation which is associated with specialisation benefits.
Resource misallocation is a potential problem emanating from concentration in exports of a certain product. A boom from a natural resource discovery could take away resources from a manufacturing sector and most likely it leads to a real exchange rate appreciation. This problem has further consequences in an economy, the so-called “the Dutch Disease”, which is a decline in the competitiveness of country’s trade products in the world market. Since natural resource abundant countries earn adequate foreign exchange currencies required for their importations, they usually have little incentive to industrialise (Dogruel and Tekce, 2011). If industrialisation takes place in this case, normally a country specialises in a production of physical goods which are capital intensive rather that in goods which are knowledge-intensive, which brings out adverse impacts on equality in wages and human capital developments (Bonaglia and Fukasaku, 2003). However, instead of viewing the abundance of natural resources as a curse, should be regarded as an opportunity to build capacity in competitive advantages in non-traditional goods (Bonaglia and Fukasaku, 2003).
However, the empirical evidence for the Prebisch-Singer hypothesis shows a negative relationship between the abundance of natural resources and growth. The evidence from Ng (2006) suggests that it is not the abundance of natural resources that hinders growth, but a concentration of exports in primary goods. For instance, some of the natural resource abundant countries like Canada, Australia and the Scandinavian countries started with a concentrated export pattern in primary goods but later they positively diversified their exports (Hesse, 2008). According to Carrère et al. (2007), the evidence in favour of the Prebisch-Singer hypothesis shows that moving away from primary products is the only appropriate strategy, not that diversification is desirable by itself.
The proposed influence of export diversification on growth by the Prebisch-Singer hypothesis faces challenges from other propositions in the literature. One hypothesis is referred to as the Export-led Growth (ELG) hypothesis, which stresses that a growth of exports stimulates the total factor productivity (TFP) growth and by its positive impacts on higher rates of capital formation helps to relax foreign exchange currency constraints by facilitating imports of capital goods (Lee and Huang, 2002). The ELG further explains that a rise in exports implies that there is an increase in the country’s demand for its goods and services. It also indicates an increase of the GDP of a country and/or there is a reallocation of productive resources toward industries that
8 have high efficiencies at the global level (Awokuse, 2008). This proposition suggests a case that it is the growth of exports rather than the diversity of exports which promote growth and export growth should have a higher priority.
Trade openness is another alternative hypothesis linked to determinants of economic
growth. This hypothesis is founded on the Smith (1776) ideas, the absolute advantage theory, that when a country opens up to the international trade gains an access to an extensive international market which leads to productivity improvements through a division of labour. A small size of the domestic market in most of developing countries limits economic growth. The major dynamic benefit derived from the international trade is that domestic producers get the access to extensive markets (Thirlwall; 2000). Similar argument support comes from the Ricardo (1817)’s theory of comparative advantage in factor endowments which maintains that the international trade is beneficial and leads to productivity and consumption gains to trade partners. Also, economies opened to international trading broadens their industrial sector domestically at a faster rate by importing needed inputs, technologies and machinery from economies which have advanced technologies in an easier manner than closed economies. The ideas suggest that a higher degree of openness has a greater influence on economic growth.
Therefore, the developed picture is that there is a disagreement between the traditional neoclassical theories with the new trade theories when it comes to effects of the export structure (composition) on economic growth. Most of the modern theoretical studies strongly advocate for a diversified export structure, contrary to classical theories, and they argue that a highly concentrated export structure dominated by few primary goods is vulnerable to external demand shocks which proved to have negative consequences on the stability of macro-economy and growth. Then, it is theoretically plausible to assume that a region which is dominated by exports of primary goods will have a limited growth, Africa in a particular case for instance.
2.3. Determinants of Export Diversification
The question of determining factors for export diversification, particularly in developing countries, is comprehensively studied in the literature too. One of the arguments put forward is the infant industries argument which maintains that countries attempt to protect their infant industries by means of both horizontal and vertical diversifications in intra-industry trades (Grossman and Helpman, 1991). The proposition was suggested by Grossman and Helpman (1991) after studying causes of human capital and R&D expenditures on export diversification. Herzer et al (2004) stated that a knowledge spillover brought about by openness is of high significance and is explained by externalities known as a “learning by doing” and predominantly the “learning by exporting” coming from diversification of exports.
The level of development is another suggested determinant of export diversification in literature, normally represented by the GDP per capita of a country. This argument is supported by the demand side and supply side theories that as the GDP per capita rises, a pattern of preference determining consumptions changes (Aghion and Howitt, 1992; Fiorillo, 2001). The change in the elasticities of demand forces the productivity of sectors to change and further changes the composition of an economy. As a result, the production of primary exports will undergo advancements to secondary products or tertiary sectors. The lack of capital and indivisibility of investment projects are cited as limits to exploitations of diversification potentials at a lower level of development (Acemoglu and Zilibotti, 1997).
9 Potential risks for diversification declines as an income increases and export diversification increases as GDP per capita rises (Imbs and Wacziarg, 2003). But, beyond a certain threshold of the income level, an incentive to diversify declines; as high-income economies have the propensity to be economically and institutionally more stable, and a necessity for diversification declines. Therefore, the growth of the GDP per capita has a positive influence on export diversification in the lower income country, whereas at the higher GDP per capita a further increase in incomes leads to a higher export concentration.
Foreign direct investment (FDI) is mentioned as one of the influencing factors on export diversification. FDI creates a diversification of export either direct to a non-traditional sector or indirect through raising the export of traditional goods which have a smaller share in exports (Gourdon, 2010). However, if FDI is directly poured into an exploitation of natural resources, it is likely to cause an increase in the concentration of exports with natural resources. For instance, Ekholm et al. (2007) examined the impact of FDI on export diversification and found that, under a certain condition, FDI results into export diversification in the South. For the case of a natural resources abundant country, Ekholm et al. (2007) argued that FDI greatly influences vertical diversifications than horizontal export diversification, meaning that most of the transferred knowledge in the process does not change a core of the economy’s export structure.
Trade policy of a country is cited as another determinant of export diversification. Melitz (2003) stated that under protectionist trade policies, a very limited number of firms will be able to participate in the export business since not all firms can cover the fixed cost associated with export activities and it may possibly lead to a more concentration of exports. Likewise, a trade policy that lowers tariffs as a result of trade liberalisation policy improves the country’s access to foreign market capital which in the long-run leads to export diversification as a country adjusts its capacity to serve a more diverse international market.
2.4. Empirical Review
The relationship between export diversification and economic growth is well studied in the empirical literature with the main focus on developing countries. One of the studies was conducted by Al-Marhubi (2000) which used a cross-country sample with 91 countries for the period eight-year from 1961to1988 and it applied a cross sectional country growth regression. He reported the existence of a negative relationship between export concentration and growth. Other studies were conducted in Chile by de Piñeres and Ferrantino (1997) and Herzer and Nowak-Lehmann (2006) which revealed that the country positively profited from its diversified export sector. A negative relationship between the GDP per capita growth and concentration of exports was detected in the study by Lederman and Maloney (2003) from their regressions analysis of both cross-section and panel data. The findings by De Ferranti et al. (2002) affirmed a positive relationship and he further observed that a 1 percentage increment in the concentration of exports is accompanied with a 0.5 percentage fall in the GDP per capita growth.
Some of the empirical studies (e.g. Hausmann and Rodrik, 2003; Hausmann et al., 2007) have developed a theoretical framework and estimations for analysing a linkage between advantages of export diversification and export in the general economic growth. The uniqueness of their approach is based on the argument that it is not a comparative advantage that drives model of economic growth to invest in new activities but the country’s export diversification as suggested in other literature (Dogruel and Tekce, 2011). Hausmann et al. (2007) developed an indicator EXPY which measures the productivity of a country export basket. The EXPY also
10 provides indications for economic developments. The Results of EXPY from their study shows some traded goods (service products, manufactured goods) in the basket have a greater level of productivity than others (primary goods). This implies that both productivity and economic growth of a country depends on what type of goods are produced (Dogruel and Tekce, 2011). Countries which have high-productive goods would experience a faster growth than countries which produce low- productive products.
Data from the product-level exports and increasing returns to scale studied points out that the economy which has a diverse exports mix with sophistication tends to have fast growth (Ramanayake and Lee, 2015). The analysis results of the middle income trap by Felipe et al (2012) suggested that the upper-middle-income5 countries had diversified, sophisticated and nonstandard export baskets and they are near to shift from lower-income countries to middle-income countries group. De Pineres and Ferrantino (1997) confirmed the claims of an endogenous growth theory that export diversification has an influence on long-run economic growth and its underlying emphasis on a role of increasing returns to scale and dynamic spillover effects.
Empirical studies have a limited discussion on export diversification in Africa and their views are generally confined to the level of a country or sub-region. The study conducted by Ben Hammouda et al. (2006) on the diversification profile in Africa found that there is a small amount of diversification and some economies remain poorly diversified naming Burkina Faso and Seychelles. While other countries, like Mozambique and Malawi, were found to have started the process but have not made any significant progress in agricultural products diversification and value addition. Osakwe (2008) studied aid, geography, and resource endowment effects on diversification of exports in Africa and found that aid and resource endowments determine export diversifications in Africa while geography has no influence. Matthee and Naudé (2008) analysed the relationship between export diversity and spatial inequality using South Africa export data from19 regional sectors and found that a less specialised and more diversified exporting region generally experience a higher growth rate.
In view of the above literature, there is no a conclusive empirical evidence on the influence of diversified export composition on economic growth in the African economies. There is a strong theoretical support that a diversified export structure has effects on economic growth. However, it is an undeniable fact that the empirical analysis might paint a different picture of the same.
Do countries with a more diversified export structure in Africa have a higher growth?
This is a central question of this study. From the question, the study tries to estimate the exact impact of export diversification on growth differences using the cross-sectional dataset of 50 African countries. The robustness of the variable in various samples and estimation techniques is tested over other trade variables, specifically, trade openness and export growth, as a growth determinant. In the two dimensions, we can evaluate if, “export diversification is a key force to Africa’s economic growth”.
5
Countries were categorised by the GDP per capital as: high-income above $11, 750; upper-middle-income between $7,250 and $11,750; lower-middle-income between $2,000 and $7,250 and low-income below $2,000.
11 3. EXPORT DIVERSIFICATION IN AFRICAN ECONOMIES
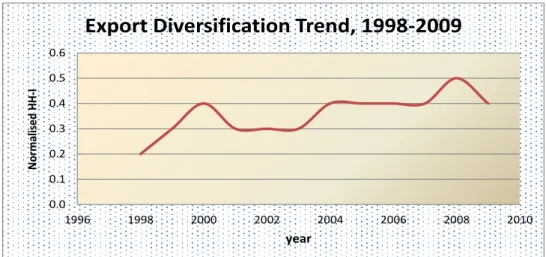
Liberalisation of trade policies and diversification of exports have become the major priorities of trade policies in most of developing countries since the 1990s. Africa in a particular, referring to the AEC and AU (2012) report, “Aggregating regional trade flows, we find that Africa lags behind other regions in terms of export diversification, and is actually moving toward further concentration in the products it exports for the period of 1998-2009” (Karingi et al, 2012, p.15) (also see figure 1). One of the reasons for that is the rise of fuel prices in the world market which enables oil producing countries to export more relative to non-oil producing countries and it made a whole export basket more concentrated. The concentration or diversification of exports seems not undergoing significant changes over the course of 12 years period as shown in figure1and appendix 3.
Figure 1: Average export diversification trend
In addition, the report further pointed out that the composition and pattern of export sectors consist of a majority of industrial sectors which are primary resource-based concentrated in agro- and food processing products in the region. Moreover, the manufacturing value addition is largely low and its undertakings are restricted to the first stage of processing or final stage of blending, and with an exception of South Africa to be the only country which has a complex manufacturing base (Karingi et al, 2012). More than 70% of merchandise exports growth are primary products (see figure 2 and appendix 2). Other countries, apart from South Africa, such as Egypt, Kenya and Mauritius also hold some greater manufacturing ability relative to the rest of African countries (AEC, 2012).
Figure 2: Average manufacture exports growth (% of merchandise exports) 0.0 0.1 0.2 0.3 0.4 0.5 0.6 1996 1998 2000 2002 2004 2006 2008 2010 N or m al ised HH -I year
Export Diversification Trend, 1998-2009
20.0 22.0 24.0 26.0 28.0 30.0 32.0 34.0 1998 1999 2000 2001 2002 2003 2004 2005 2006 2007 2008 2009 Gr ow th Ra te (%) Years
12 Literature offers several accounts for an extreme dependence on the export of primary products in Africa and reasons for the lack of significant developments toward diversification. One of the explanations is a geographical barrier which defines the export composition and performance of a country (Osakwe, 2007). The idea hinges on a high transportation cost for landlocked and geographically isolated countries which limits access to large market and poor infrastructures ultimately restrict the progress of manufacturing sector activities. The high transportation cost and poor infrastructures render African countries to be less competitive and hamper the export of manufactured goods. This idea predicts that countries which are landlocked, or have a limited access to sea, navigable rivers or coast, would have more concentrated export patterns and less manufacturing.
The role of foreign aid is another cited reason for the lack of progress in export diversification in Africa (van Wijnbergen, 1985; Osakwe, 2007). The argument put forward is that a massive inflow of aids to African economies has a potential to raise prices of non-traded items which causes an appreciation of the real exchange rate and a loss of competitiveness in export markets (Osakwe, 2007). Osakwe (2007) claimed that when economies have capital market imperfections, consequences of exchange rate appreciation are potentially severe and they end up affecting the manufacturing sector in terms of externalities such as learning-by-doing process. These consequences have negative impacts on development and growth of manufacturing activities in Africa.
One more explanation for limited export diversification in Africa is the abundance of natural resources (land area, oil, minerals etc) and unskilled human capital. This view arises from the Heckscher-Ohlin model extension by Wood and Mayer (2001; 1998). Their concept suggests that Africa and other third world countries export structures are different due to the abundance of natural resources and human capital. In relative terms, Africa has more land with 30,065,000 square kilometres than Latin America with 17,819,000 square kilometres and East Asia which has 11.84 million square kilometres. The argument in favour of the model is that an abundant land raises the real income and reduces competitiveness by its negative influence on the real exchange rate. For that reason, the abundant land makes it difficult to develop manufacturing industries compared to land scarce economies. In addition to that, a low development in the diversification of export sector emanates from a low level of education of its manpower which forces export production to heavily depend on primary commodity and natural resource which require less skill in the region. In this study, school enrolment as a proxy for human capital is used to capture these effects on growth.
13
4. METHODOLOGY
4.1. Export Diversification Measure
A Normalised Herfindahl-Hirschman Index (HHI) is used which measures a concentration of exports (see Hirshman, 1964; UNECA and AUC, 2012). The HHI index is used to proxy for export diversification. The index is given by the following formula:
HHI = √∑ (( 𝑋𝑖 ∑𝑁 𝑋𝑖 𝑖=1 )) 2 𝑁 𝑖=1 − √𝑁1 1 − √𝑁1 (1)
Where, Xi is the export of product i, and N is the number of products measured. The index H, indicates values 0 ≤ H ≤ 1. An index closer to 1 represents a high concentration of exports (extreme low diversification) and value close to 0 indicates a low concentration of exports (high diversification). It is worth noting that HHI shows how much exports are concentrate and not diversification. Therefore, HHI is interpreted indirectly and in opposite ways regarding concentration and diversification; the high the concentration the lower is diversification.
The normalised Herfindahl-Hirschman Index is estimated using the Africa Development Bank Group dataset created by the IMF Export Diversification and Quality Database. The database dataset harmonises UN COMTRADE6 bilateral trade flow data at the 4-digit SITC based on updated version of the UN–NBER dataset. The database covers 187 countries including most low-income countries and approximately 5,000 products. The toolkit offers indicators on export product diversification and export product quality from 1962-2010. The database was developed by IMF staff under IMF-DFID research collaboration.
4.2. Empirical Growth Model and Estimation
The model estimation in this study is based on the neoclassical growth theory model. The study assumes a Cobb-Douglas production function which is given by:
𝑌 = 𝐾∝ (𝐴𝐿)1−∝ 0 < 𝛼 < 1 (2)
Where 𝑌 is output, 𝐾 is capital, 𝐿 is labour and 𝐴 the level of technology. The growth of Labour and technology are assumed to be exogenously determined at rates 𝑛 and 𝑔 respectively7
. The output is further assumed to be invested at a constant rate 𝑠 and existing capital depreciates at an exogenous rate 𝛿. The model defines 𝑘, capital stock per unit of effective labor, 𝑘 =𝐴𝐿𝐾 and 𝑦, output per unit of effective labour, 𝑦 =𝐴𝐿𝑌 . The following equations are used:
𝐾̇(𝑡) = 𝑠𝑌(𝑡) − 𝛿𝐾(𝑡), The capital accumulation equation (3)
6 UN COMTRADE - The United Nations Commodity Trade Statistics Database 7𝐿(𝑡) = 𝐿(0)𝑒𝑛𝑡 and 𝐴(𝑡) = 𝐴(0)𝑒𝑔𝑡
14 𝐾̇(𝑡) = 𝑠𝑓(𝑘) − (𝑛 + 𝑔 + 𝛿)𝑘, Solow’s basic equation8
(4) 𝑘∗ = ( 𝑠𝐴
(𝛿+𝑛+𝑔)) 1/(1−𝛼)
, Steady state capital labour ratio (𝐾̇ = 0) (5) For empirical specification, equation (5) is substituted into the production function and linearized by taking natural logs on both sides:
𝑙𝑛 [𝑌(𝑡)𝐿(𝑡)] = 𝑙𝑛 𝐴(0) + 𝑔𝑡 +1−𝛼𝛼 𝑙𝑛𝑠 −1−𝛼𝛼 𝑙𝑛(𝑛 + 𝑔 + 𝛿) (6) The term 𝐴(0) take into account of country’s natural resource, institutional quality and weather etc. The assumption implies that 𝑙𝑛 𝐴(0) =∝ +𝜉 where ∝ is a constant and 𝜉 is shocks. Time, 𝑡 will be dropped since it is a cross-country analysis.
𝑙𝑛𝑌𝐿 = 𝛼 +1−𝛼𝛼 𝑙𝑛𝑠 −1−𝛼𝛼 𝑙𝑛(𝑛 + 𝑔 + 𝛿) + 𝜉 (7)
The above equation, (7), is the basis of Solow model prediction that investments (𝑠) and population growth (𝑛) have an impact on real income. For that reason, two variables are included in my basic model specification. However, the centre of this study is economic growth, the growth rate of GDP per capita rather than the steady state income level. In that view, the growth rates of variables is derived by taking a natural log of the Cobb-Douglas production function and then derivatives with respect to time and obtained the following equation;
∆ (𝑌𝐿) = 𝑔 + 𝛼{𝑠 (𝑌𝑘) − 𝛿 − 𝑛 + 𝑔} (8)
Further detailed explanations of above equations are provided in Appendix 1.
In this study, 𝛿 and 𝑔 variables are assumed to be constant across countries. This follows from the argument made by Mankiw, Romer and Weil (1992) that 𝑔 variable reflects the advancement of knowledge which is not specific to a country, and depreciation rates, 𝛿, do not vary significantly across countries. With that view, the model is constructed basing on the population growth and the portion of invested output. 𝑛 is measured as a rate of population growth and s as an investment share of GDP (included as gross capital formation) in the model. Progressively the model is expanded by including; a) Import and export trade shares of GDP, as a measure of international trade openness which proxies for the level of technology too, Export diversification, and Export growth rate. The reasons for including these three alternative variables is that they allow for a technology diffusion across countries by exposing them to new ideas and more advanced methods of production. b) The initial GDP per capita: the literature on growth emphasises the importance of initial values in explaining subsequent growth rates that are captured by the initial value of GDP, c) control variables: namely industry, inflation, Human capital, domestic credits. The selected control variables are considered for both their importance as growth determinants per se and their potential effects on economic growth. Therefore, the final empirical model can be specified as a standard growth model with the following specifications:
8
15
Regression model;
𝑌𝑖 = 𝛼 + 𝛽1(𝐸𝑥𝑝𝑑𝑖𝑣𝑒𝑟𝑖, 𝑂𝑝𝑒𝑛𝑖, 𝐸𝑥𝑝𝑔𝑟𝑜𝑤𝑖) + 𝛽2𝑝𝑜𝑝𝑔𝑟𝑜𝑤𝑡ℎ𝑖 + 𝛽3𝐻𝑐𝑎𝑝𝑖 + 𝛽4𝑃_𝑐𝑎𝑝𝑖 + 𝛽5𝑖𝑛𝑡𝑔𝑑𝑝𝑖+ 𝛽6𝑙𝑖𝑓𝑒𝑥𝑝𝑖 + 𝛽7𝐶𝑜𝑛𝑡𝑟𝑜𝑙 + 𝜀𝑖
Where: 𝑌𝑖 = the GDP per capita growth rate in country 𝑖. The variables that come from
equation (8) are 𝑝𝑜𝑝𝑔𝑟𝑜𝑤𝑡ℎ𝑖= population growth rate, 𝐻𝑐𝑎𝑝𝑖 = human capital growth, 𝑃_𝑐𝑎𝑝𝑖 = the gross capital formation. The interest variables are: 𝐸𝑥𝑝𝑑𝑖𝑣𝑒𝑟𝑖 = export diversification, 𝐸𝑥𝑝𝑔𝑟𝑜𝑤𝑖 = export growth rate, and 𝑂𝑝𝑒𝑛𝑖 = trade openness. Control variables
are: 𝑖𝑛𝑡𝑔𝑑𝑝𝑖 = the (log) initial GDP per capita of country i, lifexpi = life expectancy, 𝐼𝑛𝑑𝑠𝑡𝑦𝑖=
industry, 𝐷𝑐𝑖 = domestic credits. 𝜀𝑖 represents an error terrm
The equation above can be represented in a short functional form below; 𝑌𝑖 = 𝑓𝑢𝑛𝑐𝑡𝑖𝑜𝑛(𝑍𝑖 , 𝑂𝑖 , 𝑋𝑖)
Where: (Zi) are variables of interest, (Oi) =variables that come from equation (8), Xi are typical control variables.
The regression analysis is done using an ordinary least squares (OLS) method and the Generalized Method of Moments (GMM). The GMM is applied to correct a possible endogeneity problem using instrumental variables in the model and for the robustness check of export diversification variable in terms of the model estimation techniques.
A brief discussion of variables is provided in the next section. 4.3. Variables
The key variable in this study is export diversification, analyzed along with other trade variables namely trade openness and export growth. Other control variables are included in the model to control for factors that might affect economic growth. A complete list of these variables, definitions, data source and their measures is provided in table 2 below.
Table 1: A list of variables
Variable Definition and Measure Data source
Dependant variable
GDP per capita growth Annual growth (%) of GDP per capita (2005 constant US$)
World Bank, World Development Indicator
Independent variables
Export diversification Normalised Herfindahl-Hirschman Index Africa Development Bank Group data set Export growth rate Growth rate (%) of exports of goods and
services (2005 constant US$)
World Bank, World Development Indicator Trade openness Exports plus imports divided by GDP. The
import and export data are in national currencies from the World Bank and United Nations data records.
Penn World tables
Gross capital formation Gross capital formation (% of GDP) World Bank, World Development Indicator
Industry Industrial share of GDP (%) World Bank, World
16
Variable Definition and Measure Data source
Inflation9 GDP deflator (annual %) World Bank, World
Development Indicator Population growth Annual population growth rate (%) World Bank, World
Development Indicator Life expectancy Average of life expectancy at birth, total
(years)
World Bank, World Development Indicator Human Capital (school) The sum of primary school enrolment (%
gross) and secondary school enrolment (% gross) divided by 2.
World Bank, World Development Indicator Domestic Credits Domestic credit provided by the financial
(banking) sector (% of GDP)
World Bank, World Development Indicator Initial GDP per Capita GDP per capita of the initial year (2005
constant US$)
World Bank, World Development Indicator It is worth discussing details of each control variable in terms of its meaning, expected influence as well as parameters signs in relation to growth in the model (note: the primary variables of interest were discussed in the previous sections).
First, Population growth: there are disagreements among economist about the relationship between population growth and economic growth. Most economic theorists, persuaded by Boserup (1965), disagree with the classical Malthusian principle that a rampant population growth would negatively affect economic growth. They argue that population growth promotes technological advancement, increases competition, increases investment strategies and help attain economic growth. Moreover, in reference to Blanchet (1991), there is no causal relationship between economic growth and population growth. Therefore, it is reasonable to expect its parameter sign to either be a positive or negative with statistical significance.
Second, Gross capital formation; this is considered to be one of the key factors of growth. This variable includes all local investments in the economy. Its importance to growth lies in the creation of new job opportunities as a result of expansion in production base for the domestic investments (Adhikary, 2011). The employments generated promote higher savings which induce even more investment and increase growth. However, some studies suggest that efficient allocation of capital from less to more productive sectors, assisted by domestic investments, is the one that leads to growth (Kendrick, 1993). Generally, the Gross capital formation helps to improve the quality and quantity of physical infrastructures. It raises the general TFP (productivity) of the economy. The sign of its parameter is expected to be positive and statistically significant.
Third, Inflation; is a widely acknowledged factor that affects economic growth through its influencing role in influencing the macroeconomic stability. A fast output growth and low inflation are two of the most common goals of macroeconomic policy in every economy. Currently, the evidence shows that inflation causes a negative long-run effect on economic growth (Fountas et al., 2006). Hodge (2005) maintains that inflation reduces real interest rates which lead to the far-reaching economic consequences such as slow growth, low savings, reduction of quality of investments, and a miss-allocation of resources. So, a high inflation in the economy is a bad omen to investors and international competitiveness. But, a certain degree of positive inflation is maintained to support the economy to adjust to real shocks if nominal wages
9
The deflator used is the ratio of GDP in current local currency to GDP in constant local currency (WB definition). The base year varies by country. The deflator is different from the one used to calculate 2005 constant US$.
17 and prices indicate descending rigidity. The study includes the inflation variable to account for the macroeconomic stability of countries. It is hypothesised that inflation has a negative and statistically significant impact on countries’ growth rates.
Fourth, Domestic credits (DC): DC is argued to facilitate technological innovations through the intermediary role. The banking sector development increases affordable funds available for investment in the private sector in many developing nations. The variable is expected to have a positive and significant relation with growth.
Fifth, Industries: this is represented by the industrial share of GDP. It includes the value addition in mining, manufacturing, construction, electricity and gas. The study includes it to proxy for an industrialisation process and technological ability in the economies. This variable has theoretical and empirical support to its role for economic growth (Ellahi et al, 2011). It is well agreed that alongside with trade variables, industrial value added speeds up growth. We expect the variable to have a positive and significant result in growth.
Sixth, Initial GDP per Capita: is used to capture the idea of convergence or the catch-up effects that poor economies with low per capita incomes will tend to grow at faster rates than richer economies with larger per capita income. It is hypothesised that this variable has a significant and negative association with growth rates.
Lastly, life expectancy and Human capital variables: these are proxies for social service advancement, literacy and health of a population which indirectly affect working population participation in economic activities. Both variables are hypothesised to have positive and significant signs.
4.4. Data
The dataset used involves a cross-section dataset consisting of 50 African countries excluding Somalia, South Sudan, Namibia, and Lesotho which lack a significant amount of data. The data are collected for a 12 years period from 1998 to 2009 and the period is divided into two sub-periods of six years each. To eliminate or reduce the short-run and medium-run volatility in the data, each variable is averaged into a six years average. The averaging technique is known as “Smoothing Technique”. A six year period is considered as a very long-run period where factors beyond the control of a firm also change significantly as oppose to a long-run period. Factors which are assumed to change in a very long-run are like technology, government policies, social changes etc.
18 5. EMPIRICAL RESULTS AND DISCUSSION
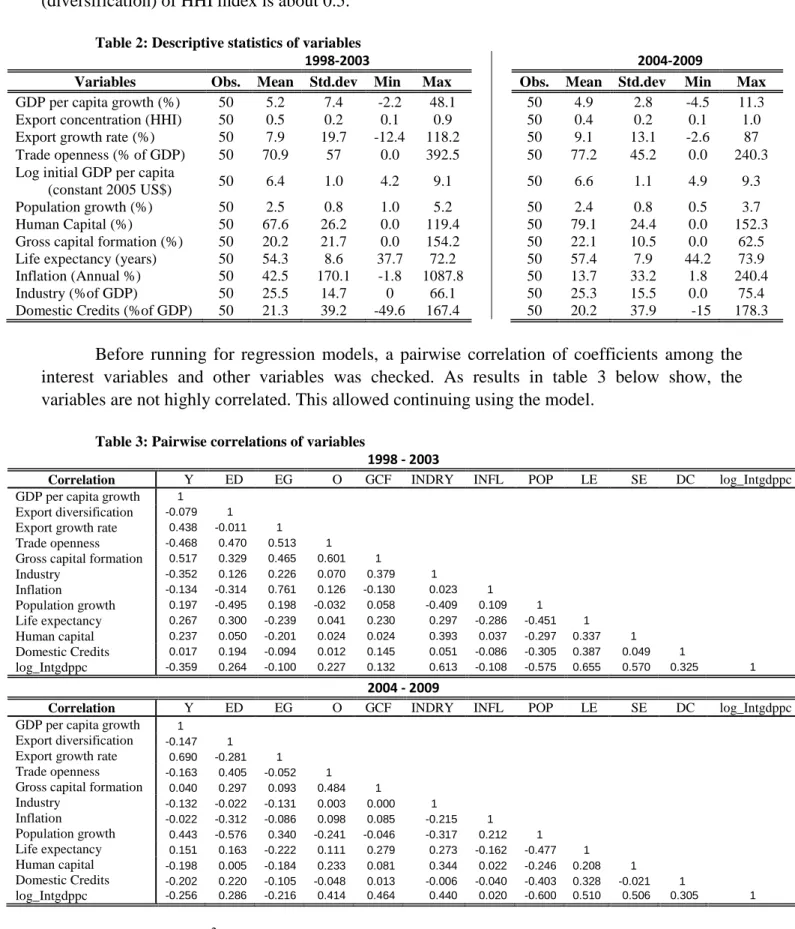
The descriptive statistics of variables is provided in table 2, showing the sample and measures. Across all years and countries in the samples, the average export concentration (diversification) of HHI index is about 0.5.
Table 2: Descriptive statistics of variables
1998-2003 2004-2009
Variables Obs. Mean Std.dev Min Max Obs. Mean Std.dev Min Max
GDP per capita growth (%) 50 5.2 7.4 -2.2 48.1 50 4.9 2.8 -4.5 11.3 Export concentration (HHI) 50 0.5 0.2 0.1 0.9 50 0.4 0.2 0.1 1.0 Export growth rate (%) 50 7.9 19.7 -12.4 118.2 50 9.1 13.1 -2.6 87 Trade openness (% of GDP) 50 70.9 57 0.0 392.5 50 77.2 45.2 0.0 240.3 Log initial GDP per capita
(constant 2005 US$) 50 6.4 1.0 4.2 9.1 50 6.6 1.1 4.9 9.3 Population growth (%) 50 2.5 0.8 1.0 5.2 50 2.4 0.8 0.5 3.7 Human Capital (%) 50 67.6 26.2 0.0 119.4 50 79.1 24.4 0.0 152.3 Gross capital formation (%) 50 20.2 21.7 0.0 154.2 50 22.1 10.5 0.0 62.5 Life expectancy (years) 50 54.3 8.6 37.7 72.2 50 57.4 7.9 44.2 73.9 Inflation (Annual %) 50 42.5 170.1 -1.8 1087.8 50 13.7 33.2 1.8 240.4 Industry (%of GDP) 50 25.5 14.7 0 66.1 50 25.3 15.5 0.0 75.4 Domestic Credits (%of GDP) 50 21.3 39.2 -49.6 167.4 50 20.2 37.9 -15 178.3
Before running for regression models, a pairwise correlation of coefficients among the interest variables and other variables was checked. As results in table 3 below show, the variables are not highly correlated. This allowed continuing using the model.
Table 3: Pairwise correlations of variables
1998 - 2003
Correlation Y ED EG O GCF INDRY INFL POP LE SE DC log_Intgdppc GDP per capita growth 1
Export diversification -0.079 1 Export growth rate 0.438 -0.011 1 Trade openness -0.468 0.470 0.513 1 Gross capital formation 0.517 0.329 0.465 0.601 1
Industry -0.352 0.126 0.226 0.070 0.379 1 Inflation -0.134 -0.314 0.761 0.126 -0.130 0.023 1 Population growth 0.197 -0.495 0.198 -0.032 0.058 -0.409 0.109 1 Life expectancy 0.267 0.300 -0.239 0.041 0.230 0.297 -0.286 -0.451 1 Human capital 0.237 0.050 -0.201 0.024 0.024 0.393 0.037 -0.297 0.337 1 Domestic Credits 0.017 0.194 -0.094 0.012 0.145 0.051 -0.086 -0.305 0.387 0.049 1 log_Intgdppc -0.359 0.264 -0.100 0.227 0.132 0.613 -0.108 -0.575 0.655 0.570 0.325 1 2004 - 2009
Correlation Y ED EG O GCF INDRY INFL POP LE SE DC log_Intgdppc GDP per capita growth 1
Export diversification -0.147 1 Export growth rate 0.690 -0.281 1 Trade openness -0.163 0.405 -0.052 1 Gross capital formation 0.040 0.297 0.093 0.484 1
Industry -0.132 -0.022 -0.131 0.003 0.000 1 Inflation -0.022 -0.312 -0.086 0.098 0.085 -0.215 1 Population growth 0.443 -0.576 0.340 -0.241 -0.046 -0.317 0.212 1 Life expectancy 0.151 0.163 -0.222 0.111 0.279 0.273 -0.162 -0.477 1 Human capital -0.198 0.005 -0.184 0.233 0.081 0.344 0.022 -0.246 0.208 1 Domestic Credits -0.202 0.220 -0.105 -0.048 0.013 -0.006 -0.040 -0.403 0.328 -0.021 1 log_Intgdppc -0.256 0.286 -0.216 0.414 0.464 0.440 0.020 -0.600 0.510 0.506 0.305 1
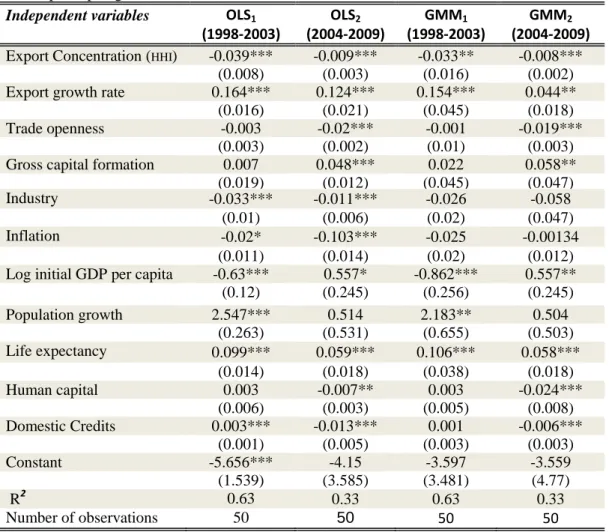
In table 4, the R2 values are high in certain regressions which might indicate more precise predictions. The main difference noticed about the two regressions is in the second-period sample where the R- square decreased. The F-value for all regressions indicates that the model is
19 significant and has predictive power. Therefore, about 63 percent of the differences in cross-country GDP per capita growth in the data are explained by the model for the period of first six years. Moreover, the residuals are observed to have no pattern and are normally distributed with an average Jarque-Bera value of around 3.94.
The interpretation of export diversification results is not direct. The measure used as a proxy for export diversification variable, the Normalised Herfindahl-Hirschman Index (HHI), measures the concentration of exports. The values reported in table 4 relate to the amount of concentration of exports. Its implication for export diversification is that when exports are highly concentrated indicates a low diversification, and a low concentration indicates a high diversification. Therefore, the negative sign shown in the table can be interpreted as the higher the concentration of exports is the lower the GDP per capita growth it turns out to be. In other words, the lesser diversified export is the lower GDP per capita growth. So there is a direct and positive relationship between export diversification and GDP per capita growth rate.
Table 4: Regression results
Dependent variable GDP per capita growth rate
Independent variables OLS1 OLS2 GMM1 GMM2
(1998-2003) (2004-2009) (1998-2003) (2004-2009)
Export Concentration (HHI) -0.039*** -0.009*** -0.033** -0.008***
(0.008) (0.003) (0.016) (0.002)
Export growth rate 0.164*** 0.124*** 0.154*** 0.044**
(0.016) (0.021) (0.045) (0.018)
Trade openness -0.003 -0.02*** -0.001 -0.019***
(0.003) (0.002) (0.01) (0.003)
Gross capital formation 0.007 0.048*** 0.022 0.058**
(0.019) (0.012) (0.045) (0.047)
Industry -0.033*** -0.011*** -0.026 -0.058
(0.01) (0.006) (0.02) (0.047)
Inflation -0.02* -0.103*** -0.025 -0.00134
(0.011) (0.014) (0.02) (0.012)
Log initial GDP per capita -0.63*** 0.557* -0.862*** 0.557**
(0.12) (0.245) (0.256) (0.245) Population growth 2.547*** 0.514 2.183** 0.504 (0.263) (0.531) (0.655) (0.503) Life expectancy 0.099*** 0.059*** 0.106*** 0.058*** (0.014) (0.018) (0.038) (0.018) Human capital 0.003 -0.007** 0.003 -0.024*** (0.006) (0.003) (0.005) (0.008) Domestic Credits 0.003*** -0.013*** 0.001 -0.006*** (0.001) (0.005) (0.003) (0.003) Constant -5.656*** -4.15 -3.597 -3.559 (1.539) (3.585) (3.481) (4.77) R2 0.63 0.33 0.63 0.33 Number of observations 50 50 50 50
Note: Standard errors are reported in brackets, ***at significant level 1% , **at significant level 5%, *at significant level 10%.
The negative coefficient signs of diversification index in tables 4 are similar to Al-Marhubi’s (2000) results. The sign indicates that with other factors, a high export diversification or a lower concentration (specialisation) contributes to a high per capita GDP growth. A similar finding on the negative sign was confirmed by De Ferranti et al. (2002) who found 1 percentage