CHANGES OF THE GROUNDWATER QUALITY IN
SULPHIDE-BEARING MINE-TAILINGS AS A RESULT OF REMEDIATION AT
KRISTINEBERG, NORTHERN SWEDEN
1Lena Alakangas2*, Angela Lundberg and Björn Öhlander
Abstract: At the Kristineberg mine in northern Sweden, sulphide-rich tailings left open for 50 years were remediated in 1996 by applying double dry cover on one part of an impoundment, and raised groundwater level combined with simple till cover on the other part. Groundwater pipes installed in the impoundment were sampled from 1998 during a period of 6 years. The results showed that the groundwater quality varied considerably in the impoundment, even under the same type of cover. Secondarily retained Fe, S, Mg, Mn and Z were remobilised when the groundwater was raised. In the part with raised
groundwater level, the average concentration of Fe ranged from 2700 to 9000mg/lin
1998, and the range for S was 2200 to 7000mg/l. During 2003 the average concentrations had decreased and ranged between 150 and 900 mg/l for Fe and between 130 and 900
mg/l for S. The improvement of the water quality was caused by inflow of less
contaminated groundwater and decreasing sulphide oxidation rate. The redox potential
generally decreased and pH increased. The concentrations of Cd, Cu and Pb in
groundwater decreased rather rapidly all over the impoundment after remediation. In areas with relatively high pH and low redox potential, Al, Cd, Co, Cr, Cu, Fe, Ni, Pb and Zn were almost depleted.
Keywords: mine tailings, sulphide oxidation, remediation, groundwater geochemistry Introduction
Remediation of sulphide mine waste in Sweden is dominated by two methods; soil cover and water cover, (Öhlander et al., 1997; Höglund, 2005). The major aim with the covers is to decrease the oxygen intrusion into the tailings, thereby decreasing the sulphide oxidation. Another aim of using soil cover systems is to decrease the water infiltration, which transports released elements from the oxidation site to the recipients. In 1997 the research programme MiMi (Mitigation of the Environmental Impact from Mining Waste) began, with the aim to improve the methods used to mitigate the environmental problems related to sulphide tailings deposits (Höglund et al., 2005). The Kristineberg mine site in the Skellefte field, northern Sweden was selected as a field area. In 1996, one of the oldest impoundments with sulphide-rich tailings left open for 50 years was remediated. The aim of the present study is to evaluate the changes of the groundwater quality in the impoundment after the remediation. The study was performed during 1998-2003.
1
Paper was presented at Mining and the Environment IV Conference, Sudbury, Ontario, Canada, October 19-27, 2007.
2
Lena Alakangas, Angela Lundberg and Björn Öhlander, Division of Applied Geology, Luleå
University of Technology, SE-97187, Sweden; Lena.Alakangas@ltu.se, Phone: 46920491396, Fax:
Study site-Impoundment 1 at Kristineberg
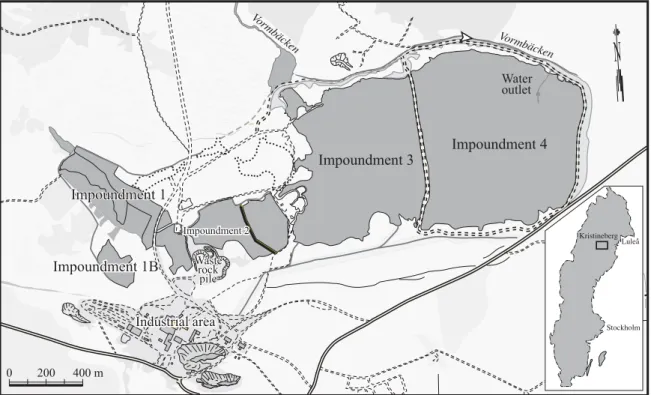
The Kristineberg mining area is located in the western part of the Skellefte district in Northern Sweden, approximately 175km southwest of Luleå (Fig. 1). The regional annual average precipitation in the area is 600-700mm, evaporation 300mm and air temperature 0.7ºC (Raab and Vedin, 1995). The c.1.9 Ga massive pyrite rich ore bodies are intercalated within volcanic rocks and overlain by sedimentary rocks. The Kristineberg Zn-Cu mine has been mined since 1940 by Boliden Mineral AB. The geology of the area and the ores has been described earlier (du Rietz, 1953; Qvarfort, 1989). Five tailings impoundments (Fig. 1) are located within the mining area. Impoundment 1 investigated in this study is the oldest impoundment at Kristineberg. Impoundment 4 N 65°04' Impoundment 2 Impoundment 2 Impoundment 2 Industrial area Industrial area Industrial area Waste Waste rock rock pile pile Waste rock pile Impoundment 1 Impoundment 1 Impoundment 1 Impoundment 3 Water outlet Impoundment 1B Impoundment 1B Impoundment 1B
N
0 200 400 m Vormbäcken Vormbäcken Stockholm Luleå KristinebergFigure 1: The location of the tailings impoundments at Kristineberg, Northern Sweden.
The impoundment area is approximately 0.11 km2, with a tailings thickness from a few to10 m. The
tailings material is relatively well-sorted and could be classified as silt or silty sand (Malmström et al., 1999). The tailings were deposited on till overlying the bedrock, but at some locations, peat was observed between the till and the tailings. Characterisation of the groundwater quality and hydrogeology of Impoundment 1 before remediation was carried out by Axelsson et al., (1986); Qvarfort, (1989) and Axelsson et al., (1991). The mineralogy and the pore-water geochemistry were studied by Carlsson (2002) and Holmström et al. (2001) after remediation, and the results were summarised and discussed by, Malmström et al. (1999), Öhlander et al. (2001) and Höglund et al. (2005). The main gangue minerals in the tailings in Impoundment 1 were, in decreasing order, quartz, K-feldspar, Mg-rich chlorite, talc, plagioclase, muscovite, amphiboles/pyroxenes and biotite. The unoxidised tailings contained approximately 26% pyrite, 1.3% sphalerite, 0.28% chalcopyrite, 0.05% galena and 0.04% arsenopyrite (Holmström et al., 2001). The amount of sulphide minerals in the oxidised zone was generally around 1-2%, and sulphide-associated elements such as As, Cd, Co, Cu, Fe, S and Zn were depleted, as was Mg. The
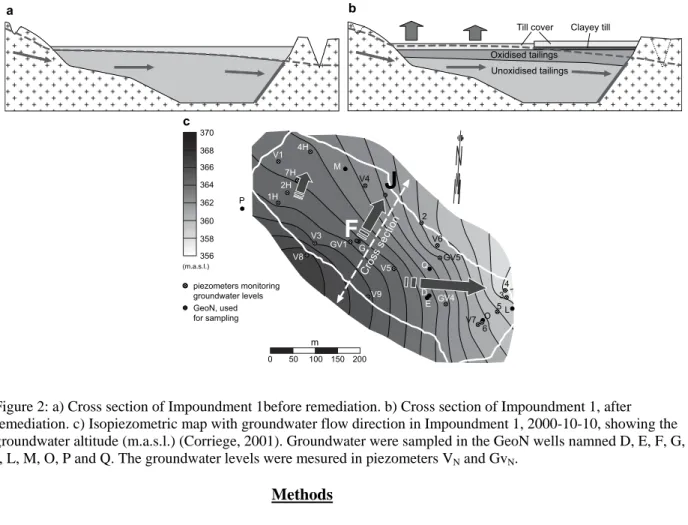
total mass loss of elements from the oxidised zone was almost 43%, and the mobility of metals was in the order Zn>Cd >S >Co >Cu>As>Fe>Ni >Pb for the solid tailings (Holmström et al., 2001). Iron oxyhydroxides were common in the oxidised tailings and occurred as grain aggregates or coatings on the silicate minerals. Impoundment 1 was exposed for weathering during 50 years before remediation started in 1996. The vadose zone consists of both oxidised and unoxidised tailings (Fig. 2a). The thickness of the oxidised zone in Impoundment 1 increased towards south-east and had a thickness of 0.1-1.15 m before the remediation. Two remediation methods were used; one part of the impoundment was covered by an approximately 1m thick layer consisting of unspecified till and the groundwater level was raised to saturate the tailings, the other part was covered with a dry cover consisting of two layers, (Fig. 2b). The lower layer
consists of clayey till (0.3 m) with low hydraulic conductivity (K~5*10-9 m s-1), protected by unspecified
till (c.1.5 m) on top. This till, typical for northern Sweden, consists mainly of quartz and feldspar and has low content of sulphides and sulphide-bound metals (Holmström et al., 2001). Where possible, the groundwater table was raised by sealing of intercepting and drainage ditches. Lime as carbonates was applied between the soil cover and the tailings. Measurements of the groundwater levels (Correge, 2001) during 2000 provided data for an isometric map (Fig. 2c) for Impoundment 1. The highest absolute groundwater level was found along the slope in the south-western part of the impoundment, in piezometer V8. The area around piezometer V8 constitutes a hydrological dome, thus leading the groundwater from this zone to the surrounding areas eastwards (Correge et al., 2001).
Till cover Clayey till
a b c Oxidised tailings Unoxidised tailings
F
V4 V1 V3 V8 G V5 Cross section 2 V9 0 50 100 m 150 200 V4 V7 GV1 M G GV5 E D Q O 6 5 L 3 4H 7H 2H P 1HN
J
V6 4 370 368 366 364 362 360 358 356 piezometers monitoring groundwater levels (m.a.s.l.) GeoN, used for samplingFigure 2: a) Cross section of Impoundment 1before remediation. b) Cross section of Impoundment 1, after remediation. c) Isopiezometric map with groundwater flow direction in Impoundment 1, 2000-10-10, showing the groundwater altitude (m.a.s.l.) (Corriege, 2001). Groundwater were sampled in the GeoN wells namned D, E, F, G,
I, L, M, O, P and Q. The groundwater levels were mesured in piezometers VN and GvN.
Methods
Fourteen groundwater sampling wells and 29 piezometers were installed in Impoundment 1 (Fig.s 2c) and sampled during 1998-2003. The groundwater sampling wells D, E, F, G and I are located in the area with raised groundwater level and simple dry cover and wells M, O and Q in the part with dry cover. Wells E, G, I, L, M and P were installed shallower below the soil surface (3-4 m) than wells D, F, M, O, Q (6-8 m).
A reference well, P, was located on the western slope outside Impoundment 1 in natural till, and samples recharge water. Well L, located just outside of Impoundment 1 in the natural till, sample discharge water. A sampling technique (GeoN groundwater technology, Hallberg, 2005) to minimise oxidation of the water samples during collection was used. The glass bottles in the sampler were acid-washed in 5% nitric acid
for three days and rinsed in Milli-Q® water prior to the sampling occasion. Prior to the sampling the dried
bottles were emptied and refilled with argon several times to decrease the presence of oxygen. The water-filled bottles were kept closed, cooled and in darkness until filtration through 5% acetic acid-washed
0.22µm Millipore® nitrocellulose membrane within a few hours. Determination of pH, conductivity and
redox potential were performed with minor exposure of the samples to air. Redox potential and pH were
measured with Metrohm® Pt electrode and a Metrohm® combined pH electrode, respectively. All redox
potential values were adjusted to the standard hydrogen electrode. The electrical conductivity was
determined with Hanna® conductivity meters. Blank analysis with Milli-Q® water instead of groundwater
contributed <5% in the sample concentration for Ca, Fe, Mg, S, Si, Mn and Pb, and <7% for Al, As, Ni, Co, Zn Si, As, Hg and Ni. The blank contributions for Cu, Cd, Cr and Pb occasionally exceeded sample concentration in samples with low concentrations. The blank concentration during the sampling period was
in average for Cd 0.17 µg l-1, Cr 0.22 µg l-1,Cu 1.50 µg l-1 and for Pb 0.25 µg l-1. The filtrated samples
were acidified and kept dark and cooled until analysis. Dissolved phases of Ca, Fe, Si, Mn, Sr, Zn, Mg, Na, K and S were determined using ICP-AES and ICP-MS was used for determination of Al, As, Ba, Cd, Co, Cr, Cu, Mo, Ni, P, Pb and Zn. The precision was generally better than 5%.
Results and discussion
Physico-chemical conditions in the groundwater in sulphide rich tailings in Impoundment 1
The reference well P located in the till slope, west of Impoundment 1 was expected to represent uncontaminated recharging groundwater. The average pH was around 6, the redox potential was
approximately 400 mV and the electrical conductivity (EC) 6 mS m-1 throughout the sampling period. In
2003 pH was around 6 in the areas with saturated tailings, similar to the reference well P. The pre-remediation average pH in the impoundment (Ekstav and Qvarfort, 1989) was around 5.0. In general, the pH was higher in Impoundment 1 after remediation than before. The pH in the groundwater varied between 4 and 6 in the beginning of the sampling period after remediation, and pH increased in areas where it initially was low as in wells F and G. The increase was not so evident in wells which had relatively high initial pH during 1998, as in wells D and Q. Lower pH was found in the shallower wells than in the corresponding deep wells, probably because the shallow wells are situated closer to the oxidation front. During 2003, the shallower wells approached the same pH as the corresponding deep wells. In general, wells with higher pH showed lower redox potential than wells with low pH. After remediation, higher pH and lower redox potential was, in general, observed in the wells with deeper groundwater levels (wells D, E, M, O and Q) and located further downstream in the impoundment. Wells F, G and I located close to the recharging point, may be influenced by oxygenated inflowing groundwater. Average elemental concentrations in the groundwater in sulphide rich tailings
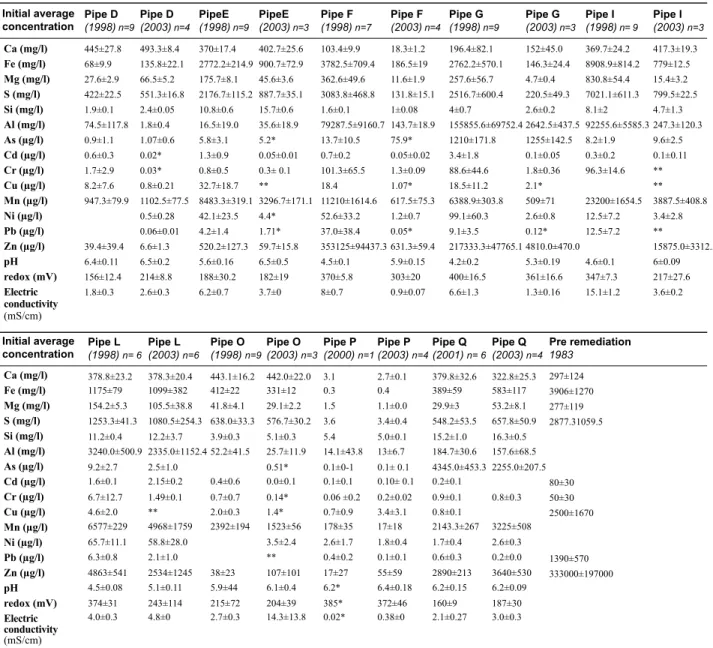
The average concentrations of selected elements in the groundwater before and after remediation are shown in Table 1. Silicate-associated elements such as Ca, Si and Mg had average concentrations <6 mg
l-1 and the average Cd, Cu, Fe, S and Zn concentrations were low in the reference well P. The source of
dissolved Fe, S and Zn and heay-metals such as Cu and Cd probably is minor amounts of sulphides occurring in the surrounding till and bedrock.
Before remediation the average S concentration in the groundwater was 2900 mg l-1 and the Fe
concentration 3900 mg l-1. Similar or higher S concentrations than before remediation were, in general,
found in the beginning of the sampling period. The average concentrations of Fe and S in different wells
values below 900 mg l-1 until 2003. Higher concentrations were found in the shallow wells than in corresponding deep wells. Dissolution of Fe-oxyhydroxides may increase the pH and lower the redox potential; evidence of Fe-oxyhydroxides dissolution was, however, not indicated by geochemical equilibrium calculations. The average molar ratio for dissolved Fe/S in the groundwater was approximately 0.70, rather close to the molar ratio of pyrite (0.5), which was the main source of Fe and S. Fe has additional sources from weathering of pyrrhotite and chlorite. Dissolution of Fe-oxyhydroxides might be a possible source but was not indicated by the calculations. These additional sources could explain the higher molar ratio. For wells with high pH such as D, O, M and Q, the molar ratio was lower with values of 0.1; 0.41; 0.057 and 0.46, respectively. The lower Fe concentration may be a result of precipitation of Fe-oxyhydroxides. This was indicated by equilibrium calculations, which showed over saturation for goethite and equilibrium for amorphous Fe(OH)3 in these pipes (Alakangas and Öhlander, 2007).
Table 1. Average chemical compositionof selected elements in the groundwater in Impoundment 1 during 1998 and 2003.
Initial average concentration
Initial average concentration
Pipe D PipeE Pipe F Pipe G Pipe I
Pre remediation
Pipe D PipeE Pipe F Pipe G Pipe I
(1998) n=9 (1998) n=9 (1998) n=7 (1998) n=9 (1998) n= 9 1983 (2003) n=4 (2003) n=3 (2003) n=4 (2003) n=3 (2003) n=3 Ca (mg/l) Fe (mg/l) Mg (mg/l) S (mg/l) Si (mg/l) Al (mg/l) As (µg/l) Cd (µg/l) Cr (µg/l) Cu (µg/l) Mn (µg/l) Ni (µg/l) Pb (µg/l) Zn (µg/l) pH redox (mV) Electric conductivity (mS/cm) Ca (mg/l) Fe (mg/l) Mg (mg/l) S (mg/l) Si (mg/l) Al (mg/l) As (µg/l) Cd (µg/l) Cr (µg/l) Cu (µg/l) Mn (µg/l) Ni (µg/l) Pb (µg/l) Zn (µg/l) pH redox (mV) Electric conductivity (mS/cm) 445±27.8 68±9.9 27.6±2.9 422±22.5 1.9±0.1 74.5±117.8 0.9±1.1 0.6±0.3 1.7±2.9 8.2±7.6 947.3±79.9 39.4±39.4 6.4±0.11 156±12.4 1.8±0.3 370±17.4 2772.2±214.9 175.7±8.1 2176.7±115.2 10.8±0.6 16.5±19.0 5.8±3.1 1.3±0.9 0.8±0.5 32.7±18.7 8483.3±319.1 42.1±23.5 4.2±1.4 520.2±127.3 5.6±0.16 188±30.2 6.2±0.7 103.4±9.9 3782.5±709.4 362.6±49.6 3083.8±468.8 1.6±0.1 79287.5±9160.7 13.7±10.5 0.7±0.2 101.3±65.5 18.4 11210±1614.6 52.6±33.2 37.0±38.4 353125±94437.3 4.5±0.1 370±5.8 8±0.7 196.4±82.1 2762.2±570.1 257.6±56.7 2516.7±600.4 4±0.7 155855.6±69752.4 1210±171.8 3.4±1.8 88.6±44.6 18.5±11.2 6388.9±303.8 99.1±60.3 9.1±3.5 217333.3±47765.1 4.2±0.2 400±16.5 6.6±1.3 369.7±24.2 8908.9±814.2 830.8±54.4 7021.1±611.3 8.1±2 92255.6±5585.3 8.2±1.9 0.3±0.2 96.3±14.6 23200±1654.5 12.5±7.2 12.5±7.2 4.6±0.1 347±7.3 15.1±1.2 297±124 3906±1270 277±119 2877.31059.5 80±30 50±30 2500±1670 1390±570 333000±197000 493.3±8.4 135.8±22.1 66.5±5.2 551.3±16.8 2.4±0.05 1.8±0.4 1.07±0.6 0.02* 0.03* 0.8±0.21 1102.5±77.5 0.5±0.28 0.06±0.01 6.6±1.3 6.5±0.2 214±8.8 2.6±0.3 402.7±25.6 900.7±72.9 45.6±3.6 887.7±35.1 15.7±0.6 35.6±18.9 5.2* 0.05±0.01 0.3± 0.1 ** 3296.7±171.1 4.4* 1.71* 59.7±15.8 6.5±0.5 182±19 3.7±0 18.3±1.2 186.5±19 11.6±1.9 131.8±15.1 1±0.08 143.7±18.9 75.9* 0.05±0.02 1.3±0.09 1.07* 617.5±75.3 1.2±0.7 0.05* 631.3±59.4 5.9±0.15 303±20 0.9±0.07 152±45.0 146.3±24.4 4.7±0.4 220.5±49.3 2.6±0.2 2642.5±437.5 1255±142.5 0.1±0.05 1.8±0.36 2.1* 509±71 2.6±0.8 0.12* 4810.0±470.0 5.3±0.19 361±16.6 1.3±0.16 417.3±19.3 779±12.5 15.4±3.2 799.5±22.5 4.7±1.3 247.3±120.3 9.6±2.5 0.1±0.11 ** ** 3887.5±408.8 3.4±2.8 ** 15875.0±3312.5 6±0.09 217±27.6 3.6±0.2
* Only one value ** Below the detection limits
Pipe L Pipe L Pipe O Pipe O Pipe P Pipe P Pipe Q Pipe Q
(1998)n= 6 (2003)n=6 (1998)n=9(2003)n=3(2000)n=1(2003)n=4(2001)n= 6 (2003) n=4 378.8±23.2 1175±79 154.2±5.3 1253.3±41.3 11.2±0.4 9.2±2.7 1.6±0.1 6.7±12.7 4.6±2.0 6577±229 65.7±11.1 6.3±0.8 4863±541 4.5±0.08 374±31 4.0±0.3 443.1±16.2 412±22 41.8±4.1 638.0±33.3 3.9±0.3 52.2±41.5 0.4±0.6 0.7±0.7 2.0±0.3 2392±194 38±23 5.9±44 215±72 2.7±0.3 3.1 0.3 1.5 3.6 5.4 0.1±0-1 0.1±0.1 0.06 ±0.2 0.7±0.9 178±35 2.6±1.7 0.4±0.2 17±27 6.2* 385* 0.02* 379.8±32.6 389±59 29.9±3 548.2±53.5 15.2±1.0 4345.0±453.3 0.2±0.1 0.9±0.1 0.8±0.1 2143.3±267 1.7±0.4 0.6±0.3 2890±213 6.2±0.15 160±9 2.1±0.27 378.3±20.4 1099±382 105.5±38.8 1080.5±254.3 12.2±3.7 2.5±1.0 2.15±0.2 1.49±0.1 ** 4968±1759 58.8±28.0 2.1±1.0 2534±1245 5.1±0.11 243±114 4.8±0 442.0±22.0 331±12 29.1±2.2 576.7±30.2 5.1±0.3 0.51* 0.0±0.1 0.14* 1.4* 1523±56 3.5±2.4 ** 107±101 6.1±0.4 204±39 14.3±13.8 2.7±0.1 0.4 1.1±0.0 3.4±0.4 5.0±0.1 0.1± 0.1 0.10± 0.1 0.2±0.02 3.4±3.1 17±18 1.8±0.4 0.1±0.1 55±59 6.4±0.18 372±46 0.38±0 322.8±25.3 583±117 53.2±8.1 657.8±50.9 16.3±0.5 2255.0±207.5 3240.0±500.9 2335.0±1152.4 25.7±11.9 14.1±43.8 13±6.7 184.7±30.6 157.6±68.5 0.8±0.3 3225±508 2.6±0.3 0.2±0.0 3640±530 6.2±0.09 187±30 3.0±0.3
Magnesium, which mostly originates from weathering of chlorite, showed varied average concentrations in different wells in Impoundment 1. When calcite is exhausted chlorite is important for buffering of acid (Höglund et al., 2004). Before remediation the average Mg concentration was rather low, and after remediation some wells had higher average concentrations, which indicate increased weathering of this mineral. To neutralise the acid produced, between 0.2 moles and 1.7 mole of chlorite is consumed. The neutralisation capacity by chlorite for the acid generated by the sulphide oxidation in Impoundment 1 was thus around 60%, if all sulphur is assumed to be generated by the sulphide oxidation and all Mg from chlorite dissolution.
Before remediation, the initial average concentrations of Cd, Cr, Cu, Pb and Zn were 80, 50, 2500, 1390
and 333,000 µg l-1, respectively. In general, a very substantial concentration decrease of these elements
was found throughout in the impoundment after remediation. Compared to the initial concentration after remediation (1998), the decrease during 2003 was most obvious in the saturated tailings, with decreases of 70-90% of the initial average concentrations. In some wells in the part with dry cover, the heavy-metal concentrations increased compared to the initial concentrations during 1998, but not compared to the pre-remediation concentrations. The lowest concentrations of Cd, Cr, Cu, Pb, Ni and Zn were observed in wells with high pH as D, E, O and Q. The effects on trace element concentrations due to pH and redox changes have been presented by Alakangas and Öhlander, 2007. Several elements such as Cu, Pb and Zn have been reported to adsorb to or co-precipitate with secondary formed minerals such as Fe-oxyhydroxides and jarosite (e.g. Stumm and Morgan, 1996; Mc Gregor et al., 1998; Dold, 2001; Höglund et al., 2005). Anions such as those of As and S sorb to Fe-oxyhydroxides at low pH (Bowell, 1994; Courtin-Nomade et al., 2003; Pfeifer et al., 2004; Bednar et al., 2005). Rapid decreases in Cu, Cd and Pb concentrations were observed in the whole impoundment after remediation. In some areas, the concentrations were as low as in the reference well. Metals such as Cu, Cd and Pb were probably adsorbed or precipitated as secondary sulphide minerals due to the change of pH and redox potential (Höglund et al., 2005). Covellite (CuS) is a commonly observed secondary mineral in sulphidic waste, often precipitated just below the groundwater level (Boorman and Watson, 1976). A Cu-enrichment zone with covellite as well as adsorbed Cu was observed in Impoundment 1 below the oxidation zone (Holmström et al., 1999).
The average Al concentrations were in the range of 16-210 000 µg l-1 initially, and decreased during 2003.
The average Si concentration varied in the range 1.6-11 mg l-1 during 1998 and between 1-16 mg l-1 during
2003. The source of Al is mainly aluminium silicates. Relatively high concentrations of Al and Si were found in areas where pH <5, which resulted in precipitation of Al-hydroxides when the pH increased (Alakangas and Öhlander, 2007). Cobalt, Ni and Cr was removed from the water with Al, probably co-precipitated with this metal.
In some wells increased concentrations of As were observed during 2003. The main factors that control the behaviour of As are pH and redox potential. The changes of these probably affected the concentraion of
As. Arsenic (V) is mainly anionic (H2AsO4-, HAsO42-, H2AsO3-) in the pH range 3-9, while As(III) is a
neutral species (H3AsO3). Arsenic(V) is dominated by sorption to Fe-oxyhydroxides compared to the species of As(III) (Bednar et al., 2005). Sorbed As(V) was probably reduced to the less sorbing As(III) when the redox potential was decreased, thus leading to greater mobility of As (Pfeifer et al., 2004). Element concentrations trend
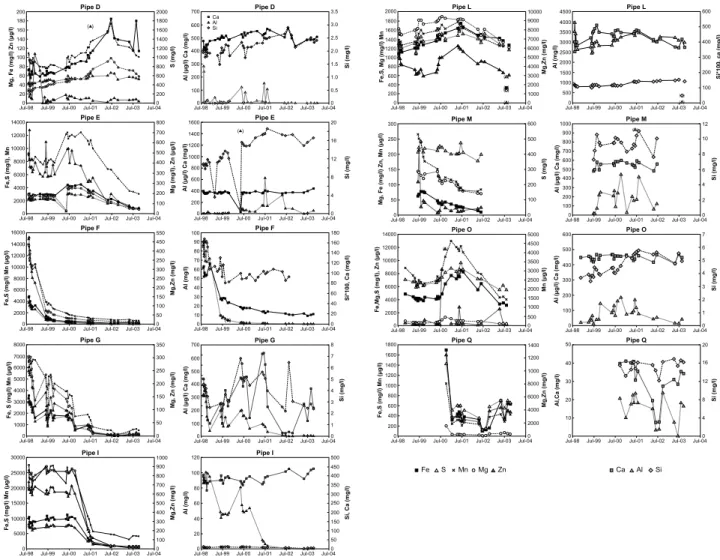
The concentration variations of Mn, Zn, Fe, S, Mg, Si, Al and Ca during 1998-2003 in the different wells are shown in Figure 3. The concentration trends of Mn, Fe, S, Mg and Zn had a similar pattern, which indicates that the concentrations of these elements were controlled by similar or correlated processes. As the groundwater level was raised, dissolution and remobilisation of secondarily retained oxidation products in the vadose zone became possible, and increased concentrations of sulphide-associated elements were
observed in the groundwater (Fig. 3). In the part of the impoundment with dry cover the decreased concentrations of Fe and S was not as rapid as in the saturated part. The general declining concentration of elements such as Fe, S, Mg and Mn in the north-eastern part of the impoundment was mainly due to by decreased rate of infiltrated water (Carlsson, 2002) through the dry cover and decreased sulphide oxidation.
Thepercolating water below the dry cover had high concentrations of many elements (Carlsson, 2002), the
low amount of percolating water did not affect the groundwater chemistry significantly. Slight increase of the elemental concentrations in the north-eastern part with dry cover could be a result of elements released from the water saturated part of the impoundment followed the groundwater displacement through the impoundment. Outgoing water quality from Impoundment 1 during the sampling period can be illustrated by well L, with low and relatively constant elemental concentrations, but with relatively low pH. The decreased concentration of S in well L after 2000 suggests that contaminated groundwater was leaving Impoundment 1, and gradually replaced by less contaminated groundwater. Eight years after remediation (2003) the groundwater was more or less in steady-state conditions with lower elemental concentrations and higher pH than before remediation throughout Impoundment 1.
200 180 160 140 120 100 80 60 40 20 0 2000 1800 1600 1400 1200 1000 800 600 400 200 0
Jul-98 Jul-99 Jul-00 Jul-01
Mg, Fe (mg/l) Zn (µg/l)
S (mg/l)
Pipe D
Jul-02 Jul-03 Jul-04
Mg (mg/l), Zn (µg/l) ( ) AlSi Ca ( ) 700 600 500 400 300 200 100 0 3.5 3.0 2.5 2.0 1.5 1.0 0.5 0
Jul-98 Jul-99 Jul-00 Jul-01
Al (µg/l) Ca (mg/l)
Si (mg/l)
Pipe D
Jul-02 Jul-03 Jul-04
14000 12000 10000 8000 6000 4000 2000 0 800 700 600 500 400 300 300 200 100 0
Jul-98 Jul-99 Jul-00 Jul-01
Fe,S (mg/l), Mn
Pipe E
Jul-02 Jul-03 Jul-04
1600 1400 1200 1000 800 600 400 200 0 20 16 12 8 4 0
Jul-98 Jul-99 Jul-00 Jul-01
Al (µg/l) Ca (mg/l)
Si (mg/l)
Pipe E
Jul-02 Jul-03 Jul-04
( ) 16000 14000 12000 10000 8000 6000 4000 2000 0 550 450 400 250 300 250 200 150 100 50 0
Jul-98 Jul-99 Jul-00 Jul-01
Fe,S (mg/l) Mn (µg/l)
Pipe F
Jul-02 Jul-03 Jul-04
Mg,Zn (mg/l) 100 90 80 70 60 50 40 30 20 10 0 180 160 140 120 100 80 60 40 20 0
Jul-98 Jul-99 Jul-00 Jul-01
Al (mg/l)
Si*100, Ca (mg/l)
Pipe F
Jul-02 Jul-03 Jul-04
( ) 8000 7000 6000 5000 4000 3000 2000 1000 0 350 300 250 200 150 100 50 0
Jul-98 Jul-99 Jul-00 Jul-01
Fe, S (mg/l) Mn (µg/l)
Mg, Zn (mg/l)
Pipe G
Jul-02 Jul-03 Jul-04
700 600 500 400 300 200 100 0 8 7 6 5 4 3 2 1 0
Jul-98 Jul-99 Jul-00 Jul-01
Al (µg/l) Ca (mg/l)
Si (mg/l)
Pipe G
Jul-02 Jul-03 Jul-04
30000 25000 20000 15000 10000 5000 0 1000 900 800 700 600 500 400 300 200 100 0
Jul-98 Jul-99 Jul-00 Jul-01
Fe,S (mg/l) Mn (µg/l)
Pipe I
Jul-02 Jul-03 Jul-04
Mg,Zn (mg/l) 120 100 80 60 40 20 0 500 450 400 350 300 250 200 150 100 50 0
Jul-98 Jul-99 Jul-00 Jul-01
Al (mg/l)
Si, Ca (mg/l)
Pipe I
Jul-02 Jul-03 Jul-04
300 250 200 150 100 50 0 600 500 400 300 200 100 0
Jul-98 Jul-99 Jul-00 Jul-01
Mg, Fe (mg/l) Zn, Mn (µg/l)
S (mg/l)
Pipe M
Jul-02 Jul-03 Jul-04
S Mn Mg Fe Zn 700 800 900 1000 600 500 400 300 200 100 0 12 10 8 6 4 2 0
Jul-98 Jul-99 Jul-00 Jul-01
Al (µg/l) Ca (mg/l)
Si (mg/l)
Pipe M
Jul-02 Jul-03 Jul-04
Al Si Ca ( ) 14000 12000 10000 8000 6000 4000 2000 0 5000 4000 4500 3500 3000 2500 2000 1500 1000 500 0
Jul-98 Jul-99 Jul-00 Jul-01
Fe,Mg,S (mg/l), Zn (µg/l)
Pipe O
Jul-02 Jul-03 Jul-04
Mn (µg/l) ( ) 600 500 400 300 100 200 0 7 6 5 4 3 2 1 0
Jul-98 Jul-99 Jul-00 Jul-01
Al (µg/l) Ca (mg/l)
Si (mg/l)
Pipe O
Jul-02 Jul-03 Jul-04
1800 1600 1400 1200 1000 800 600 400 200 0 1400 1200 1000 8000 6000 4000 2000 0
Jul-98 Jul-99 Jul-00 Jul-01
Fe,S (mg/l) Mn (µg/l)
Pipe Q
Jul-02 Jul-03 Jul-04
Mg,Zn (mg/l) 50 40 30 20 10 0 20 16 12 8 4 0
Jul-98 Jul-99 Jul-00 Jul-01
Al,Ca (mg/l) Si (mg/l)
Pipe Q
Jul-02 Jul-03 Jul-04
2000 1800 1600 1400 1200 1000 800 600 400 200 0 10000 9000 8000 7000 6000 5000 4000 3000 2000 1000 0
Jul-98 Jul-99 Jul-00 Jul-01
Fe,S, Mg (mg/l) Mn
Pipe L
Jul-02 Jul-03 Jul-04
Mg,Zn (mg/l) ( ) ( ) ( ) ( ) ( ) 4500 4000 3500 3000 2500 2000 1500 1000 500 0 600 500 400 300 200 100 0
Jul-98 Jul-99 Jul-00 Jul-01
Al (mg/l) Si*100, ca (m g /l ) Pipe L
Jul-02 Jul-03 Jul-04
( ) ( )
Figure 3: Time series of dissolved Fe, S, Mn, Mg, Zn, Al, Ca, and Si concentrations and pH in the samling wells during 2000-2003. Values within brackets are suggested to be erroneous.
The correlation between Fe and S was stronger for wells in the saturated part of the impoundment than in the dry cover part. This was probably due to the fact that the flushing of elements from the vadose zone in
the saturated part resulted in a uniform element composition. Below the dry cover, the elemental composition in the groundwater was influenced by both the infiltrating water and by the groundwater coming from the upstream tailings area.
In most wells, except for well G, the average dissolved Ca concentrations were rather similar and constant during the whole sampling period in the groundwater in Impoundment 1 (Fig. 3).
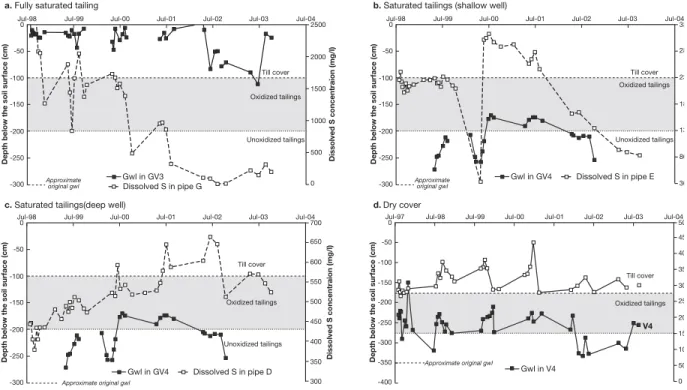
Fluctuations of the groundwater levels
Changes in groundwater level in the part with saturated tailings are exemplified by piezometers Gv3 and
Gv4 and in the dry cover area by V4 (Fig. 4).Before remediation, the groundwater levels were deeper in
the part of the impoundment which was remediated by dry cover than in the part with raised groundwater level. In general, the groundwater level below the dry cover appeared to rise during late spring and autumn in response to snowmelt and autumn rainfall, but the level below the saturated tailings showed a rather irregular pattern. Below the dry cover, the groundwater level changed only slightly as a result of the remediation, with depths below the tailings about 2m before and 1m after remediation. The groundwater level varied less than 0.5 m in the saturated tailings during 1998-2000, which were relatively normal years. After two dry years (2001 and 2002) the level sank with almost 1m. At the area around well I the groundwater reached the soil surface. The affected area with water on the surface was marked by the presence of red iron precipitations on the top of the till cover.
Temporal variations of the groundwater level in the impoundment may have implications for the chemical reactions in the former unsaturated zone. The changes in the groundwater levels result in short-term seasonal variations in the groundwater geochemistry, as illustrated by the changes in dissolved sulphur in Figure 4. In the saturated tailings where the remediation was successful (e.g., around well G; Fig. 4), the sulphur concentration decreased with time irrespectively of the variations in the level. This indicates that elements retained in the former vadose zone were washed away and “steady state” of lower sulphur concentration was achieved. The tailings where never fully saturated in the area around wells D and E (Fig.4b and c), probably due to fractures in the underlying bedrock or poorly sealed ditches. The depth from the soil surface to the groundwater after remediation was still relatively deep and located in or below the oxidised zone in this area. This influenced the dissolved sulphur concentration, with increased concentration when the level was raised into the oxidised zone and retained sulphur was washed away, and decreased concentrations when the level sank. The decreased level was caused by the dry summers, and therefore increased sulphur concentrations may be found if the groundwater level rises. In the deeper well D, the sulphur concentration seemed to be unaffected by the seasonal groundwater fluctuation. The sulphur concentrations in the groundwater below the dry cover were more related to seasonal groundwater-level fluctuations than in the other areas.
There was probably no uniform rise of the groundwater level, since the pre-remediation depths to groundwater surface varied. Areas with shallow groundwater table were therefore saturated before the areas with deeper levels. The groundwater level rise emanated from the area around V8, and the rise of the groundwater level occurred later at lower altitudes eastwards. The elements that were washed away from the former vadose zone probably either followed the lateral groundwater flow or were retained again. The increased concentrations of dissolved S at different times in different areas were therefore affected by the lateral groundwater flow with wash –out products as well as the local wash-out by the gradual groundwater rise. Areas with relatively shallow groundwater table before remediation (around well G) had shallower oxidation front than the area with deeper levels (around wells E and I). In well G the tailings and the cover were saturated rather rapidly after remediation. When the sampling period started in 1998 the wash-out products were replaced by uncontaminated groundwater, as a result of decreased sulphide oxidation. This inflowing water could be expected to have properties similar to that of the reference well P.
Jul-98
a. Fully saturated tailing b. Saturated tailings (shallow well)
c. Saturated tailings(deep well) d.Dry cover
0 2500 2000 1500 1000 500 0 -50 -100 -150 -200 -250 -300
Jul-99 Jul-00 Jul-01
Depth below the soil surface (cm) Dissolved S concentraion (mg/l)
Jul-02 Jul-03 Gwl in GV3 Dissolved S in pipe G Till cover Approximate original gwl Oxidized tailings Unoxidized tailings Jul-04 Jul-98 0 33 28 23 18 13 80 30 -50 -100 -150 -200 -250 -300
Jul-99 Jul-00 Jul-01
Depth below the soil surface (cm)
Jul-02 Jul-03 Gwl in GV4 Dissolved S in pipe E Till cover Approximate original gwl Oxidized tailings Unoxidized tailings Jul-04 Jul-98 0 700 650 600 550 500 450 400 350 300 -50 -100 -150 -200 -250 -300
Jul-99 Jul-00 Jul-01
Depth below the soil surface (cm) Dissolved S concentraion (mg/l)
Jul-02 Jul-03 Gwl in GV4 Dissolved S in pipe D Till cover Oxidized tailings Unoxidized tailings Jul-04 Approximate original gwl 0 50 45 40 35 30 25 20 15 10 50 0 -50 -100 -150 -200 -250 -300 -350 -400
Depth below the soil surface (cm)
Gwl in V4
Till cover
Oxidized tailings Jul-97 Jul-98 Jul-99 Jul-00 Jul-01 Jul-02 Jul-03 Jul-04
Approximate original gwl
V4
Figure 4: The dissolved sulphur concentration versus groundwater fluctation a) in the part of Impoundment 1 with raised groundwater level where the groundwater rise was successful exemplified with piezometer Gv3.
b-c) where the level remained below the oxidised zone after remediation exemplified with piezometer Gv4. d) in the part of Impoundment 1 with dry cover, exemplified with piezometer V4.
Conclusions
Before remediation, Impoundment 1 had high concentration of sulphide-associated elements such as Fe, S, Cu and Zn in the groundwater. Metals released by the sulphide oxidation were also partly secondarily retained in the tailings. After remediation secondarily retained were remobilised by the raised groundwater level. Inflow of less contaminated groundwater as a result of decreased sulphide oxidation rate decreased the elemental concentrations and the redox potential and increased the pH. During 2003, the concentrations of Fe, S, Mn, Mg and Zn in the groundwater were lower than during 1998, and significantly below the pre-remediation concentrations. It took approximately six years (eight year after pre-remediation) before the contaminated groundwater left the impoundment below the dry cover. The decreased amount of percolating water below the dry cover decreased the transport of oxidation products to the groundwater and the decreased sulphide oxidation due to limiting oxygen supply decreased the elemental concentration significant. Rapid decrease of metals such as Cu, Cd, Pb and Zn indicates that these metals were retained in stable phases as precipitates or/and adsorbed onto mineral surfaces in the tailings. They will probably be immobile as long as the conditions with relatively high pH and reduced condition are sustained.
Acknowledgements
This study was financed and supported by the MISTRA research programme “Mitigation of the Environmental Impact from Mining Waste” (MiMi). We would like to thank Milan Vnuk for preparing the figures. The co-operation of Boliden AB is gratefully acknowledged. We also thank all the personnel involved in the MiMi project for constructive and interesting discussions.
References
Alakangas, L. and Öhlander, B., 2007. The behaviour of trace element in groundwater in sulphide-rich tailings after remediation at Kristineberg, northern Sweden. Revised paper submitted to water resources research 070615.
Axelsson, C.L., Ekstav, A., Holmen, A. and Jansson, T., 1991. Efterbehandling av sandmagasin i Kristineberg, Hydrologiska förutsättningar för åtgärdsplan: Lakvattenbalanser och vittringsbegränsande åtgärder. Golder Geosystem AB,
Axelsson, C.L., Karlqvist, L., Lintu, Y. and Olsson, T., 1986. Gruvindustrins restproduktupplag, Fältundersökningar med vattenbalansstudie i Kristineberg. Uppsala Geosystem AB, Uppsala. Bednar, A.J., Garbarino, J.R., Ranville, J.F. and Wildeman, T.R.,2005. Effects of iron on arsenic
speciation redox chemistry in acid mine water. Journal of Geochemical Exploration. 85, 55-62. Boorman, R.S. and Watson, D.M., 1976. Chemical processes in abandoned sulphide tailings dumps and
environmental implication for northeastern New Brunswick. CIM Bulletin. 86-96.
Bowell, R.J.: 1994. Sorption of arsenic by iron oxides and oxyhydroxides in soils. Applied Gechemistry. 9, 279-286.
Carlsson, E., 2002. Sulphide-rich tailings remediated by soil cover- Evaluation of cover effiency and tailings geochemistry, Kristineberg, northern Sweden. Ph.D 2002:44, Department of Environmental engineering, Divison of Applied Geology, Luleå University of Technology, Luleå, ISSN 1402-1544, ISRN LTU-DT--02/44--SE.
Correge, O., Carlsson, E. and Öhlander, B., 2001. Geochemical investigation of the groundwater in sulphide-bearing tailings remediated by applying till cover, Kristineberg, northern Sweden. Securing the Future, International Conference on Mining and the Environment, Skellefteå. Sweden, June 25- July 1, pp. 97-115
Courtin-Nomade, A., Bril, H., Neel, C. and Lenain, J.-F., 2003. Arsenic in iron cements developed within tailings of a former metalliferous mine-Enguiales, Aveyron, France. Applied Geochemistry. 18, (3), 395-408.
Dold, B., 2001. Element cycling and secondary mineralogy in porphyr copper tailings as a function of climate, primary mineralogy and mineralogy processing. Journal of Geochemical Exploration. 74, 3-55.
du Rietz., 1953. Geology and ores of the Kristineberg deposit, Västerbotten, Sweden. Series C No 524, Årsbok 45 (5). Sveriges Geologiska Undersökning, Stockholm.
Ekstav, A. and Qvarfort, U., 1989. Metallbalans Kristineberg. Kvartärgeologiska avd. Uppsala Universitet, Uppsala.
Hallberg, O., 2005. Geo Nordic AB, Homepage: www.geonordic.se. 050310, 2005, Stockholm, Sweden Holmström, H., Ljungberg, J., Ekström, M. and Öhlander, B.,1999. Secondary copper enrichment in
tailings at the Laver mine, Northern Sweden. Environmental Geology. 38, 327-342.
Holmström, H., Salmon, U.J., Carlson, E., Petrov, P. and Öhlander, B.,2001. Geochemical investigations of sulphide-bearing tailings at Kristineberg,Northern Sweden, a few years after remediation. Science of the total environment. 273, 111-133.
Höglund, L.-O., Herbert, R.B., Lövgren, L., Öhlander, B., Neretnieks, I., Moreno, L., Malmström, M., Elander, P., Lindvall, M. and Lindström, B., 2005. MiMi- Performance Assessment - Main Report. MiMi Report 2003:3, ISBN 91-89350-27-8, Stockholm.
Jambor, J.L., 1994. Mineralogy of sulfide-rich tailings and their oxidation products. Mineralogical association of Canada, Waterloo, Ontario, 22, pp. 438.
Lundgren, T., 1997. Bersbo pilot project-physical behaviour seven years after covering the waste rock piles. Fourth International Conference on Acid Mine Roch Drainage, Vancouver, Canada, 1997, pp. 1419-1434
Malmström, M., Werner, K., Salmon, S. and Berglund, S., 1999. Hydrogeology and geochemistry of mill tailings impoundment 1, Kristineberg, Sweden: Compilation and interpretation of pre-remediated data. MiMi, Mitigation of the Environmental Impact from Mining Waste programme, Stockholm. Mc Gregor, R.G., Blowes, D.W., Jambor, J.L. and Robertson, W.D., 1998. The solid-phase controls on
the mobility of heavy metals at the Copper Cliff tailings area, Sudbury, Ontario; Canada. Journal of Contaminant Hydrology. 33, 247-271.
Pfeifer, H.-R., Gueye-Girardet, A., Reymond, D., Schlegel, C., Temgoua, E., Hesterberg, D.J. and Chou, J.W., 2004. Dispersion of natural arsenic in the Malcantone watershed, Southern Switzerland: field evidence for repeated sorption-desorption and oxidation-reduction processes. Geoderma. 122, 205-234.
Qvarfort, U., 1989. Sandmagasin från sulfidmalmsbrytning; En kartläggning och inventering. Uppsla University, Quaternary Geology, Uppsala.
Raab, B. and Vedin, H., 1995. National atlas of Sweden climate, lakes and rivers. Wiksell international, Stockholm, Sweden, pp. 176.
Stumm, W. and Morgan, J.J., 1996. Aquatic chemistry, chemical equilibria and rates in natural waters. John Wileys & sons, Inc., New York, pp. 1022.
Öhlander, B., Carlsson, E., Holmström, H. and Elander, P., 2001. Characterization of the tailings and the till cover in impoundments 1 and 1B, Kristineberg mine, northern Sweden. MiMi report 2001:2, Revised 2004ISSN 1403-9478, ISBN 91-89359-16-2.
Öhlander, B., Ljungberg, J. and Holmström, H., 1997. Geochemical studies of Floodings as Treatment Method of Mine Waste:in situ studies of weathering and transport processes at Stekenjokk, Northern Sweden. 166. Swedish Environmental Protection Agency, Stockholm.