VTI särtryck *
Nr 211 0 1994
Stability, steerability and braking
performance of heavy duty vehicles:
A review of experimental and theoretical
research and regulation proposals by VTI
in Sweden
Olle Nordström
Reprint from Heavy Vehicle Systems A Special Series
of the International Journal of Vehicle Design, Volume 1,
No. 1, 1993, pp 34 62
Swedish National Road and
VTI särtryck i
Nr 211 0 1994
Stability, steerability and braking
performance of heavy duty vehicles:
A review of experimental and theoretical
research and regulation proposals by VTI
in Sweden
Olle Nordström
Reprint from Heavy Vehicle Systems - A Special Series
of the International Journal of Vehicle Design, Volume 1,
No. 1, 1993, pp 34 62
Väg- och
transport-farskningsinstitutet
,
Heavy Vehicle Systems
A Special Series of the
International Journal of Vehicle Design
Editor-in-Chief: M A Dorgham
Executive Editor: M EI-Gindy
Stability, steerability and braking performance of
heavy duty vehicles: A review of experimental and
theoretical research and regulation proposals by VTI
in Sweden
Olle Nordström
Swedish Road and Traffic Research Institute, Linköping, Sweden Abstract: The stability, steerability and braking performance of heavy duty vehicles and vehicle combinations have become more important for traffic safety as demand on speed and load performance has increased. For about 20 years the Swedish Road and Traffic Institute (VTI) has carried out experimental and theoretical research concerning these factors with the aim of investigating the state of the art, identifying means of improving performance and proposing minimum performance requirements. The research has primarily dealt with the following problem areas: dynamic yaw stability and handling properties at constant speed; roll over stability; stability, steerability and braking efficiency in braking manoeuvres primarily with vehicles equipped with anti-lock braking systems under winter conditions; space requirements at low and high speed; and tyre characteristics. Large complex test facilities, such as a truck tyre test facility with ice testing capacity and a moving base truck driving simulator, have been developed by VTI. The aim of this paper is to give an updated and expanded version of an earlier review (Nordström, 1989) of these research and development activities and give the present VTI position concerning methods of testing and desirable performance requirements.
Keywords: antilock, braking, driving simulator, dynamics, heavy duty vehicle, overturning, roll over, simulation, split friction, stability, steerability, test methods, truck, tyre test, vehicle design, winter test.
Reference to this paper should be made as follows: Nordström, O. (1993) Stability, steerability and braking performance of heavy duty vehicles. A review of experimental and theoretical research and regulation proposals by VTI in Sweden, Heavy Vehicle Systems, Special Series., Int. J. of Vehicle Design , Vol. 1, No. 1, pp. 34-62.
1 Introduction
The Swedish Road and Traffic Research Institute (VTI) is a governmental research
organization dealing with research and testing concerning road building, traffic
engineering, human factors, road vehicles and lately also some railway research.
VTI s road vehicle research is mainly safety oriented, and deals with both crashworthiness and crash avoidance problems. For about 20 years great emphasis has
been laid on research concerning the dynamic performance of heavy vehicle
combinations.
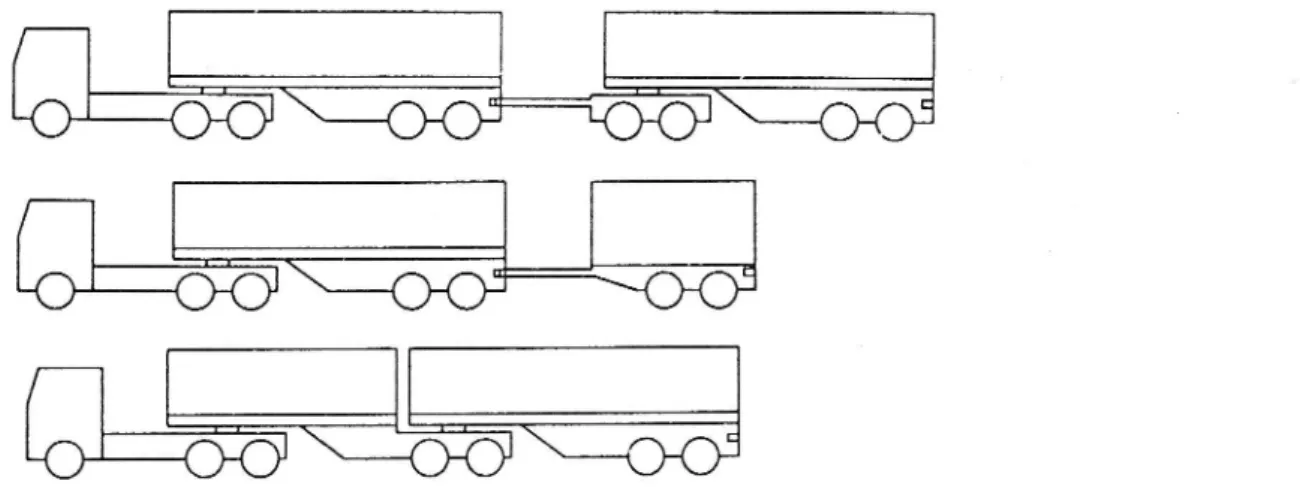
The great majority of Swedish heavy vehicle combinations consists of a truck and a
full trailer with a permissible total length of 24m. This type of combination, as well as
tractor and semitrailer and truck and centre axle trailer combinations has a speed limit of 70 km/h (Figure 1).
Figure 1 Heavy vehicle combinations speed limited to 70 km/h in Sweden.
Figure 2 Heavy vehicle combinations speed limited to 40 km/h in Sweden except after special approval.
Combinations with two trailers (Figure 2) have a speed limit of 40 km/h. Individual
approvals for 70 km/h can, however, be obtained if certain technical specifications are
fulfilled. These restrictions are regarded by some industry transport research organisations as a major obstacle to an improvement of the road transport system in
Sweden. The VTI research has to a large degree been motivated by the actions of these organisations and the concern of the road safety authorities to ensure that the level of road safety is maintained or improved.
The research has primarily dealt with the following problem areas: ' dynamic yaw stability and handling properties at constant speed. ' roll-over stability.
' stability, steerability and braking efficiency in braking manoeuvres.
Special interest has been shown in evaluating performance on ice-covered roads. The aim of this paper is to give an updated and expanded version of an earlier review of this research (Nordström, 1989a) and give the present VTI position concerning
desirable performance and methods of testing and legislative enforcement.
2 Dynamic stability at constant speed
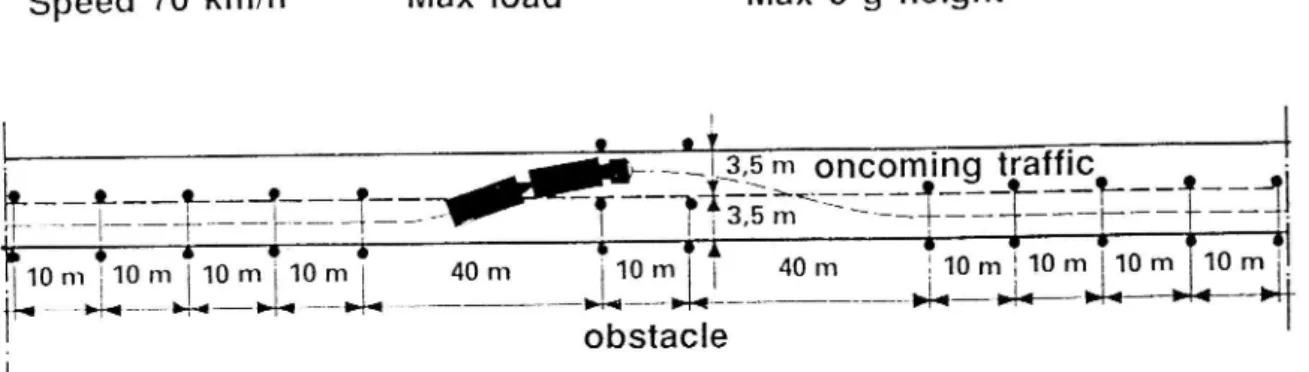
In the period 1970 72 full-scale experiments and computer simulations were carried out with combinations with up to three articulations. The dynamic stability was tested by
means of a double lane change manoeuvre (Figure 3). This manoeuvre was chosen as it
was regarded as the most severe in real traffic.
Figure 3 VTI double lane change test. Real test track configuration (Nordström and Ståhl, 1984).
Speed 70 km/h Max load Max 0 g height
!
l
'
n135
' t ff'
4
&___.L..____Q_.__,___ ___ : _ __Ty_:..£__ , m °_m1'29_ ___1L.____1|__._njra |c .
r ___ ' __._ ' ___ | __ ___/,, .. T -3,5m Xx -r - 1 .
j' 10 T Ör" Ö 6 IA * 3 's i
Pwmimmliomnom: 40m |")le 40m ;10mil10m10m 10m_
i __ __>+._ __>,4__
A.
%<_..> ___ ___ mu u
A
I
obstacle
I
In the simulation the motor vehicle was steered by an automatic controller in such a way that the lateral acceleration of the e.g. followed a prescribed sinusoidal curve with 1.75 rn/s2 as the maximum value. Based on these studies VTI proposed that minimum performance requirements in this manoeuvre should be set for heavy vehicle combinations (Nordström et al. 1972; Nordström and Strandberg, 1974; Strandberg et al.
1975). These were the following:
' rearward amplification of side slip angles should not exceed 2,
' the side slip angles must not exceed 150 mrad (8.6 deg),
' the oscillatory damping must be such that all side slip angles are less than 20 mrad
(1.15 deg) when the first axle of the combination has reached a point 75m away from
the entrance of the exit corridor,
' the roll-over risk must be smaller than 1 (no wheel lift must occur), and
' the lateral axle deviation must stay within certain limits ensuring that the vehicle combination stays on a 7m wide road.
In the period 1972 to 1981 further development of the simulation program was made, (Nordmark, 1976), and new simulation studies were made including about 400 heavy
vehicle combinations (Nordmark and Nordström, 1977; Nordmark and Nordström, 1978;
Nordström and Nordmark, 1978) The results indicate that few articulation points are desirable. At the same time other parameters are just as important from stability point of
view.
It is desirable to have
' a short distance between dolly pintle hook and the first semitrailer rear axle (or load
' long wheelbase on the trailers,
' high tyre cornering stiffness which increases proportional to the load,
' a low centre of gravity height,
' high roll stiffness,
' optimize roll or side force steer on the trailer axles.
These findings agree with later studies made at UMTRI in Michigan USA, Canada,
England and the Federal Republic of Germany (Mallikarjunarao and Fancher, 1978;
Fancher and Mathew, 1990; Ervin and Guy, 1986; Hales, 1975; Sharp, 1979; P ug,
1983).
In 1981 a final report (Nordström and Nordmark, 1981) was published. The
recommendations in the report were basically the same as those of 1972, but in addition
an approval system based on simulation results was outlined in more detail.
In 1984 the test procedure was used in full-scale experiments on ice in comparative
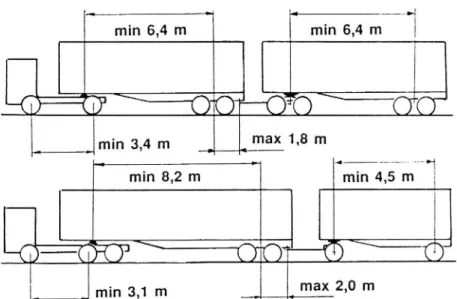
testing (Nordström and Ståhl, 1984). The results indicated that suitably designed A-train type (Figure 4) double combinations could perform as well as or slightly better than a typical Swedish truck and full trailer combination in the terms of maximum speed without exceeding the track limitations. The truck full trailer combination which happens
to have far from optimal dynamic performance could negotiate the track at 60 km/h with trailer skid as limiting factor. The doubles could do 60 and 65 km/h. The lower
performance was limited by understeer of the three axle tractor probably caused by too high friction in the fifth wheel turntable. The doubles were also tested with the yaw motion of the dolly relative to the first semitrailer eliminated. This prevention of dolly jackknife did however not improve the lane change performance in terms of maximum
speed.
Figure 4 A train configuration recommended for 70 km/h speed limit 1984.
_ vv " min 6,4 m min 6,4 m
\
O O JOD
max 1,8 mO'G
min 3,4 m min 8,2 m min 4,5 m\
OO
\-max 2,0 m min 3,1 mBased on these tests and other considerations it was decided to give provisional
permits for doubles of the tested configurations or with more favourable design to be
driven at speeds up to 70 km/h. Special requirements were also set for the brakes that had to be equipped with load sensing valves and/or an antilock system. In practice antilock
In 1986 and 1988 further lane change tests on ice were made with two special double
combinations in order to have them approved for 70 km/h. The first combination had a
yaw restrained centre axle trailer as second trailer (Figure 8, vehicle No. 13). The other
combination was a conventional A train with short wheelbase three axle tractor where the
non driven middle axle was tested both steered and rigid. The test results were regarded
as successful and were very similar to those obtained in 1984, i.e. about 65 km/h limit speed.
In these tests a single three axle truck was used as a reference. This vehicle performed marginally better. The limiting factor for the double combinations was trailer swing of the
rearmost trailer. In the 1988 test the yaw angle rearward amplification was measured to
be 1.6 at the rearmost trailer. No clear preference concerning steered or rigid tractor middle axle was found in this test.
In 1989 it was proposed that double combinations should be approved for 70 km speed limit on a self certification basis if they fulfilled certain dynamic stability and steerability performance demands. The vehicles would have to be equipped with
ECE/EEC approved antilock brake systems.
The dynamic stability and steerability would be approved by means of a computer simulation of the double lane change developed by VTI.
A more user-friendly PC-based version of the program has been developed for this
purpose with master examples for seven different configurations of vehicle combinations
according to Figure 5.
Figure 5 Heavy vehicle combination configurations simulated by the VTI TFK PC double lane change test program DUOBLE PC .
g
x
The performance requirements are somewhat changed compared with those originally
proposed in 1972 in order to allow a simpler practical validation of the simulation test results if needed.
The maximum allowed rearward amplification is still 2, but the reference variable has been changed to yaw velocity instead of side slip angle. The limitation of lateral axle
deviation is and the no wheel lift requirement remained unchanged.
Tyre cornering stiffness characteristics has an important influence on the simulation results. These characteristics vary not only with tyre type but also with road surface and
inflation pressure.
To safeguard for these variations the simulations are to be made with reference tyre data which represent the low limit of what can be expected on a wet asphalt or concrete
road in normal conditions. Presently used values of cornering stiffness are however higher than those used in the studies presented earlier by VTI and are based on more
recent measurements.
The double combination with best stability performance is expected to be of the
so-called B-train concept with only two articulation points where the second semitrailer is coupled directly to a fifth wheel at the rear end of the first semitrailer. It is however still important to keep the axle load centre of the first semitrailer close to the fifth wheel for the second semitrailer.
In Sweden several applications have been made for approval of combinations consisting of a tractor a semitrailer and a centre axle trailer. Unlike the typical B train
rear semitrailer where the load is placed between the axles the centre axle trailer has a
considerable load platform length behind the axle centre. On such a trailer it is possible to get the centre of gravity behind the trailer axle(s) which would give a tendency to oscillatory instability above a critical speed which would very well be within the operating speed. The experience with this kind of combination seems to be very small and no literature on the subject has been found.
3 Roll over stability
Compared to a passenger car the roll-over stability of a loaded heavy duty vehicle is very
low. The most critical cases are when the cargo density is such at a vehicle height of 4 metres or even more can be utilized. From safety point of view a high roll over limit is
obviously desirable. Against this stands the desire to be able to carry the largest possible load volume and weight.
Figure 6 Static roll over test rig with hydraulic actuators (Nordström et al., 1987).
In Sweden the maximum combination length is 24 m and the maximum weight is 56 000 kg and is planned to be raised to 60 OOO kg. This is longer and heavier than in any other European country, but the load per metre vehicle length is lower and allows for
lower e.g. height.
After full-scale static tests of a number of representative Swedish trucks and trailers
4 m/s2 -Further studies were considered necessary and were also carried out but did not change the new recommendation given in 1981 (Nordström and Nordmark, 1981).
Since then investigators in USA, Australia and Canada have come to similar conclusions (Fancher and Mathew, 1990; Sweatman, 1984 and 1988; Delisle and Pearson, 1986).
The effects of sloshing in partly filled road tankers have also been investigated by
VTI (Lidström, 1977; Strandberg, 1977; Lidström and Strandberg, 1978). Scale 1:10
model tanks of different shapes with and without longitudinal baffles were exposed to
lateral motion controlled by a computer program. The liquid forces and accelerations were measured and used as feedback input to the program which simulated a double lane
change with varying frequencies (Figure 7). With 50% load volume it was found that the
increase in overturning risk compared to a rigid load could be up to somewhat more than
two times. Tests with different numbers and shapes of longitudinal baf es showed that
three vertical baffles increase the resonance frequency well above the region that can be
expected in the vehicle.
Figure 7 Computer controlled model test rig for simulation of lateral sloshing in road tankers
(Strandberg, 1977). ( FORCE TRANSDUCERS
I
[I
ACCELEROMETERLABORATORY EQUIPMENT i
HYDRAULIC SERVO
LIOUID FORCES AND MOMENT INTERFACE
REFERRED TO TANK CENTRE ELIMINATION OF TANK INERTIA FORCES
SCALING SCALING
ANALOGUE VEHICLE MODEL VEHICLE MODEL
COMPUTER 4 INDEX OR INDEX Os
OPERATIONS
PREDETERMINED MANOEUVRE DAVIS OR HARMONIC EVALUATION RECORDING VEHCILE MODEL INDEX ?R
k.
Still no regulations concerning roll over stability exist in Sweden. However, the
proposal made in 1989 concerning a simulated lane change test incorporates a maximum allowed c.g. height for the different units in the combination determined by the manufacturer. By definition the tractor will be subjected to a maximum lateral acceleration of 1.75m/s2 in the lane change. With an assumed rearward amplification of 2 the rearmost trailer could then be exposed to 3.5m/s2 which must not result in a wheel lift. The proposed regulation also incorporates a requirement to state the static overturning
The decision to increase the maximum combination weight to 60 000 kg makes e.g.
height limiting regulations still more important.
4 Stability steerability and braking ef ciency in braking manoeuvres
4.1 General
To ensure desirable accident avoidance performance it is necessary that the braking system of a heavy duty vehicle and especially of a heavy duty vehicle combination can be applied with full control force and still maintain stability and steerability. At the same time a high utilization of available road friction must be obtained. This is valid for all
load and friction conditions.
Conventional braking systems without load sensing valves for heavy vehicles will tend to give wheel locking at emergency braking on low friction and with the vehicle
unladen also on high friction. These problems can be reduced, but not eliminated by load
sensing valves.
In Sweden these valves were once made mandatory for heavy vehicles, but were not
successful. The functional problems especially on trailers were so great that the
requirement was abandoned.
Despite improved technology load sensing valves have still not gained any popularity
on a voluntary basis except perhaps for airsprung vehicles.
4.2 Braking performance of Nordic heavy vehicles in use
The braking characteristics of heavy vehicle combinations in Denmark, Finland, Norway
and Sweden were investigated by means of tests on the road and on low speed roller brake testers on in total 400 combinations (Strandberg, 1989) randomly selected from the traffic on suitable roads.
The theoretical advantage of load sensing valves could not be confirmed in this study. On the contrary the results indicate that maladjustment still is a significant problem that reduces the braking efficiency at full load and result in wheel locking at almost the same deceleration as for vehicles without these devices. The trailers were in general
underbraked relative to the truck or tractor at high pressures. Poor brake adjustment
resulting in long pushrod stroke was one of the reasons for poor braking efficiency despite mandatory automatic adjustment. Very short strokes were also associated with a
reduction in braking efficiency.
In Sweden lightly laden vehicles showed significantly smaller braking force/pressure
ratio than fully laden vehicles. As these vehicles had no load sensing valves the results could indicate glazing effects due to the low brake forces used in the unladen condition
which then recovered when in the laden condition after a transition period.
There is however a possibility of bias if drivers with laden vehicles with poor brakes
or overload were warned by their colleagues and changed their route.
4.3 Heavy duty vehicle braking systems in the future
malfunction is an important part of the solution to the present brake system problems.
An antilock braking system is an example of such a system designed to prevent wheel
locking due to overbraking. This solves the problems of stability and steerability in an emergency braking situation. Normally the braking efficiency is also improved. However, under normal braking conditions these systems are inactive. A system for automatic brake
force adaptation between a truck and a full trailer has been introduced on the Swedish market by the Swedish company VBG under the trade name Bromsgyro . This system is
fully contained on the truck and consists of a coupling force sensor, a variable pressure reduction valve driven by an electric motor and a controller. A display shows the driver the degree of pressure reduction and whether the trailer is over- or underbraked in relation
to the truck.
4.4 VTI proposalfor complementary winter service requirements to be added to the ECE/EEC requirements for antilock braking systems (ABS)
In Sweden icy roads can be expected during a considerable part of the year. Safe braking under these conditions is a considerable problem. Antilock braking systems with good performance on ice are therefore expected to give a significant reduction in traffic accidents where braking is involved.
The United Nations Economic Commission for Europe (ECE) has developed a large
number of international road vehicle regulations. The ECE Regulation No. 13 addresses
brakes and has contained since 1979 an annex concerning requirements for antilock
brakes. A revised version became effective in 1987. The same rules have also been adopted by the European Economic Community (EEC) in 1986 (Oppenheimer, 1985).
Sweden took an active part in the establishment of the revised version of the
ECE-antilock regulation, but has still not adopted it in its national legislation. The author of
this paper represented Sweden in this work and has also been responsible for several
studies (Nordström, 1983; Nordström and Ståhl, 1984; Nordström, 1986, 1987a, 1987b,
1988) concerning antilock system performance carried out by the Swedish Road and
Traffic Research Institute (VTI).
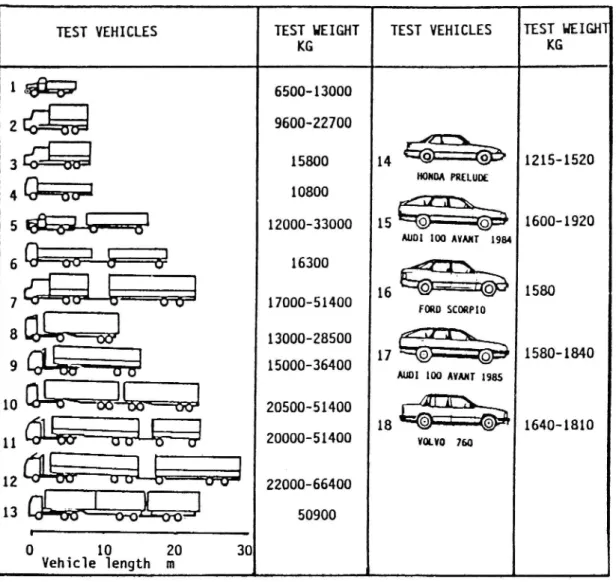
The VTI investigations have been made with heavy vehicles and vehicle combinations from about 5000 to more than 65 000 kg as well as for a number of passenger cars as shown in Figure 8. Five different antilock systems for heavy vehicles and three for passenger cars have been tested. Based on these investigations winter
service test methods and requirements are proposed to be added to the ECE/EEC
regulations. These are:
' J turn braking test on ice,
' split friction test with very low friction on one side,
. straight line braking on ice,
' transition from low friction to high friction surface.
A hybrid laboratory test is envisaged as a future possibility of checking these
performances for electronic antilock systems. In this test the vehicle is stationary and
Figure 8 Vehicles used by VTI for antilock braking tests (Nordström, 1987).
TEST VEHICLES TEST HEIGHT TEST VEHICLES TEST HEIGHT
KG KG 1 © 6500-13000
agg
000000000
. 4. 15800 14 9 0" 1215-1520 HONDA PRELUII4 (3:55;
10800
__
12000-33000 15 G) © AUDI 100 AVANT 19846 W
16300
_
,...-ååå 52%
00 *©=='©' 0000
7 17000-51400 FWD SCORPIOin
l
;
1600-1920l
l
1
l
' - - .-.- 13000-28500 "» - - 1580-18409 m
15000-36400
AUDI 100 AVANT 1985©
©
10 Mia?; 20500-51400 """-11 20000-51400 m", 760 MW.] ' 12 * 22000-66400 13%%?
00000
U vI
l
300 10 20 Vehicle length m J tum test on ice
General Vehicles with antilock system also on the steered wheels will if they meet the
requirements of a straight braking efficiency test certainly possess some degree of steerability. On very low friction surfaces a bad antilock system may, however, give either very poor stability or very poor steerability, due to high slip levels and poor slip distribution between front and rear axles. In both cases the expected safety benefits will
not be obtained and in the unstable case it might even be more dangerous to use such an antilock system than a conventional brake system or an antilock system acting only on the
rear wheels. It is therefore essential to test the steering qualities during emergency braking on low friction in a special test.
This is also important for trailers as the steerability and stability of a vehicle
combination also depends on the performance of the trailer.
A driver controlled J-turn test is proposed. Open loop tests were found to be too severe for heavy vehicles which are normally somewhat oversteered during antilock braking. A J turn test is less space demanding than a steady state circular test.
Figure 9 J-tum antilock braking test with driver control: test track configuration (Nordström, 1987).
Vehicle width + 1.5 m
Vehicle width + 0.5 m
Test specifications The driver controller J turn test on ice is illustrated in Figure 9 and
has the following specifications.
' The track surface shall consist of ice with a lateral friction corresponding to a
maximum cornering speed between 40 and 60 km/h.
The test track shall have a 30 m long entrance corridor, 0.5 m wider than the vehicle,
followed by a 100 m radius Circular track 1.5 m wider than the vehicle. The test procedure comprises
' determination of maximum cornering speed without braking (VM),
' determination of the deceleration (ax) from the maximum speed (V0) from which the vehicle can be braked with full pedal force.
Optional reference test are
' locked wheel straight line braking from 40 km/h on the same surface,
' determination of an ECE-type maximum constant deceleration in the turn without
wheel looking from 75% of VM based on front axle braking.
Performance requirements The following stability/steerability performance is proposed ' to stay within the track boundaries with all parts of the tyre treads,
' not to exceed a steering correction of +/ 180 degrees,
' to have a stability/steerability factor ES not less than 0.64 where ES = (VO/VM)2, i.e.
successful braking from 80% of the maximum cornering speed,
' the braking efficiency EBY = ax/ay, with the maximum cornering acceleration (ay) as
reference, is proposed to be at least 0.5,
be at least 0.90,
' the braking efficiency EBE = aX/aECE, based on the maximum deceleration without
wheel locking, to be at least 0.75.
The test is also proposed for trailers which shall be tested in combination with a worst
case motor vehicle with an approved antilock system.
Figure 10 J-tum antilock braking test with driver control. Test results showing
stability/steerability factor and braking efficiency EBY (Nordström, 1987).
(I) ' f V V ' V V V ' *v wv vvl f v v- f v f .. A O I
*
0.64 I
*
054
*
I I I l 1 " ' A A I'. __ 39.69.0919
0.5 _o 01Heavy duty vehicles
< Passenger cars 4
A. Y Y r r T T
ofs 1.0 0 0,5 1.0
BRAKING EFFICIENCY EBY
BRAKING EFFICIENCY EBY
' Y " 7 * Y V v ' V S T A B I L I T Y / S T E E R A B I L I T Y F A C T O R E S ST AB IL IT Y/ ST EE RA BI LI TY F A C T O R E 0
Test results Results from the closed loop J-turn test are presented in Figures 10 and ll. Figure 10 illustrates the relationship between the stability/steerability factor ES and the braking efficiency EBY for heavy duty vehicles and passenger cars.
Figure ll presents the relationship between ES and EBL also with separate results for
passenger cars and heavy duty vehicles. The diagrams show no correlation between the
stability/steerability factor and the braking efficiency.
Results from test with increasing initial speed have, depending on the tyre equipment, given both increasing and decreasing braking efficiency. From the diagrams can be seen
that if all results were to be accepted, ES should be at least 0.5 instead of the proposed at
least 0.64. The latter choice is based on the opinion that this value is more representative for the state of the art. The vehicles that did not meet this requirement should be
Figure 11 J-tum antilock braking test with driver control. Test results showing
stability/steerability factor and braking efficiency EBL (Nordström, 1987).
w w v * v f.*v *" V ' " ' ' w ' i v f v f v f v v I. | E 4 I 4
s *
|- .'
| A bl de
0 1 I' *
o. , (<3 1.04 | menu a I 1.0 4 | _ . . . U- . | 1 >, 4 | . .. 1 . 0 = 4 | o |. b .- . 5 | u o . 4 _. | -__J l m 1 m 0 64|_._._. _ __ __ _ ( l 0.64 L,__.A_CC?p.t_aP_li _ .., ( 4 I 1 1 c: " Lu 0.9 & 0.54 0-9 * E 0.5 i 1z *
+
e +
~
x )->. 4 = 1 d : . * £ l a_-_J Heavy duty vehicles co
m 1 = 4 Passenger cars -<
: f v v v v ' ' f f m T v v T W f v v Yi
<0 0 1.0 2.0 0 1.0 2.0
BRAKING EFFlC|ENCY EBL BRAKING EFFIClENCY EBL
Splitfriction test with very low friction on one side
General To reduce cost and yaw moment and torque effects in the steering when
braking on a surface with different friction for the left and right hand side wheels (split friction surface) antilock systems have been made with only one regulator per axle that adjust the brake force on the axle to the lowest friction. If this is very low as for instance
on ice this can result in extremely long braking distances compared to individual wheel
braking. This is shown in Figure 12, which also illustrates that the present ECE/EEC regulation is not very efficient as well as the improvement achieved with a proposed
change originating from WABCO. Unfortunately this weakness still exists in the latest revision of the ECE Regulation 13 approved in 1992 that will soon be effective.
Test specification - The split friction test which is already part of the ECE/EEC regulations is illustrated by Figure l3. The test track consists of two parallel tracks, one
with a high friction K1 and the other with a low friction K2.
The test is performed from an initial speed of 50 km/h in three steps. The two first steps give the values of K1 and K2 by means of maximum constant pedal force single axle braking without wheel locking. The third step gives the split friction braking ratio Z3 (Braking ratio - deceleration/9.81.)
' a maximum lateral displacement where no parts of the tyre treads cross the common
track boundary,
' a maximum steering correction of 120 degrees within the first two seconds and 240
degrees during the test of the stop,
' a minimum braking ratio 23 = 0.75 (4K2+Kl)/5 but not less than the low friction K2.
Figure 12 Effects of different split friction braking efficiency requirements, (Nordström,; 1987).
High friction coeft. K1-0.5
High friction braking ratio Zi-O.5 ow friction braking ratio 22-K2
___Select low control 23-Z 2
\
\i
I \ LI
I|\
individual controi23-0.5(21+22) ECE/EEC requirement 2330.75(4K2+K1)/5 23>K2 WABCO requirement 23e(422+21)/5 \ \ i \ \ \ on P\ B R A K I N G D I S T A N C E F R O M 5 0 K M / H 0 o'.1 0:2 0:3 0:4 0:5 016 0,7
LOW FRICTION COEFFICiENT K2
Figure 13 ECE split friction test procedure and new requirements proposed by VTI (Nordström,
1987).
ECE/EEC : K1min-0.5 K2maxtO.5KI 23!0.7S(4K20K1)0.2 235K?
B LOV! rare-non ut: En i
Vo-BO kul/h ... ... ... ... ... ...
MAX STEERING CORRECTION
cafe---TIME T 0-2 sek 2-Tsiop soil pnoposgo NEW K2max : 0.40 K1 or WINTER SERVICE 22max -.- 0.40 21
REQUIREMENTS 2320.2(422021)
The ECE/EEC perfomance requirements are
The last requirement in combination with an allowed ratio K2/Kl as high as 0.5 is a major weakness in the regulation as it allows an efficient select low system to pass the test. This type of system adjusts the total braking force to the low friction.
Proposal for winter condition requirements As a realistic compromise it is proposed that the braking efficiency formula should be based on the actually achieved antilock
braking ratios Zl and ZZ instead of 75% of K1 and K2, and become 23 = 0.2(422 + Zl).
It is also proposed that the ratio Z2/Zl must not exceed 0.4 and Z2 not exceed 0.15. It is
furthermore proposed that the applicable requirements should also be met by trailers as
they can represent a large part of the total combination mass. The trailer should be tested
together with a representative towing vehicle equipped with an approved antilock system.
braking. When Zl, Z2 and Z3 are calculated the rolling resistance of the towing vehicle
can be set to 0.015 for driven wheels and 0.010 for non-driven wheels.
Test results VTI has performed tests on split friction surfaces with ice as low
friction surface and sand bonded to the ice with water as high friction surface. The peak
friction coefficients were about 0.1 and 0.6 and very similar locked wheel values. The tests took place during six winters from 1980 to 1988. The tested vehicles are shown in Figure 8.
The systems represent different control strategies from select low to individual
wheel control. The test results are shown in Figures 14, 15 and 16.
Figure 14 Split friction test results. Comparison with optimum performance (Nordström, 1987).
O 23 ' Heavy duty vehicles
; n Passenger cars 10095
*
/
I 0.41 4 (9 /x5
Å,.
?: 0.3 /. % 75% m / / ' zO: 0.2. ( /:/ . ) / / 50;. 9 //./ / select a: / ' /' low < & 0.1 / // / // 25%1 t: / ) / ..J /// /s;
///
0.1
ofz
ola
OT.4
OPTIMUM BRAKING RATIO O.5(Z1+Z2)
In Figure 14 the braking ratio Z3 obtained in the split friction test is compared to the
optimum braking ratio defined as (Zl + Z2)/2. The braking ratios Zl and ZZ are those obtained by antilock braking tests on the high and the low friction surfaces. Braking ratio
: deceleration/9.81. It can be seen that the select low systems have a braking efficiency
of only 27 45% of the optimum braking compared to values between 67 and 90% for
systems with higher degree of individual wheel control.
In Figure 15 the braking ratio Z3 is compared to the minimum required the WABCO
proposal. The tested vehicles with select low ABS did not meet this requirement.
In Figure 16 test results are compared to the ECE/EEC requirement. This is easier to meet than the WABCO proposal.
Figure 15 Split friction test results. Comparison with WABCO proposal (Nordström, 1987).
O . Hv ' v '
... 23 eavy duty vehicles _
'_'; x Passenger cars 23/2 ,
$ o 44
/
<
z l /z
»
/
CI 0.3 ' x t /;
- .3/
O 0 : 0.2* : 9/ l 9 . / m . select L / > low: 0
/
.
*
ä
/
co / 071 072 o.'3 0.'4 zw WABCO MIN.REQ.BRAK|NG RATIOFigure 16 Split friction test results. Comparison with ECE/EEC requirements (Nordström, 1987).
O 23 'Heavy duty vehicles 23-25
;( nPassenger cars_ / 0: 0.4 x / . o ' / Z & / å 0.31 . ' x x/ . :: xo!
m
.. s: /
z
,
/
9 0.2< / i 5 / E / U- 4 < i... 0 1 /:
/
& I a)5.1
ofz
073
0T4
ZE
ECE MIN. REQ. BRAKING RATIO
Influence of the type of trailer ABS The ECE/EEC antilock regulations at present do
not have a split friction test for trailers. This means that trailers with axle by axle select low type ABS may be used even when individual control ABS is required for the towing
vehicle. In a new revision of the regulations a new category of trailer ABS is however
introduced for which a split friction test with similar performance requirements as for
motor vehicles is required.
VTI carried out tests in 1988 with a partly laden truck weighing 16 400 kg and a fully
laden trailer weighing 22 600 kg. The truck had an individual control ABS and the trailer had two versions of the same ABS. One version had select low control and the other individual control. Tests with the conventional system only were also made. On the split friction track the tests with the select low system gave 25% lower deceleration than with
longer braking distance from 50 km/h.
ABS - braking compared to best driver braking In 1984 split friction tests were also carried out to compare performance with and without an antilock system (Nordström and Ståhl, 1984). Four unladen heavy vehicle combinations (vehicles 6, 7, 10 and 11 in Figure 8) were used. All were equipped with load sensing valves and WABCO antilock systems.
Three skilled drivers took part in the test, but each combination was only tested by one
driver.
The result of these tests was that the braking efficiency in most cases was 10 to 20% higher with the normal brake system than with the antilock system in operation. The efficiency of the antilock system was about 80% of (Zl+ZZ)/2. Both with and without antilock system it was possible to keep the vehicle within a 3.5 m lane. The steering and
braking task was, however, more difficult without antilock system. The maximum
steering angles were about 900 with and 1350 without antilock system.
Straight line braking on ice
General Straight line braking on a homogeneous surface is the classic and basic way of testing braking performance of vehicles. The ECE/EEC antilock braking regulations prescribe straight line low friction braking tests. The friction level is however allowed to be as high as 0.4. A test on ice is therefore regarded as a desirable winter service approval
requirement.
Tests carried out by VTI Straight line antilock braking tests on ice have been made
in comparison with
' locked wheel braking,
' best driver control braking,
' peak friction measured with single axle braking according to the ECE/EEC antilock
regulation,
' constant slip peak friction measured at 40 and 20 km/h with the friction test trailer
BV11 and with the friction test vehicle BV12 (see Figures 17 and 18) both developed at VTI. BV11 had a 4.00 8 tyre and BVl2 a 560 15 PIARC Europe tyre both with
rib tread, in accordance with the ISO Technical Report TR 8349 on friction
measurement.
Tests have been made from initial speeds ranging from 70 to 35 km/h for trucks and trailers and for passenger cars from 110 to 50 km/h.
Most of the tests have been carried out in the temperature range 500C to 200C but tests have also been made near OCC and down to 300C. Except in 1980 the tests have been made on ice roughened by a special multiwheel trailer with studded passenger car
tyres developed by VTI which is shown in Figure 19. The treatment results in a somewhat
higher and more uniform friction and reduces the polishing effects which tend to lower
Figure 17 Friction test trailer BV11 (Nordström, 1987).
Reference
wheel
Figure 18 Friction test vehicle BV12 (Nordström, 1987).
Figure 19 Multiwheel trailer with studded passenger car tyres for ice conditioning treatment (Nordström, 1987).
Figure 20 Straight line antilock braking efficiency in relation to locked wheel braking, (Nordström, 1987). >-20 ' ' ' * 1:0
tå
3515 l (» _ Å 9 01 vvvf'vvvvvvvv - , - - - . - - f z 0 0.5 1.0 1.5 2.0 ABS/Z STRAIGHT LINE BRAKING EFFICIENCYN U M B E R O F V E H I C LE L O W E R B R A K I N G E F F Lock
Figure 21 Straight line antilock braking test results. Comparison with test driver performance, (Nordström, 1987).
ABS IZDriver) 100
W 0,078/0,073
107
Econ/0,069
112
O,116/0,080 146
Figure 22 Straight line antilock braking test results. Comparison with friction test trailer BV1 1, (Nordström, 1987).
(ZABS/KBV11) °°
50
100
]§QL
AAAALLLALLAAA @ 0,17/0,17 100då 0,15/o,17 88
Egg O,17/0.17 100 )Figure 23 Straight line antilock braking test results. Comparison with ECE/EEC friction coefficient, (Nordström, 1987). (ZABS/KECEHOO
$20. . .1199- . 1.5.0.
O,17/O,16
#105
0,21/o,2o
106
& Gå OAS/0,17 94 & 0,11/0,09 123ååå
0,17/0,23 74då 0,15/o,14
107
Figure 24 Straight line antilock braking test results, (Nordström, 1987).
2 IK 100 ( ABS BV12)
50 100 150
0,17/O,16 106
$35 0,15/0.16
94
From the figures it can be seen that as a rule the braking efficiency with an antilock brake system is higher than with locked wheels and also higher than with normal brakes
using best driver performance. In tests with laden and unladen vehicles, the unladen
vehicles tend to get higher deceleration but not necessarily higher braking efficiency based on the peak friction value.
The 75% efficiency required by ECE/EEC regulations is not always met on ice by antilock systems for heavy vehicles. For the passenger cars tested with and without studs
the efficiency is close to lOO%.
Longitudinal friction coefficients obtained with the reference tyres on the friction test
vehicles BV11 and BV12 according to the constant slip method gave the same values as
the peak friction coefficients obtained by single axle braking according to ECE
Regulation 13 both for a truck and a passenger car with standard tyres ( peak = 0.17). Discussion According to Annex 10 in ECE Regulation 13 normal brakes are
allowed to have a braking efficiency of 50% at a friction coefficient of 0.2. It could
therefore be debated if the braking efficiency requirements on antilock braking systems on ice should be as high as 75% of the peak friction coefficient. The test results indicate
that 90% of the locked wheel friction could be a more suitable requirement. A locked
wheel test is also the simplest and least expensive alternative. To avoid stability problems the locked wheel braking tests on ice are recommended to be carried out from an initial
speed of 40 km/h.
Proposalfor a straight ahead braking test on ice Based on the field test experiences and theoretical considerations the following test is proposed
Test surface The test surface shall be ice with a locked wheel friction of 0.1 +/ 0.05
measured with the test vehicle itself or with the friction test vehicle BV11 or equivalent equipment. Roughening of the ice by means of a special multi wheel trailer according to
Figure 19 is recommended.
Test speed The initial speed should be 40 km/h for vehicles with tyres without studs and 50 km/h for vehicles with tyres with studs (additional test for passenger cars).
Braking test Locked wheel and antilock braking stops shall be made with a pedal
force that on high friction would give at least 5 m/sz. The mean value of the results from
at least three tests of each type should be used for the efficiency calculation. For each test
the mean deceleration is calculated by the formula: a = 5.56/T m/s2
where Tis the time from V: 35 km/h to V: 15 km/h. Minimum requirement on braking e ciency
a ABS/äL 2 0.9 or (ZABs/ZLOCK) 2 0.9
where
& ABS is the mean deceleration with the antilock system operation (ZABs = a ABS/9.81).
äL is the mean deceleration with all wheels locked (ZLOCK = äL/9.81).
Trailer tests Trailer tests should be made by braking the trailer only and correcting for the rolling resistance of the towing vehicle. The rolling resistance coefficient for non
driver wheels may be assumed to be 0.01 and for driven wheels 0.015.
Alternative test methods The test may also be performed according to the procedure prescribed by ECE/EEC regulations but on the same ice surface. It is considered as more
difficult to carry out and meet the requirements if this test is used.
Low to high friction braking test
General When a vehicle with normal brakes is braked with locked wheels on a surface
with very low friction and suddenly encounters a transition to a high friction surface the braking torque corresponding to the pedal force applied by the driver is immediately fully
utilized up to the limit of adhesion for each axle as they pass on to the new surface.
In the same situation, but braking with an antilock braking system fully adapted to the low friction, there is a risk that the pressure recovery might be very slow and result in unacceptably long braking distance compared with a normal braking system. The ECE/EEC antilock braking regulations therefore demand a test in this respect. The requirement on the high/low friction ratio is however only 2:1 which is low for winter
service conditions.
Tests carried out by VTI Tests with one heavy duty truck antilock system on ice with very low friction resulted in pressure drops to near zero with recovery rates of not more than 3 bars per second that could not be influenced by a sudden transition to high friction. This corresponds to about 1.5 seconds to reach 4.5 m/s2 deceleration. Transition tests with other systems indicate that 0.7 seconds is a reasonable target from a technical point of view.
into account. At 50 km/h an additional time delay of 0.7 seconds will cover all practical cases. A total deceleration transition time from 1.5 m/s2 to 4.5 m/s2 of 1.5 seconds for
heavy duty vehicles and 1.0 second for passenger cars has been considered to be a
reasonable requirement for winter service.
Proposed winter service test The test shall be performed with full brake application
at a pressure that corresponds to a deceleration of at least 5 m/s2 starting on a low friction surface which must not give the vehicle a higher deceleration than 1.5 m/s2 with the
antilock system in operation. The vehicle speed at the transition from low to high friction must not be less than 50 km/h. The high friction surface must allow antilock braking deceleration of at least 4.5 m/sz. This deceleration must be reached within 1.5 s for heavy
duty vehicles and within 1.0 5 for passenger cars. This time is measured from the front
axle transition time.
5 Hybrid laboratory testing - a future type approval procedure?
The practical difficulties are considerable, both technically and economically, in obtaining test tracks that give the desired friction characteristics and which are large enough for safe high speed and cornering tests. In fact they are so severe that ECE/EEC regulations regard peak friction coefficients up to 0.4 at 40 and 50 km/h as low, and do not specify speed or slip characteristics of the tyre road adhesion very accurately. Furthermore the problems connected with brake lining characteristics must not be forgotten.
For antilock systems with electric wheel speed signals these problems can be
eliminated by real time computer simulation of the tyre/road characteristics, brake torque characteristics and vehicle motion dynamics including wheel speed sensor signals. The real vehicle that is to be tested is connected to the computer through an interface so that
the simulated wheel speed signals are received by its antilock system controller and the
wheel brake cylinder pressure measured by sensors on each wheel are fed back to the computer. During the test the vehicle is stationary in the laboratory with the engine
running. The test engineer has only to apply the brakes after starting the computer
program.
This technique has been used by VTI with promising results (Palmkvist and Nordström, 1983). Until now it has been possible to simulate:
' straight braking on a homogeneous surface,
' straight braking on a split friction surface with steering corrections based on yaw
motion feedback,
' J-turn braking with constant steer input applied at the same time as the brakes,
' braking on a surface with changing friction can also be simulated as the computer
program contains two tyre models for each wheel.
Validation simulations have been performed with a two axle truck with an unladen
weight of 6500 kg and a laden weight of 13 000 kg. The vehicle was equipped with three different types of antilock systems. This vehicle was also used in the already mentioned
tests on real ice tracks, split friction tracks as well as on high friction tracks. The
' straight braking on homogeneous ice; initial speed 10 and 20 m/s,
' straight braking on a split friction surface; initial speed 10 m/s,
' J-turn braking on ice with constant steering input corresponding to 100 m radius
steady state cornering applied at the same time as the brakes; initial speed 11 m/s,
' straight braking on a high friction surface with the peak friction coefficient 0.6;
initial speed 20 m/s.
In all the tests the ranking order in performance of the antilock systems was the same
in simulation and real test. The general characteristics in terms of deceleration, lateral
acceleration and yaw behaviour over time were also quite well reproduced. This also applies to wheel speeds and brake pressures. Tests were made both with identical tyre data on front and rear wheels and with some what reduced friction on the rear wheels. The best results were obtained in the latter case. This is in line with the fact that ice
friction is reduced by the polishing effect of slipping tyres. In this case the front tyres
polish the ice for the rear tyres. It is not believed that this method of testing can replace all real world activities, but it looks promising as a future complement for evaluating antilock system performance under conditions that are too difficult, expensive or
dangerous to require in real type approval tests.
New soft and hardware with a specially designed parallel processor system has recently been developed at VTI (Palmkvist, 1989). The purpose was to reduce the computing time for wheel velocities and tyre forces from 5 to 1 ms and at the same time allow for more wheels and more detailed tyre data. The system is however not yet incorporated in the hybrid ABS-simulation program.
6 Truck tyre testing
Truck tyre data are very important for the simulation of heavy vehicle dynamics. To be able to obtain these data in a well controlled environment a truck tyre test facility with the capacity to test on ice has been built at VTI (VTI Annual Report 1988/89 and 1990/91). The test wheel rig is stationary and the test track is a flat 55 m long moving steel beam with wheels (Figures 25 and 26).The maximum speed is at present about 10 m/s. Maximum wheel load is 100 kN and lateral and longitudinal forces up to 70 kN can
be measured. The side slip angle can be varied up to 900 at up to 300/3. Ice temperatures
down to 200C are possible. The facility became operational in May 1989 and has been successfully used for obtaining truck tyre characteristics on ice and on steel surfaces. The
measurements have comprised pure braking and side force characteristics as well as combined braking and steering characteristics (Figure 27). The results coincide very well
with what has been found in vehicle tests and test results from road going tyre test
(? ?/ ., ..., /f x. vzy äfå /rz Z/i é/z f/A . ;v w; /// / ./ än ;% GS O. båo å$ 8B bM os. :: > mm $su m hm $$ $? NGE »& er wa 85 25 3? me 35 33 35 båg e. ww: 25 33 54
Figure 27 Truck tyre test result for combined braking and steering (Nordström, 1991).
Friction coef cients
Y Px 0,8 0,4 Py Px 0.8 0.4
q
Sides/ip (mg/c 4.50. n'lu- c'l load 40 AN. Truck lyre 3/5/80 RZZ.5.
La §_'~ \-u. -\~ \\ \ _ \ \ \ . r | '"_"'1' """" time 0 1 2 3 4 [S] __... Py = Lateral friction pg.. ""* ssx N * - s* _____ I T l T~- ---r slip 0 20 40 60 80 100 [%]
7 Truck driving simulator
In 1984 a large moving base driving simulator with a passenger car cabin developed entirely by a VTI team, Nordmark (1990) became operational and has since then been successfully used in human factors research as well as for evaluating vehicle simulation models and car handling characteristics. In 1991 a second generation moving base driving
simulator with a complete truck cabin also developed by the same VTI team and ordered by the Swedish insurance company Trygg Hansa was completed and taken into operation
at the demonstration and test facility Protectum near Stockholm Alanda airport, owned by
Trygg Hansa.
The moving base of the driving simulator in Figure 28 is powered by servohydraulic actuators.
Figure 28 The TRYGG HANSA truck driving simulator built by VTI (TRYGG HANSA Promotion folder).
It has a large lateral motion of about +/ 3.5 m and in addition lateral tilt motion for simulation of steady state lateral acceleration. The simulation of longitudinal acceleration is also achieved by a combination of linear and tilt motion. In this case the linear motion is however quite short. The roll and pitch motion of the cabin relative to the computer simulated visual world as well as road and engine induced vibrations is achieved by means of separate hydraulic actuators. The visual system consists of three colour video projectors covering at 1200 wide angle screen of the dimensions of approximately 1.3 x
5m. The cabin is fully instrumented and equipped with an advanced audiosystem and a real air operated brake and clutch system. Single trucks as well as truck semitrailer and
truck full trailer combinations can be simulated under different road and traffic
conditions. Professional truck drivers have found the simulator very realistic. The simulator has been described more in detail by Nordmark (1992).
It is already being used for special education of truck drivers in matters like
overturning risk and braking behaviour on slippery surfaces.
As a future development the simulation of vehicle behaviour at antilock braking and
acceleration with antispin regulating devices using real system hardware is envisaged. 8 Conclusions
The dynamics of heavy duty vehicles and especially heavy duty vehicle combinations has since a long time been regarded as an important area of research by VTI and will probably remain so for a long time.
The main investigations areas have been:
' yaw stability and steerability at constant speed, ' overturning stability with rigid and liquid load,
' stability, steerability and braking efficiency during emergency braking,
' tyre road friction force transmission characteristics,
' simulation of vehicle dynamics especially in real time in connection with the
development of an advanced moving base truck driving simulator.
The behaviour of heavy vehicle combinations under severe winter conditions has a
high priority due to the climatic conditions in Sweden.
Road and computer simulation test methods and performance requirements have been
investigated and proposed for legislation use with the aim to promote safe vehicles on our roads.
9 Literature
ECE (1987) Regulation 13, Annex 13, Addendum 12: to be annexed to the Agreement Revision 2- Amendment 3. Supplement 1 to the 05 Series of Amendments which entered into force on 1 April 1987.
EEC Directive EEC/324 Rev 1/Add 12/Rev 2/Amendment 3.
Delisle, G. and Pearson, JR. (1986) Investigating articulated vehicle roll stability using a tilt
table ; Vehicle Weights and Dimensions Study, Technical Report, Volume 7, Ottawa, Canada.
Roads and Transportation Association of Canada.
Ervin, RD. and Guy, Y. (1986) The influence of weights and dimensions on the stability and
control of heavy trucks in Canada , Vehicle Weights and Dimensions Study, Technical Report Volume 1, Ottawa, Canada. Roads and Transportation Association of Canada.
Fancher, P. and Mathew, A. (1990) FHWA-RD-89-018. Safety Implications of Various Truck Con gurations. Volume ]: Technical Report, Washington DC, USA. US Department of Transportation, Federal Highway Administration.
Hales, F.D. (1975) The rigid body dynamics of road vehicle trains , Proceedings of IUTAM
Symposium on The Dynamics of Vehicles on Roads and Tracks, Delft, August 1975, Lisse,
Holland, Swets & Zeitlinger, p. 131.
Lidström, M. (1977) VTI Report No 115. Road Tanker Overturning - With and Without
Longitudinal Ba les, Linköping, Sweden, VTI (in Swedish, summary and list of figures in English).
Lidström, M. and Strandberg, L. (1978) Influence from liquid load motion on the lateral stability
of road vehicles , Proceedings of XVII FISITA Congress in Budapest 1978, Volume III, Budapest, Hungary, OMKDK TECHNOINFORM, PP. 1727 1735.
Mallikarjunarao, C. and Fancher, P.S. (1978) SAE Paper No 781064, Analysis of the Directional Response Characteristics of Double Tankers, Warrendale, USA, SAE.
Nordmark, S. (1976) VTI Report No 96. Computer Program for Digital, Simulation of a Double
Lane Change Manoeuvre with a Heavy Vehicle Combination, Linköping, Sweden, VTI (in Swedish, summary and list of figures in English).
Nordmark, S. and Nordström, O. (1977) Lateral dynamics of truck and full trailer combinations ,
Proceedings of OECD symposium on Heavy Freight Vehicles and their effects, November,
1977, Paris, France, OECD.
Nordmark, S. and Nordström, O. (1978) Lane change dynamics versus geometric design of truck and full trailer combinations a computer study , Proceedings of XVII FISITA Congress in Budapest 1978, Volume III, Budapest, OMKDK TECHNOINFORM, PP. 1737 1747.
Nordmark, S. (1990) The VTI driving simulator: trends and experiences , VTI Report 362A,
Proceedings of ROAD SAFETY AND TRAFFIC ENVIRONMENT IN EUROPE in
Gothenburg, Sweden, September 26 28, 1990, Linköping, Sweden, VTI pp.125 137.
and training,, Proceedings of the International Symposium on advanced vehicle control 1992, AVEC 92 in Yokohama, Tokyo, Japan, JSAE, pp. 475 480.
Nordström, O., Magnusson, G. and Strandberg, L. (1972) VTI Report No 9, Part 1 and 2. The Dynamic Stability of Heavy Vehicle Combinations, Linköping, Sweden, VTI (in Swedish). Nordström, O. and Strandberg, L. (1974) VTI Report No 67A. The Dynamic Stability of Heavy
Vehicle Combinations, Linköping, Sweden, VTI.
Nordström, 0. and Nordmark, S. (1978) Test procedures for the evaluation of the lateral dynamics
of commercial vehicle combinations , Automobile Industrie, No. 2, Wurzburg, FRG, Vogel
Verlag, pp. 63 69.
Nordström, O. and Nordmark, S. (1981) VTI Report No 234. Handling Characteristics of Heavy Vehicle Combinations at Constant Speed, Final Report, Linköping, Sweden, VTI (in Swedish). Nordström, O. (1983) VTI Report 257. Antilock systems for heavy vehicles State of the art, test
methods and regulations, Linköping, Sweden, VTI (in Swedish, extensive summary in
English).
Nordström, O. and Ståhl, P. (1984) STU Report, Field Testing of Double Combinations Under Winter Conditions, Linköping, Sweden, VTI (in Swedish).
Nordström, O. (1986) VTI Report 304. Testing of antilock systems. Winter tests 1985 for evaluation of draft revision of ECE Reg. 13 Annex 13, Linköping, Sweden, VTI (extensive summary in English).
Nordström, O. (1987) Antilock system performance under winter conditions what should be required? Proceedings of the 11th International Technical Conference on Experimental Safety Vehicle in Washington DC May 12 15 1987, Washington, USA. US DOT NHTSA.
Nordström, O. (1988a) Antilock braking system performance: international regulations now and in the future some Swedish viewpoints , VTI Report. Proceedings of TRB VTI Conference
Road Safety on Two Continents Gothenburg 1987, Linköping, Sweden, VTI.
Nordström, O. (1988b) VTI Notat TF 50 16. Test Methods and Requirements for ABS on Heavy Duty Trailers suited for Nordic Winter Conditions, Linköping, Sweden, VTI (in Swedish). Nordström, O. (1989a) Heavy duty vehicle dynamics related to braking, steering and tyres
Swedish research and proposals by VTI , SAE Technical Paper Series, SP 801 Vehicle
Dynamics Related to Braking and Steering (Truck and Bus Meeting and Exposition, Charlotte, North Carolina, November 6 9, 1989) Paper 892502, Warrendale USA, SAE, pp. 43 57. Nordström, O. (1989b) Tyre testing facility at VTI , VTI Annual Report 1988/1989, Linköping,
Sweden, VTI, pp. 20 21.
Nordström, O. (1991) Testing tyre performance in the VTI stationary tyre test facility , VTI Annual Report 1990/1991, Linköping, Sweden, VTI, pp. 20 22.
Oppenheimer, P. (1985) The development of international antilock braking regulations , I. Mech.
E. Conference on Anti-lock Braking Systems for Road Vehicles , I Mech. E Conference Publications 1985 8 Paper C190/85, London, UK, Mech. Eng. Publ. Ltd.
Palmkvist, G. and Nordström, O. (1983) Hybrid laboratory test method for antilock systems ,
Proceedings of 8th IAVSD-Symposium on the Dynamics of Vehicles on Roads and Railway Tracks Mass USA 1983, Lisse, Holland, Swets & Zeitlinger.
Palmkvist, G. (1989) Parallel processor system for real time simulation , Automotive Simulation,
Proceedings of the 2nd European Cars/Trucks Simulation Symposium, Schliersee, FRG, May 1989, Berlin, FRG, Springer Verlag, pp. 23 33.
Pflug, H. Chr. (1983) Dissertation Universität Hannover, Rechnerische Untersuchung des Pendelschwingverhaltens dreigliedriger Lastziige, Hannover, Germany, Universität Hannover. Sharp, R.S. (1979) The steering response of doubles , Proceedings of 6th IAVSD-Symposium on
the Dynamics of Vehicles on Roads and Railway Tracks held at the Technical University
Berlin Sept. 3 7 1979, Lisse, Holland, Swets & Zeitlinger, pp. 469 484.
Strandberg, L., Nordström, 0. and Nordmark, S. (1975) VTI Report No 82A. Safety Problems in Commercial Vehicle Handling, Linköping, Sweden, VTI.
Strandberg, L. (1977) VTI Report No 138A. Lateral Stability of Road Tankers. Volume I Main
Report and Volume II Appendices, Linköping, Sweden, VTI.
Strandberg, L. (1989) Braking characteristics of 400 heavy trailer combinations from Denmark, Finland, Norway and Sweden , 12th International Technical Conference on Experimental
Safety Vehicles, May 29 June 1 Gothenburg, Sweden, 1989, Washington. USA, US DOT
NHTSA, PP. 139 159.
Sweatman, P. and Mai, L. (1984) Articulated vehicle stability: the role of vehicle design . XX FISITA Congress in Vienna 6 11 May 1984, The Automotive Future, SAE P 143, Paper No
845055, Warrendale, USA, SAE.
Sweatman, P. (1988) Truck size and weight issues influencing truck design , XXII FISITA Congress, Technical Papers. Sept. 25 30, 1988, Automotive Systems Technology: The Future, SAE P 21 1, Paper No 885143, Warrendale, USA, SAE.
international forum in the field of on/off road heavy vehicle systems, including commercial trucks and vehicle combinations, conventional and hybrid buses, heavy military vehicles, integrated heavy vehicle systems, agricultural and construction equipment, and components. Heavy Vehicle Systems is a highly professional and refereed journal which forms part of the proceedings of the International Association for Vehicle Design. IAVD is an independent, non-profit, learned society which provides a forum for professionals in both industry and academic institutions to meet, exchange ideas and disseminate knowledge in the field of automotive engineering, technology, and management.
Objective
The objective of Heavy Vehicle Systems is to promote the science and practice of heavy vehicle system design and safety. The aim of the Journal is to provide a forum for engineers and applied scientists engaged in on/off road heavy vehicle design and research to disseminate and exchange technical information.
Readership
The Journal and the Association's activities are
of special interest to:
' Heavy vehicle and components engineers, designers, technologists and managers ' On/off road heavy vehicle and components
manufacturers
' Product and market development planners ' Research engineers and scientists
' Educators in engineering, technology, science and management
' Policy makers for commercial vehicle technology, heavy vehicle and components engineering
' Heavy vehicle service engineers ' Transport engineers and managers ' Regulators in government agencies ' Research students
Subject coverage:
Coverage includes heavy vehicle systems, modelling and simulation, field and laboratory testing, stability and control, roll dynamics, performance standards, hill climbing capability, man/vehicle interaction (ergonomics), roadway design and vehicle offtracking performance,
descents, engine design and control, vehicle induced noise and vibration, fuel consumption and emission control, suspension control systems, vehicle-road and vehicle-bridge interaction dynamics, ride quality, collision avoidance, truck/car collision, occupant crash protection, computer-based design methods for on/off road heavy commercial and military
vehicles and components, neural networks and
fuzzy logic applications to transportation systems and vehicle control, autonomous vehicle systems and intelligent highway/off
road vehicle systems, with emphasis on
technological, economic, safety, and environmental issues.
Type of contribution
Research papers, technical papers, com-mentaries on published papers, vehicle and component manufacturers' information, review papers, technical notes, book reviews, conference and meetings reports, abstracts, news items, and letters to editor.
Submission of papers
Papers should be sent either to the Executive Editor:
Dr M. El-Gindy,
Centre for Surface Transportation Technology, National Research Council of Canada, U-89 Alert Road, Uplands, Ottawa, Canada K1A OR6,
or to the Editor-in-Chief:
Dr M.A. Dorgham,
17 Beeward Close, The Leys, Wolverton Mill, Milton Keynes, Buckinghamshire, MK12 6L],
United Kingdom.
Neither the Editor nor the publisher can accept any responsibility for opinions expressed in Heavy Vehicle Systems or any of its publications.
Subscriptions
Heavy Vehicle Systems is published quarterly in English (four issues per volume). Subscription orders should be addressed to the publishers:
Inderscience Enterprises Ltd. World Trade Centre Building
110 Avenue Lousis Casai, Case Postale 306 CH 1215 Geneva Aeroport, Switzerland. [Fax: 41-22 791-0885]