Effects of iron oxidation on the adsorption of
trace elements in systems with low pH and
high iron concentrations
Final Report
Karsten Håkansson, Department of Water and
Environmental Studies,Linköping University and
Swedish Geotechnical Institute
Linköping, Sweden
October 1999
AFR-REPORT 259 AFN, Naturvårdsverket
Swedish Environmental Protection Agency 106 48 Stockholm, Sweden
ISSN 1102-6944 ISRN AFR-R--259—SE Stockholm 1999
CONTENT
1. INTRODUCTION
1
2. METHODS
2
2.1 Field studies
2
2.2 Solid phase studies
3
2.2.1 Humidity cells 3
2.2.2 Leaching with reducing agent 3
2.3 Pilot scale test
4
2.4 Adsorption studies
4
2.5 Storage studies
6
3. RESULTS AND DISCUSSION
6
3.1 Hydrochemical monitoring
6
3.2 Solid phase studies
9
3.3 Pilot scale test
10
3.4 Adsorption studies
12
3.5 Storage studies
15
4. CONCLUSIONS
16
1. INTRODUCTION
Metals in surface waters can cause substantial and detrimental effects on plants and on animals. Since metal releases emanating from production and industrial activities have been recognised and partly dealt with, metals from other sources have become increasingly more important. Among the most important sources for metals entering the environment are mine waste (50 % of all the waste produced in Sweden originates from mining activities). The residues from old mining sometimes consist of coarse residues, due to the extraction methods used, and this will increase the penetration of oxygen and water into the tailings, leading to an increase in the rate of oxidation and thus the release of metals to the surroundings.
In order to prevent the release of acidic metal-rich leachates from mining areas, tests with different types of cover of the wastes have been carried out in Canada, Australia and Sweden. In Rum Jungle, Australia a covering project was performed 1982 to 1986. The effects of this cover were monitored. The concept of the cover as a barrier for percolating water worked as expected. Ryan and Joyce (1991), noted however, that no significant trends in metal
concentrations in the receiving surface water were detected. In Mount Washington, Canada, covering of sulphidic mine waste took place during 1988 and 1989. Changes in the surface water quality caused by the cover has not been confirmed (Galbraith, 1991). From the same site Kwong, (1991) reports of increased amounts of Fe(II) in the groundwater outlet from the mine waste heaps.
In Bersbo, Östergötland, a full scale covering experiment was carried out from 1987 to 1989. Acceptable or good results have been achieved with respect to the barrier function (oxygen and water) of the cover (Lundgren and Lindahl, 1991). Changes in the hydrochemistry of the outflowing water have occurred as a result of the cover. The most obvious difference is the dramatic increase in iron concentrations from one of the two drainages (Storgruve deposit). Fe(II) is the dominating iron species in the effluent water (Karlsson et al., 1993). The Fe(II) released into the surface waters will oxidise from Fe(II) to Fe(III) that will form sparingly soluble (oxy)hydroxides. This oxidation of Fe(II) and the subsequent precipitation of
(oxy)hydroxides takes place in a lake receiving water from three small inlets. The dominating part of the metal load to the lake emanates from the mining area and is a mixture of mine water and leachates from the covered deposit.
The solubility of metals are a function of the hydrochemistry of the soluble phase. Ionic stregth, pH, content of soluble humic and fulvic acids are important parameters that affects the
solubility. Speciation and thus mobility of metals will also depend on physical or chemical characteristics of the solid phase. Adsorption may occur onto suspended particles, and depending on the size of these particles mobility may either increase (colloids) or decrease (sedimentation). The capacity as well as the rate of which adsorption takes place will also be dependent not only on the type of the adsorbing material at the existing hydrochemical conditions but also on the age of the adsorbing material.
Hydroxides or oxyhydroxides of iron are known to be excellent adsorbents for trace metals e.g. cadmium, copper, lead and zinc (Singh och Subramanian, 1984; Tessier et al., 1985;
Johnson, 1986). Several adsorption studies of trace elements have been described in the literature. Most of the studies, however, have been performed with synthetic solutions of metals, and crystalline material as adsorbents. The effects of an iron phase consisting of freshly formed precipitates on the distribution of trace elements is less known, but of importance in environments where an iron-rich groundwater is exposed to the atmosphere. The pH at which the solids are formed could (together with other factors like organic content, ionic strength) affect the rate of oxidation and precipitation, the character of the formed surfaces and thereby the adsorption of trace elements present in the water phase.
The oxidation and precipitation of iron will on the other hand cause a net production of protons and thereby an acidification of the effluent water. In some systems the precipitation of iron could even be the dominating process that sets the pH. It is also known that a lowering of pH decreases the efficiency in trace element adsorption onto the solid iron(oxy)hydroxides (Tessier et al., 1989; Karlsson et al., 1987).
Two factors with opposite effects on the mobility of trace elements are thus identified; on one hand acidification, which in general decreases adsorption to solid surfaces, and on the other hand production of solid forms of iron that often are excellent adsorbents. Both factors are expected to exist in water systems where releases of soluble iron takes place.
The present report describes the effects of the cover in Bersbo on trace metal retention, especially with focus on the effects of increased iron concentrations in the receiving surface water (lake Gruvsjön). The capacity for trace metal retention of a
precipitating iron phase as a function of pH, organic content and temperature are studied. Through a combination of field and laboratory data the distribution between aqueous and solid metal forms is evaluated. The distribution will have effects on the regional distribution of metals.
2. METHODS
2.1 Field studies
The field site Bersbo is situated in the municipality of Åtvidaberg, Sweden, where effective mining for copper took place during a period of 150 years. The main constituent of the ore was pyrite. Since mineral dressing was done manually a coarse waste open for penetration of oxygen and water was produced. Information about geology and mined ores are given in Tegengren (1924). General information of the area and its hydrochemistry are found in Allard et al., (1987).
In order to minimise the amount of covering material several small scattered heaps of mining residues were put together into two major piles. Mining residues were also dumped into the abandoned mine shafts, in order to somewhat decrease the amount of material that needed to be covered. Unexpectedly, a great part, about 1/3 of the total amount of material was contained in the old shafts.
On the eastern pile a dense layer of stabilised coal fly ash covered by 2 m of till was put on the waste material. Description of the covering procedure can be found in Lundgren 1990. Early
follow up of the performance with regard to the cover is described by Lundgren and Lindahl, (1991) and with respect to the hydrochemistry of the leachate by Håkansson, (1991) and Håkansson et al.,(1994).
The leachate from the westward drainage and its effects on the hydrochemistry of the receiving lake (see table 2) are discussed in this report. The sampling point “Outlet” (table 2) refers to a sampling point located at the outlet of the first lake (lake Gruvsjön) and represents
concentrations in the lake. The sampling point “Inlet” is situated in a small creek about 200 m downstream of the tailings and the mine and includes water from the mine as well as leachates from the waste and water diverted to ditches during remedial actions. A small increase in evaporation caused by the preservation of moisture in the surficial layers of the cover is expected but transpiration from vegetation and transport of moisture by vegetation is low as long as the vegetation is scarce and the plants are small. This means that although the cover has caused the water to take new paths and less water produces a leachate, the overall effect of water volumes coming from the mine and the tailings are assumed to be similar as
previously.
2.2 Solid phase studies
Samples of mine waste from the Bersbo site (Storgruvan) was collected and the samples were carefully examined in order to confirm that only residual material from the mining operations were obtained. Depending on a visual inspection on the degree of weathering the waste was divided into two fractions less weathered (LW) and more weathered (MW) The mine waste was sent to a mining company (Boliden) for grinding.
2.2.1 Humidity cells
Different designs have been proposed to test the potential of sulphidic mine waste to form acid rock drainage. Humidity cells where the waste is exposed to moisture and oxygen in different cycles are widely accepted as a practical way to test this potential. However, the number of cycles, suitable time required for each cycle and surface area exposed to oxidation and leaching are a matter of discussion. In the present case an experimental setup proposed by Corporacion minera de Bolivia (1995) was used, but for practical reasons the number of cycles were limited to two. Humidity cells were constructed according to Lundgren (pers. comm. 1995). The grounded waste material was sieved and 250 g of the fraction between 1 and 2 mm was used for the tests. The material was mixed with glass beads, 3 mm in diameter, put in the cells, then exposed to dry air for 72 h (ambient humidity in the laboratory), exposed to humid air (air passing a water filled chamber) for another 72 h. The sample was put in distilled water for 1 h and allowed to drain for 10 min, then again put in freshly distilled water for 15 min, allowed to drain for 10 min and put back in the cell for a new cycle. The rinsing water about 3 l per cycle (giving a total L/S ratio of 24 ) and the water was saved for analysis of Fe, Cd, Cu, Zn and pH.
2.2.2 Leaching with reducing agent
A reducing agent is required in order to solubilise the metal species that are associated with the oxidised parts of the waste (predominantly (oxy)hydroxides of iron). The use of
procedures (Tessier et al., 1979; Kersten and Förstner, 1986) in order to dissolve amorphous oxides and hydroxides of Al, Fe and Mn. In a study examining the reductive dissolution of weathered mine tailings, Ribet et al. (1995) proposes the use of a 2M solution during 24 h for the extraction of reducible iron with a liquid solid ratio (L/S) of about 30. However, the information from Ribet et al. was not available during the time of the experiments and instead, in the present work, a leaching solution of 0.1 M was used. Five cycles were performed giving a total L/S of 100 and a total leaching time of 288 h. Analysis of Fe, Cu and Zn was done on the leachates.
2.3 Pilot scale test
Initial tests were undertaken in order to examine the water quality of leachates with or without contact with oxygen from the air. The same material as described above was used for the tests. Two barrels of PVC containing 360 l were used for the tests. One of the barrels was open to the atmosphere, and the other was covered with a tight lid with a vent equipped with a water lock. A perforated disk was placed close to the bottom of the barrels (0.1 m). A filter cloth was placed on the disk and 285 kg of mine waste was put on the filter. The barrels were filled with tap water (in the "anaerobic" barrel oxygen was removed by purging with nitrogen). In order to cover the mine waste 143 l of tap water was sufficient. During the tests two pumps circulated the water and N2 was continuously bubbled in the closed barrel. Oxygen was sampled and analysed on the air above the leaching water, and in the water phase, oxygen and pH was measured and samples for metal analysis (Fe and Zn) were taken.
2.4 Adsorption studies
A well characterised leachate from Bersbo was used in the adsorption-precipitation
experiments, modified by additions of fulvic acid and pH-adjustment. Water was taken from the tailings at the Bersbo mine (Storgruvan) on different occasions. The water represented a mixture of mine water and leachates. Concentrations of Fe, Cd, Cu and Zn and pH were determined on the samples. The experiments were performed as titrations at constant pH (pH-stat between pH 4 and pH 5.4). This was considered to be the pH-interval in the receiving lake (see table 2). Prior to further treatment to some of the samples were added Cu or fulvic acid (Table 1). To achieve phase separation (removing precipitates during storage) samples were centrifuged at 20 000 g at 5 oC for 15 min in an ultracentrifuge (Beckman J2-21M). Analysis with PCS (Photon Correlation Spectroscopy) on lake water samples confirm that this procedure is equal to the removal of particles by filtration through a filter with a nominal diameter of 0.40µm (Ledin, 1993). The low temperature was chosen in order to minimise the temperature dependent oxidation of iron during the centrifugation. The centrifuged sample was divided into two or three subsamples, one of them was acidified with HNO3 (Merck,
Suprapure 2 ml/l sample). For some experiments TOC was determined and one subsample was thus withdrawn and stored at 8 oC for later analysis. The rest of the sample was used for the titration which commenced immediately after centrifugation and was performed open to the atmosphere in vessels equipped with a magnetic stirrer. Titrations were performed at constant pH and temperatures ranging from 10 to 25 oC (Table 1) using a water cooling/heating system. pH-values were recorded and kept constant during the titration. The samples were weighed to check for differences due to evaporation before and after titrations. Titrations of
the samples were performed with Radiometer VIT 90. A combination electrode was used to record and monitor pH-values (GK 2402B). A Radiometer Sample Station, SAM 90 kept pH constant by the addition of 0.1 M NaOH at the same rate as the oxidation/precipitation rate. Recordings of the additions of NaOH with time would show the rate of the overall reaction.
Disturbances in the performance of the titrations occurred during some of the experiments. Precipitates of iron were formed at the tip of the byrette preventing the base to react with protons. The ceramic connection between the solution and the reference electrode showed signs of clogging and the electrode was thus cleaned twice a day. The additions of the base were stopped when about 50 % of the iron had precipitated in the first tests (A1 - A10). Some of the most time-consuming tests were, however stopped earlier. In the later tests (Fe2 -Fe13)the aim was to have a 25 % decrease of soluble Fe after the titrations. The
concentrations of soluble Fe before and after titration agreed very well with the formation of a solid (oxy)hydroxide of Fe(III) from a soluble Fe(II) specie.
After completion of the titrations, the sample was again centrifuged and decanted into plastic vessels. Subsamples for metal analysis and TOC when applicable, was withdrawn. Cd, Fe, Cu and Zn were analysed with AAS on PerkinElmer 1100 with flame technique, on an air -acetylene flame. Analysis of Al (Table 5) was done with the similar technique but with nitrous oxide as oxidant.
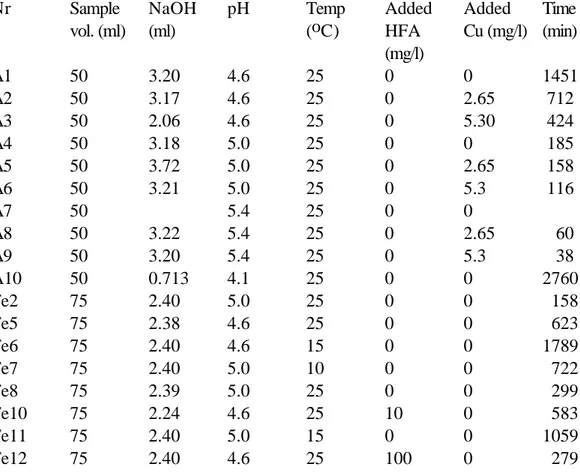
Table 1. Conditions for the laboratory adsorption studies.
Nr Sample vol. (ml) NaOH (ml) pH Temp (oC) Added HFA (mg/l) Added Cu (mg/l) Time (min) A1 50 3.20 4.6 25 0 0 1451 A2 50 3.17 4.6 25 0 2.65 712 A3 50 2.06 4.6 25 0 5.30 424 A4 50 3.18 5.0 25 0 0 185 A5 50 3.72 5.0 25 0 2.65 158 A6 50 3.21 5.0 25 0 5.3 116 A7 50 5.4 25 0 0 A8 50 3.22 5.4 25 0 2.65 60 A9 50 3.20 5.4 25 0 5.3 38 A10 50 0.713 4.1 25 0 0 2760 Fe2 75 2.40 5.0 25 0 0 158 Fe5 75 2.38 4.6 25 0 0 623 Fe6 75 2.40 4.6 15 0 0 1789 Fe7 75 2.40 5.0 10 0 0 722 Fe8 75 2.39 5.0 25 0 0 299 Fe10 75 2.24 4.6 25 10 0 583 Fe11 75 2.40 5.0 15 0 0 1059 Fe12 75 2.40 4.6 25 100 0 279
Fe13 75 2.40 4.6 25 100 0 90
2.5 Storage studies
Samples from the hydrochemical monitoring program were filtered, analysed and then stored at 8 oC. After several months of storage under air the samples were taken out and again filtered and analysed with respect to Fe, Cu, pH and electrical conductivity. Samples were collected from the immediate outlet from the mine waste (D), from the inlet to the lake (I) and from the outlet of the lake (G). Analysis was done as in 2.4.
3. RESULTS AND DISCUSSION
3.1 Hydrochemical monitoring
A monitoring program has been going on for more than 10 years in the Bersbo area. The results for some key parameters regarding the hydrochemistry in the western drainage is presented in table 2 and in figures 1 and 2 below.
Table 2. Median values of some parameters at the mine drainage inlet to lake Gruvsjön and outlet of lake Gruvsjön in Bersbo (Cd µg/l, others mg/l). For each of the parameters n = 70 - 75 Location pH SO4 Fe Mn Cd Cu Zn Inlet before 3.95 514 6.7 3.35 198 10.6 81.6 Inlet after 3.73 1080 204 8.15 138 3.94 58.0 Outlet before 4.96 86 0.55 0.59 16 0.53 7.58 Outlet after 4.7 138 0.46 1.14 8.5 0.21 4.52
before = before remedial actions (85 -87) after = after remedial actions (89 -95).
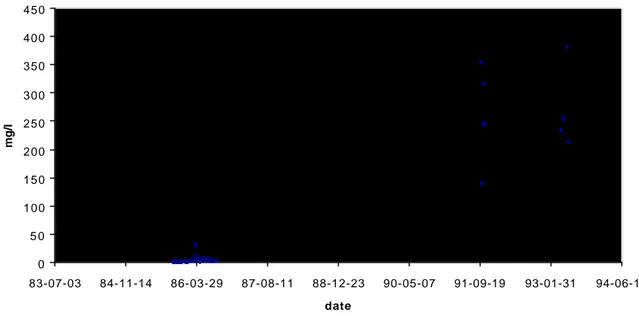
Iron 0 5 0 100 150 200 250 300 350 400 450 83-07-03 84-11-14 86-03-29 87-08-11 88-12-23 90-05-07 91-09-19 93-01-31 94-06-15 date mg/l
Figure 1a. Concentrations of iron as a function of time at the inlet of Lake Gruvsjön
Figure 1b. Concentrations of sulphate at the inlet to the lake Gruvsjön Sulphate 0 500 1000 1500 2000 2500 83-07-03 84-11-14 86-03-29 87-08-11 88-12-23 90-05-07 91-09-19 93-01-31 94-06-15 date mg/l
Figure 2a. Concentrations of iron as a function of time at the outlet of Lake Gruvsjön
Figure 2b. Concentrations of sulphate as a function of time at the outlet of Lake Gruvsjön Iron 0 0,5 1 1,5 2 2,5 3 3,5 4 4,5 5 84-08-06 85-12-19 87-05-03 88-09-14 90-01-27 91-06-11 92-10-23 94-03-07 95-07-20 96-12-01 date mg/l Sulphate 0 50 100 150 200 250 300 350 400 450 84-08-06 85-12-19 87-05-03 88-09-14 90-01-27 91-06-11 92-10-23 94-03-07 95-07-20 96-12-01 date mg/l
As can be seen in table 2, the concentrations of the heavy metals Cd, Cu, and Zn have decreased at the inlet after covering. At the outlet (representing concentrations in the lake) decreasing concentrations are also found. The change in pH and the high input of Fe to the lake may however have changed the conditions in the lake resulting in either a decrease or an increase in the ability of the lake to act as a sink for heavy metals. In order to calculate the effect of the lake, an estimation of the metal transport has to be done. The transport of metals out of the lake can be determined relatively accurate since recordings of the water flow are available. The effect of the cover on water flow can however not directly be seen since no recordings of the flow of water coming in to the lake are available. The contribution of flow at the outlet emanating from the inlet can however be made, using conservative parameters and assuming that the share of the flow from mine water plus leachates i.e. “Inlet” has not changed due to the remedial actions (Håkansson, 1991) and that the contribution from the surroundings are constant. Below is an example for potassium.
IKb*X +(1 - X)*YK = OKb (1)
IKa*X + (1 - X)*YK = OKa (2)
where
IKb,a refers to concentrations of K (potassium) at the inlet before and after remedial actions OKb,a refers to concentrations of K (potassium) at the outlet before and after remedial actions.
X is the share of the water originating from the inlet and passing through the lake. YK is the concentration of K in the water from the rest of the drainage area.
These estimations as above were made for Na, K, SO4, and Mn with median values. X (above) became for Na 0.235, for K 0.091, for SO4 0.092 and for Mn 0.115.
The high value for Na could be caused by a high leaching from surrounding areas due to ion-exchange with Ca. A substantial part of the area was treated with limestone. In several mining areas the precipitation of jurbanite is reported. It has not been found here though, but if it is the case this would result in that e.g. concentrations of potassium at the outlet after remedial actions (OKa) are low and thus the a higher proportion of water would originate from the mining waste area. Carignan and Nriagu (1985) reported that acidification could release Mn from sediments by diffusion. A lowered pH in the lake is observed (table 3) and may be one of the causes for the high outlet concentrations of Mn.
The contribution from the inlet sampling point is thus set to contribute with 0.1 of the water flow at the outlet or equivalent constitute 0.1 of the drainage area.
When we put this value in eq. 3
ICdb*0.1 + 0.9*YCd = OCdb (3)
and in eq 4
ICda*0.1 + 0.9*YCd = OCda (4)
we find a contradiction giving negative values of the concentrations from the surroundings (YCd) The explanation is that Cd is not conservative and that the lake acts as a sink for Cd both after and before covering. Even if we do not know the concentrations (or average
concentration) of Cd from the other sources contributing to the outlet concentration, we can see that differences are higher after covering.
Before covering the retention in the lake is higher than 3.8 µg per L of outlet water (0.1*198 + 0.9*YCd = 16), while after covering the retention is higher than 5.3 µg per L of outlet water (0.1*138 + 0.9*YCd = 8.5). This means that the lake probably retains Cd more efficiently after covering than before. The same reasoning is applicable to Zn and Cu and by the same arguments Zn is also found to be more efficiently retained in the lake, and while the lake still act as a sink for Cu, this metal is less efficiently retained after the remedial actions.
3.2 Solid phase studies
The leachates from the humidity cells gave a pH of between 3 and 4 for both materials. No clear trends were found, possibly due to the low number of cycles (2) that was not sufficient for a substantial weathering.
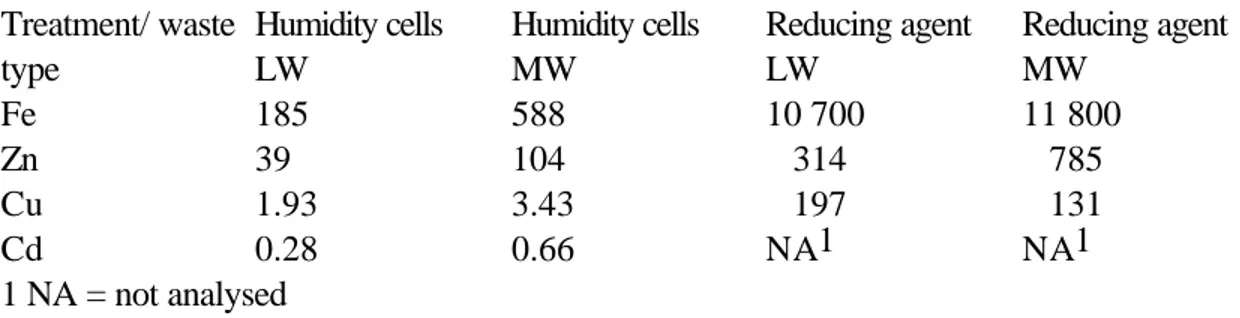
The total leached amounts for both the humidity cells and reducing tests are presented in table 3 below.
Table 3. Leached amounts from humidity cells and reducing tests on different types of weathered mine waste (mg/kg of total weight).
Treatment/ waste type Humidity cells LW Humidity cells MW Reducing agent LW Reducing agent MW Fe 185 588 10 700 11 800 Zn 39 104 314 785 Cu 1.93 3.43 197 131 Cd 0.28 0.66 NA1 NA1 1 NA = not analysed
The reducing tests were performed with a high L/S ( totally 100) with 5 cycles, while oxidation tests were done at a total L/S of 24. In order to facilitate comparisons between the relative amounts of heavy metals leached from the different tests a normalisation with respect to Fe was done and is presented in table 4 below. Since the leachate from the humidity cells were conducted at a relatively low pH, secondary hydroxide precipitates was not expected. No signs of hydroxides were observed neither on the material nor on the vessels.
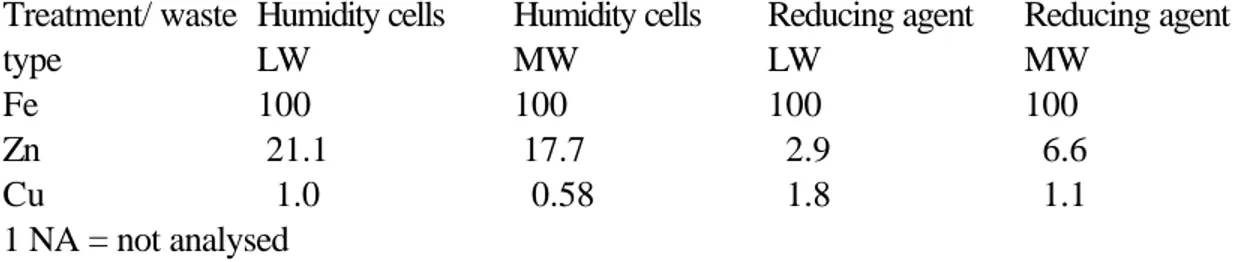
Table 4. Leached amounts from humidity cells and reducing tests normalised with respect to Fe on different types of weathered mine waste.
Treatment/ waste type Humidity cells LW Humidity cells MW Reducing agent LW Reducing agent MW Fe 100 100 100 100 Zn 21.1 17.7 2.9 6.6 Cu 1.0 0.58 1.8 1.1 1 NA = not analysed
It can be seen from the table that the material dissolved by the reducing agent have
comparatively low concentrations of Zn. This is an indication that the hydroxides of Fe that will be dissolved by the reducing agent contain less Cu and Zn than what is contained in the pyrite. Since the tests with the humidity cells were conducted during a relatively short period, the proportion between the metals Zn and Cu may be different in a situation with a high weathering rate and possibly more extreme pH-values. A mechanism where pyrite is oxidised by Fe(III) instead of O2 which is indicated in the reducing tests above is more corresponding to the situation after remedial actions than before (Table 2).
The oxidation of pyrite by Fe(III) can be described by:
FeS2(s) + 14Fe3+ + 8H2O = 15 Fe2+ + 2SO42- + 16 H (5) where Fe3+ comes from the dissolution of (oxy)hydroxides
3.3 Pilot scale test
The results presented here refers to the initial phase when the experiment was set up and does not represent long-time performance of a (water)-covered mine waste.
Oxygen concentrations in the air were low for the anaerobic system during the whole
experiment (0.45 %). It seems however that the duration of the experiment was not sufficient to lower the oxygen content in the water below 1 mg/l (see figure 3). It is also possible that concentration in the water are kept high by diffusion of oxygen that can take place through the walls of the vessel. pH in the leachate water showed the same development in both the studied systems (from pH 5 to pH 3). Oxygen in barrels 0 5 10 15 0 10 20 30 40 50 time (h) mg/l Aerobic Anaerobic
Figure 3. Concentrations of oxygen in two differently treated barrels for pilot scale testing of mine waste leaching
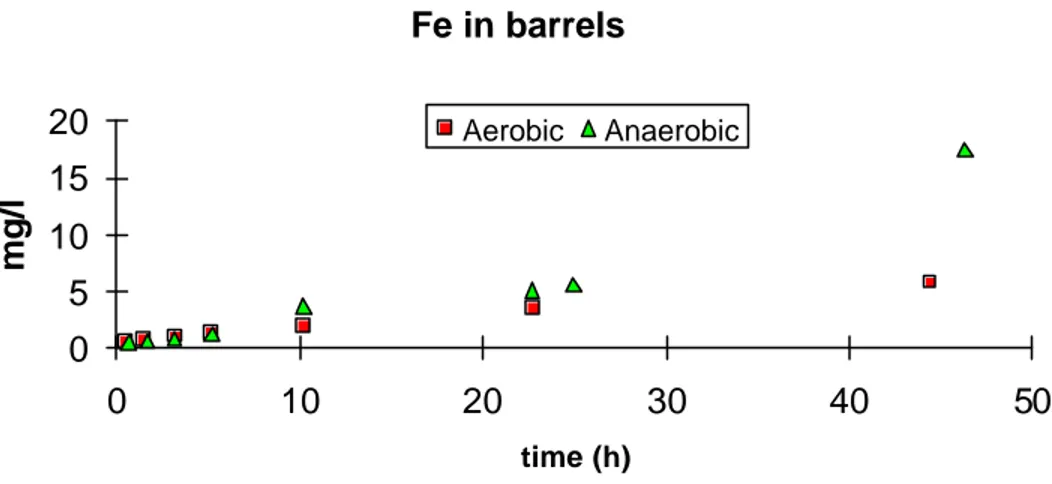
Fe in barrels 0 5 10 15 20 0 10 20 30 40 50 time (h) mg/l Aerobic Anaerobic
Figure 4. Concentrations of iron in two differently treated barrels for pilot scale
testing of mine waste leaching.
Figure 5. Concentrations of zinc in two differently treated barrels for pilot scale testing of mine waste leaching.
In figure 4 the build up of Fe concentrations are presented. The concentrations of Fe is increasing in the "anaerobic" system. This is in accordance with the changes in the hydrochemistry of the leachate at the field site after application of the cover.
Zn concentrations are similar in the two systems, with somewhat higher values for the "anaerobic" system. After two years of storage without mixing and with oxygen presethe initially aerobic barrel had a zinc concentration of 80 mg/l while the initially anerobic barrel had a zinc concentration of 58 mg/l.
3.4 Adsorption studies
The concentrations of metals before and after titration at constant pH for the mine and leachate water are presented in table 5. In figures 6 - 8 the amount of metal that adsorbs/coprecipitates is related to the amount of precipitated iron.
Table 5. Concentrations of metals in the soluble phase before and after titrations.
Fe (mg/l) Cd µg/l) Cu (mg/l) Zn (mg/l) Al (mg/l) Zn in barrels 0 5 10 15 20 25 0 1 0 2 0 3 0 4 0 5 0 t i m e ( h ) mg/l A e r o b i c A n a e r o b i c
Nr before after before after before after before after before after A1 380.8 212.1 122 118 1.66 1.055 62.01 50.20 NA NA A2 380.8 169.7 122 110 4.308 3.82 62.01 51.51 NA NA A3 380.8 182.8 122 110 6.956 6.680 62.01 49.19 NA NA A4 375.7 195.9 123 118 1.67 0.645 61.61 52.16 NA NA A5 375.7 144.4 123 111 4.318 2.595 61.61 52.02 NA NA A6 375.7 179.8 123 112 6.966 4.235 61.61 53.93 NA NA A7 330.3 152.5 116 110 1.190 0.285 57.47 51.74 NA NA A8 330.3 144.4 116 110 3.838 1.340 57.47 51.51 NA NA A9 330.3 148.5 116 109 6.486 5.010 57.47 52.72 NA NA A10 188.9 157.6 327 320 11.14 9.95 124.5 115.1 NA NA Fe2 300 219.2 327 297 4.9 2.8 138 104.6 3.5 1.2 Fe5 275.7 244.4 333 309 7.2 5.1 135.6 129.3 23.2 8.9 Fe6 301 232.3 327 299 6.9 4.8 144.2 125.4 20.9 10.9 Fe7 285.8 210.1 330 280 5.8 3.2 140.4 102.8 10.4 4.3 Fe8 281.8 178.8 322 302 5.6 2.7 141 121 6.7 1.6 Fe10 277.8 191.9 320 300 6.0 3.6 136.4 120.6 8.5 2.6 Fe11 284.8 204.2 328 281 6.1 3.3 145.6 104.6 8.7 4.1 Fe12 244.4 167.7 293 284 5.3 1.5 128 101.2 11.1 1.5 Fe13 293.4 184.3 296 278 5.7 2.7 129.9 114.1 15.7 2.6 (cont.) Nr before after Fe5 4.25 4.47 Fe6 4.65 4.65 Fe7 4.40 4.00 Fe8 3.92 3.72 Fe10 4.45 4.14 Fe11 3.79 9.96 Fe12 9.14 7.32 Fe13 10.5 6.65
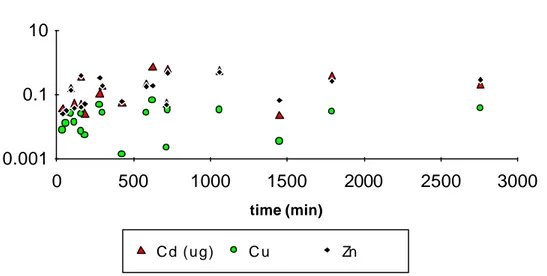
In figure 6 adsorption is presented as a function of time elapsed for the titrations. It can be seen that adsorption increases with time for up to some hundred minutes. All data have been
used for the plot.
Adsorption of Me as a function of time
time (min) 0.001 0.1 10 0 500 1000 1500 2000 2500 3000 Cd (ug) C u Zn
Figure 6. Adsorption of metals expressed as mg Me/mg of precipitated Fe (for Cd µg) expressed as a function of time (min) for titrations.
In figure 7 the relation between pH and time elapsed for the titrations are plotted (data where similar amounts of Fe is scavenged from the solution are used for the plot).
pH as a function of elapsed time
time (min) pH 4 4.2 4.4 4.6 4.8 5 5.2 5.4 0 500 1000 1500 2000 2500 3000
Figure 7. Time (min) required for completion of titrations compared to pH
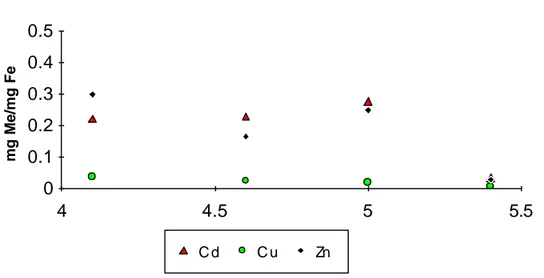
A correlation between the rate of reaction and pH is found which is in accordance with several studies e.g. Eary and Schramke, (1990); Stumm and Morgan (1991). In figure 8 average adsorption values at each pH are compared for Cd, Cu and Zn. Cu differs from the other metals in that no clear pH-dependence is found. While other metals are increasing their adsorption at low pH Cu has similar adsorption over the studied pH-interval. As noted above this unexpected pH-effect is not unambiguously an effect of pH itself but could rather be an
effect of the longer duration of the experiments performed with low pH, that apparently favours the adsorption of Cd and Zn.
Adsorption as a function of pH mg Me/mg Fe 0 0.1 0.2 0.3 0.4 0.5 4 4.5 5 5.5 C d C u Zn
Figure 8. Adsorption of metals (average value at each pH) expressed as mg Me/mg of precipitated Fe (for Cd µg) expressed as a function of pH for titrations.
In figure 9 the average adsorption values are plotted against the temperature. Also for temperature does Cu differ from the other metals with constant adsorption at the studied temperatures, while Cd and Zn have an increased adsorption at low temperature. This could again be an effect of the longer duration of the low temperature experiments giving longer contact times and the opportunity for an efficient adsorption of Cd and Zn.
Adsorption of Me as a function of temperature
temperature oC mg Me/mg Fe 0 0.2 0.4 0.6 0.8 5 10 15 20 25 Cd (ug) C u Zn
Figure 9. Adsorption of metals (average value at each pH) expressed as mg Me/mg of precipitated Fe (for Cd µg) expressed as a function of temperature for titrations
3.5 Storage studies
Results from the storage of water samples are presented below (Table 6) This was done on samples taken for the hydrochemical monitoring programme. This was done to study the development of the hydrochemistry on the samples.
Table 6. Concentrations in samples from the hydrochemical monitoring program initially (i) and after storage (s)
Stor. time (d) pH (i) pH (s) El. cond. (i) El. cond. (s) Cu (i) Cu (s) Fe (i) Fe (s) D 1 206 4.6 2.77 2630 3150 3.71 3.49 378 276 D2 192 4.74 2.55 2650 3120 3.19 3.05 398 165 D3 183 4.75 3.09 2630 2840 3.09 2.92 399 307 D4 113 4.83 2.64 2650 2800 3.86 3.73 381 282 Inlet 1 206 3.49 2.53 1870 2550 4.51 4.17 182 37.7 Inlet 2 192 3.49 2.61 1960 2400 3.58 3.39 195 83.8 Inlet 3 183 3.69 2.68 1690 2070 3.11 2.9 162 62.6 Inlet 4 113 4.66 3.16 1213 1440 2.41 2.27 112 69.7 Outlet1 183 4.2 4.12 403 406 0.225 0.22 0.42 0.1 Outlet2 169 4.19 4.15 400 406 0.22 - 0.27 -Outlet4 113 4.57 4.57 356 187 0.189 0.198 0.47 0.1 D1-D4 are samples of mine and leachate water draining from the Storgruve deposit taken from four occasions.
During storage the pH of the samples decreases. This is most evident for the samples taken from location D and from samples taken from the inlet to the lake. These samples have high concentrations of iron and the pH drop is most likely an effect of the precipitation of Fe(III) after oxidation. The increase in electrical conductivity is an effect of the higher ionic
conductivity of hydrogen than of iron. (Hydrogen becomes an important constituent in the water when pH drops below 3). Adsorption of copper does take place on samples from D and the Inlet but to a small extent.
4. CONCLUSIONS
• The concentrations of the metals Cd, Cu and Zn into the lake and out of the lake have decreased after the remedial actions, and most likely also the transported amounts.
• The receiving lake acts as a sink for Cd, Cu and Zn, but Cu is less efficiently retained after covering actions.
• It is strongly indicated that the high input of Fe to the lake causes a further acidification of the lake.
• Laboratory studies show that the secondary oxidation of Fe causes a comparatively less retainement of Cu compared to Cd and Zn.
• Humidity cells and reducing leaching dissolution tests indicates that the formed hydroxides of iron on the waste is a less important source of trace elements than the ore itself.
• If (oxy)hydroxides of iron are formed at low pH then trace elements can still be present in the mobile water phase.
Swedish Geotechnical Institute
Department of Environmental Geotechnics
5. REFERENCES
Allard, B., Bergström, S., Brandt, M., Karlsson, S., Lohm, U., and Sandén, P. 1987. Environmental impact of an old mine tailings deposit - Hydrochemical and hydrological background. Nordic Hydrol. 18: 279 - 290. Carignan, R. and Nriagu, J.O. 1985. Trace metal deposition and mobility in the sediments of two lakes near Sudbury, Ontario. Geochim. Cosmochim. Acta 49: 1753 - 1764.
Corporacion minera de Bolivia. 1995. Environmental audit of the Huanuni mine. Swedish geological AB. Eary, L.E. and Schramke, J.A. 1990. Rates of inorganic oxidation reactions involving dissolved oxygen. In Chemical modelling of aqueous systems II Eds. Melchior and Bassett. ACS Symposium Series
Galbraith, D.M. 1991. The Mount Washington acid mine drainage reclamation project. In Proc. of the Second Int. Conf. on the Abatement of Acidic Drainage, Montreal, Vol 2: 145 - 161.
Håkansson, K. 1991. Metals released from mine waste deposits - Redistribution and fluxes through geological barriers. Diss. Linköping Studies in Arts and Science 62. Linköping University.
Håkansson, K., Karlsson, S. and Allard, B.1994. Effects of increased iron concentrations on the mobility of cadmium, copper and zinc in leachates after remedial actions at an old sulphidic mine waste site. In Proc. of the third International Conference on the abatement of Acidic Drainage, Pittsburgh, USA
Johnson, C. A. 1986. The regulation of trace element concentrations in river and estuarine waters contaminated with acid mine drainage: The adsorption of Cu and Zn on amorphous Fe oxyhydroxides. Geochim. Cosmochim. Acta, 50: 2433 - 2438.
Karlsson, S., Sandén, P. and Allard, B. 1987. Environmental impacts of an old mine tailings deposit - Metal adsorption by particulate matter. Nordic Hydrol. 18: 313 - 324.
Karlsson, S., Ledin, A., Allard, B., Düker, A. and Håkansson, K. 1993. Diurnal variations of suspended trace metals in a small lake receiving acidic mine effluents. In Proceedings of International Conference on Heavy Metals in the Environment. Toronto. Vol. 2: 321 - 324
Kersten, M. and Förstner U. 1986. Chemical fractionation of heavy metals in anoxic estuarine and coastal sediments. Wat. Sci. Tech. 18:121 - 130.
Kwong, Y.T.J. 1991. Acid generation in waste rock as exemplified by the Mount Washington minesite, British Columbia, Canada. In Proceedings of the Second International Conference on the Abatement of Acidic Drainage. Montreal. Vol. 1: 175 - 190
Ledin, A. 1993. Colloidal carrier substances - Properties and the impact on trace metal redistribution in natural waters. Diss. Linköping Studies in Arts and Science 91. Linköping University
Lundgren, T. 1995. personal communication. Humidity cell constructed by Guido Solis.
Lundgren, T. 1990. The first full scale project in Sweden to abate acid mine drainage from old mining activities. In Proc. of Int. Conf. of GAC-MAC. Vancouver, Canada.
Lundgren, T. and Lindahl, L.-Å. 1991. The efficiency of covering the sulphidic waste rock in Bersbo, Sweden. In Proceedings of the Second International Conference on the Abatement of Acidic Drainage. Montreal. Vol. 3: 239-255
Ribet, I., Ptacek, C.J., Blowes, D.W., and Jambor, J.L. 1995. The potential for metal release by reductive dissolution of weathered mine tailings. Journal of Contaminant Hydrology 17: 239 - 273.
Ryan, P. and Joyce, C.1991. Prevention and remediation of acid mine drainage from mine waste rocks in Australia. In Proc. of the Second Int. Conf. on the Abatement of Acidic Drainage, Montreal, Vol 1: 221 -245
Singh, S.K., and Subramanian, V. 1984. Hydrous Fe and Mn oxides - Scavengers of heavy metals in the aquatic environment. CRC Critical Rev. Environ. Control, 14: 33 - 90
Stumm, W., and Morgan, J.J. 1991. Aquatic Chemistry. Wiley New York 2nd edition.
Tegengren, F.R. 1924. Sveriges ädlare malmer och bergverk. SGU Ser Ca 17:313 -329. Norstedts , Stockholm. Swedish Geological Survey (in Swedish)
Tessier A:, Cambell P.G.C., Bisson M. 1979. Sequential extraction procedure for the speciation of particulate trace metals. Analytical Chemistry 51:844 - 851.
Tessier, A., Rapin, F. and Carignan, R. 1985. Trace elements in oxic lake sediments: possible adsorption onto iron oxyhydroxides. Geochim. Cosmochim. Acta 49: 183 - 194.
Tessier, A., Carignan, R., Dubreuil, B. and Rapin, F. 1989. Partitioning of zinc between the water column and the oxic sediments in lakes. Geochim. Cosmochim. Acta 53: 1511-1522.