Role of fractalkine/CX3CL1 signalling in the regenerating
olfactory epithelium
Linda Blomster
Biomedical Chemistry 240 hp
University of Kalmar, School of Pure and Applied Natural Sciences Examination Project Work 37.5 hp
In cooperation with
University of Western Australia, School of Anatomy and Human Biology Supervisors:
Marc J Ruitenberg, Dr School of Anatomy and Human Biology
University of Western Australia
35 Stirling Highway, Crawley, Perth, WA 6009 Australia
Anki Koch-Schmidt, Dr School of Pure and Applied Natural Sciences
Senior lecturer University of Kalmar
SE-391 82 Kalmar Sweden
Examiner:
Bengt Persson, Dr School of Pure and Applied Natural Sciences
Professor University of Kalmar
SE-391 82 Kalmar Sweden
ABSTRACT
The olfactory epithelium (OE) is a useful model to study neurogenesis because of the sustained ability for self-repair throughout adult life. The main aim of this study was to investigate putative neuroprotective roles of fractalkine/CX3CL1 signalling in the olfactory epithelium after experimentally-induced cell death and replacement of olfactory sensory neurons. Previous studies have shown that signalling through the fractalkine receptor, CX3CR1, can regulate neurotoxicity of monocyte-derived cells via suppression of pro-inflammatory cytokines production, i.e. IL-1β, TNF-α and IL-6. This is particularly interesting as the latter molecules contribute to a microenvironment that causes neuronal death and impaired neurogenesis.
Real-time PCR (qPCR) was used to investigate differential expression of pro-inflammatory cytokines in wild-type and CX3CR1-deficient mice following olfactory bulbectomy. In addition, immunohistochemistry was used to investigate the influx of phagocytic macrophages into the OE and the extent of neurogenesis following injury. Increased numbers of intraepithelial macrophages were detected in the olfactory epithelium of CX3CR1-deficient mice after injury. Interestingly, expression levels of OMP (a marker for mature olfactory sensory neurons) were significantly reduced in CX3CR1-deficient mice after injury, which is indicative for increased neuronal death. The latter was confirmed by quantitative counts of OMP-positive neurons in tissue sections. The increased expression levels of both TNF-α and IL-6 that were detected in CX3CR1-deficient mice likely contributed to this aggravated neuronal death. The extent of neurogenesis was significantly decreased in the CX3CR1-deficient mice compared to the wild-type mice after bulbectomy.
In summary, these results suggest that fractalkine signalling in the olfactory epithelium may have an important role in the regulation of macrophage responses to injury and maintenance of an environment that allows for functional repair.
2
ABSTRACT (IN SWEDISH)
Många svåra tillstånd, bl.a. trauma mot huvudet och neurodegenerativa tillstånd (Parkinsons och Alzheimers sjukdom), kan drabba det centrala nervsystemet (CNS). Det finns idag inte tillräckligt med kunskap om varför CNS inte kan reparera sig självt efter skada. Att hitta en sådan förklaring är avgörande för utveckling av metoder för att kunna reparera skador som drabbar CNS. Luktepitelet är ett system som består av nervceller och som gör det möjligt för oss att känna lukter. Dessa nervceller är också de enda i nervsystemet som har direkt kontakt med den yttre omgivningen. Farliga substanser i luften påverkar dessa nervceller att kontinuerligt begå programmerat självmord. Otroligt nog ersätts de hela tiden av nya, vilket gör dessa celler unika i nervsystemet. Luktepitelet används därför som modell för CNS, eftersom förståelsen av varför omsättningen av nervceller i detta system är så lyckosam kan ge kunskap om vad som misslyckas i CNS. Nya studier har visat att kommunikation mellan de döende nervcellerna och immunförsvaret är enormt viktig. Bland annat har man funnit att molekylen fraktalkin sänds ut av döende nervceller och påverkar sin receptor som finns på immunceller. Vilka konsekvenser detta ger är dock ännu inte helt klart.
I denna studie undersöktes rekrytering av immunceller, överlevnad och nybildning av nervceller samt uttryck av ett antal gener från de nämnda immun/nervcellerna i luktepitelet. Detta gjordes i närvaro och frånvaro av fraktalkinsignalering. För att kunna göra detta användes en genmodifierad mus som har en icke funktionell fraktalkinsignalering.
Frånvaro av fractalkin hade en ökad effekt på rekrytering av immunceller till epitelet. Genuttrycksstudien visade att högre koncentration av inflammatoriska gener uttrycktes i frånvaro av fractalkinsignalering, vilket i för stor mängd kan vara skadligt för nervceller. Fler experiment visade att den genmodifierade musen hade ökat antal döende nervceller samt minskad nybildning av nervceller i epitelet. Denna studie bidrar till en bättre förståelse för vilken roll nedsatt fraktalkinsignalering kan ha för inflammationen och hur denna påverkar nervcellsdöd, vilket ofta uppvisas hos personer med neurodegenerativa tillstånd.
3
ABBREVIATIONS
ADAM10 disintegrin-like metalloproteinase 10 BrdU 5-bromo-2-deoxyuridine
cDNA complementary deoxyribonucleic acid CNS central nervous system
CX3CL1 CX3 chemokine ligand 1 CX3CR1 CX3 chemokine receptor 1 DAB 3,3-diaminobenzidine
EDTA ethylenediaminetetraacetic acid GABA gamma-aminobutyric acid GBC globose basal cell
GFP green fluorescent protein HBC horizontal basal cell
IBA1 ionized calcium binding adaptor molecule 1 IL-1β interleukin 1 beta
IL-6 interleukin 6
OBX olfactory bulbectomy OE olfactory epithelium OMP olfactory marker protein OSN olfactory sensory neuron PBS phosphate-buffered saline
qPCR quantitative polymerase chain reaction RNA ribonucleic acid
TACE tumor necrosis factor alpha converting enzyme TNF-α tumor necrosis factor alpha
4
TABLE OF CONTENTS
1 INTRODUCTION ... 6
1.1 Central nervous system ... 6
1.2 Primary olfactory pathway as a model ... 6
1.3 Anatomy and function of the olfactory system ... 7
1.3.1 Olfactory epithelium ... 8
1.3.2 Lamina propria ... 10
1.3.3 Olfactory bulb and higher central projections ... 10
1.4 Diseases and conditions affecting the olfactory system ... 11
1.5 Adult neurogenesis ... 12
1.6 Injury models ... 13
1.6.1 Surgical procedures ... 13
1.6.2 Olfactory toxicants ... 14
1.7 OSN death, phagocytosis and stem/progenitor cell activation ... 14
1.8 Fractalkine signalling ... 15
1.9 Aim of present study ... 17
2 MATERIALS AND METHODS ... 18
2.1 Experimental animals ... 18
2.2 Genotyping ... 18
2.3 Surgical procedures ... 20
2.4 Tissue processing ... 21
2.5 Immunohistochemistry and –fluorescent labelling ... 21
5
2.5.2 Staining of proliferating cells in the olfactory epithelium ... 22
2.5.3 Immunofluorescent staining procedures ... 23
2.6 Cell counting ... 24
2.7 Dissection of olfactory epithelium and RNA isolation ... 25
2.8 Real-Time PCR ... 26
2.9 Statistical analysis ... 27
3 RESULTS ... 28
3.1 Quantification of macrophages in the epithelium 48h after injury ... 28
3.2 Gene expression analysis in the OE ... 32
3.3 Detection of OMP+ cells in tissue sections ... 39
3.4 Neurogenesis in the OE 48 hours after injury ... 41
4 DISCUSSION ... 42
4.1 Consequences of CX3CR1-deficiency on macrophage infiltration and inflammation ... 42
4.2 Lack of CX3CL1-signalling impacts on OSN survival and stem cell proliferation ... 45
ACKNOWLEDGEMENTS ... 47
6
1
INTRODUCTION
1.1 Central nervous system
The nervous system consists of two parts, the central nervous system (CNS) and the peripheral nervous system (PNS). Included in the CNS are the brain and the spinal cord which occupy the cavity within the scull and the spinal vertebrae, respectively. The PNS comprises all the nerves outside CNS that extend from the brain and the spinal cord.
Injury to CNS can occur in many different ways including head trauma and neurodegenerative conditions. It is generally accepted that the potential of regeneration in CNS is limited. The ability to understand the complexity of the neuronal environment, its function and why regeneration fails in the CNS is of crucial importance to develop methods for CNS repair.
1.2 Primary olfactory pathway as a model
The olfactory organ is an accessible system and a useful model to study neuronal death and replacement. There is a successful ongoing replacement of neurons in both the peripheral olfactory epithelium and the centrally located olfactory bulb throughout adult life. The olfactory epithelium is also the only place in the nervous system where nerve endings are directly exposed to the external environment. This makes the olfactory system vulnerable but probably also the most successful one, in maintaining a functional and structural environment, in the nervous system. An understanding of the successful neuronal turnover and the environment in the olfactory system and how it differs from the CNS might give understanding to why regeneration in the CNS tends to fail.
7 1.3 Anatomy and function of the olfactory system
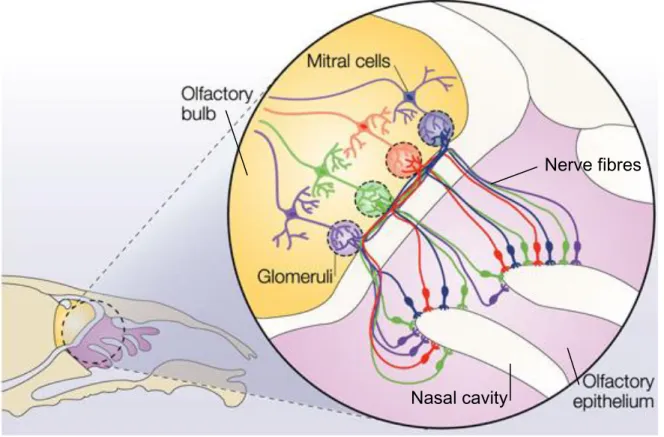
The olfactory organ is a sensory system that allows us to smell. The major parts of the system are the olfactory epithelium, nerve, and bulb, which together create the primary olfactory pathway. The olfactory epithelium is located in the roof of the nasal cavity along both sides of the nasal septum and has the shape of turbinates. Axons from the epithelium form the olfactory nerve which projects through the foramina in the cribriform plate on to the olfactory bulbs. In the bulb, these axons connect to second order neurons, i.e. mitral cells and tufted cells (Fig. 1).
Figure 1. Structure/overview of the olfactory system in rodents. The olfactory epithelium (purple) contains the olfactory sensory neurons. Each neuron expresses one single odorant receptor gene. The nerve fibres of the neurons project through the cribriform plate (white) separating the olfactory epithelium from the olfactory bulb (yellow). Axons from the receptor neurons with the same odorant receptor gene then have to synapse up on mitral cells and tufted cells in the correct glomeruli within the bulb for correct recognition of odors. (Modified from: Suzanne Farley, 2004).
Nasal cavity
8 1.3.1 Olfactory epithelium
The olfactory epithelium (OE) consists of three different layers: the apical, intermediate and basal layer. In the apical layer of the epithelium the cell bodies of the sustentacular and microvillar cells are located (Fig. 2). These are the supporting cells to the olfactory sensory neurons (OSNs) which are bipolar receptor cells situated in the intermediate compartment of the epithelium. The dendrites of these nerve cells project to the apical part of the epithelium. Here they are in direct contact with the external surroundings and this is also the location for cilia and the odorant receptors. At the other end, each OSN has a single axon that projects from the epithelium via the basal lamina to the olfactory bulb. The OSN has a continuous turnover throughout adult life but the estimated lifespan of OSNs is not clear. Variations between 4 weeks up to 12 months in mice have been suggested (Graziadei et al., 1979; Mackay-Sim and Kittel 1991a, b) depending on the extent/degree of challenges from the surrounding environment. The maturing progress of OSN can be characterized via olfactory marker protein (OMP) (Margolis, 1972; Farbman and Margolis, 1980) for mature OSNs and β 3-tubulin or growth associated protein B-50/GAP-43 for immature OSNs (Verhaagen et al., 1989; Lee and Pixley, 1994).
9
Figure 2. Structure of the olfactory epithelium and the underlying lamina propria. (Ruitenberg and Vukovic, 2008).
The stem cells are situated in the basal compartment of the epithelium near the basal lamina (Mackay-Sim and Kittel, 1991a; Caggiano et al., 1994). The stem cells consist of horizontal basal cells (HBCs) and globose basal cells (GBCs) (Calof et al., 2002). Horizontal cells rarely proliferate in vivo (Mackay-Sim and Kittel, 1991a; Caggiano et al., 1994) but can regenerate both neuronal and non-neuronal cell lineages in the OE (Leung et al., 2007). The GBCs proliferates more often than HBCs, and are the direct precursors of immature OSNs.
10 1.3.2 Lamina propria
Underneath the OE is the lamina propria. This is where the unmyelinated axons from the OSN are gathered in small nerve bundles forming the olfactory cranial nerve I. Within these nerve bundles olfactory ensheathing cells are present. The function of these specialized glial cells is to create a supporting environment for axonal growth of the OSNs. The lamina propria is also the location of blood vessels and Bowman‟s glands. Bowman‟s glands extend to the nasal cavity and produce a thin protective mucus layer, covering the epithelium, which prevents foreign microbes and substances to enter the epithelium.
1.3.3 Olfactory bulb and higher central projections
The olfactory bulb is a part of CNS and has five distinct layers: the glomerular layer (GL), the external plexiform layer (EPL), the mitral cell layer (MCL), the internal plexiform layer (IPL), and the granule cell layer (GCL). Axons from the OSNs synapse up on dendrites of mitral cells and tufted cells, in the GL of the olfactory bulb. Each glomerulus within this layer has a very distinct spherical structure. The main function of mitral cells is to transmit olfactory stimuli from receptor cells to centrally located brain regions. The cell bodies of tufted cells can be located in the EPL and the cell bodies of mitral cells in the MCL. Axons from these cells come together in the IPL where they project to higher brain structures for smell processing and awareness.
Output from the olfactory bulb takes place via the olfactory tract. The pathway leads to two main destinations. The first one is via the thalamus and to the olfactory cortex. The other one is via the subcortical route to the hypothalamus and regions of the limbic system. This is where the emotional aspects of smell can be analyzed and responded to.
11 Granule and periglomuerular cells receive feedback from higher brain structures, e.g. the olfactory cortex, and secrete inhibitory neurotransmitters in the olfactory bulb. Each glomerulus is a discrete functional unit surrounded by small neurons called periglomerular cells. The dendrites of these cells can enter more then one glomerulus but preferably sticks to one whereas the axon can connect with two to four glomeruli. Periglomerular cells are GABAergic and have an inhibitory function within the GL. Granule cells are located in the GCL and in the MCL. These are also GABAergic cells that receive feedback from the olfactory cortex and can inhibit mitral cells via synapses between these cells.
1.4 Diseases and conditions affecting the olfactory system
In addition to being a good model to study nervous system injury and repair, research on the olfactory system has also a direct clinical relevance because there are many disorders and conditions that affect the sense of smell. Anosmia is the general term used for the lost ability to smell. Common causes of anosmia are head trauma, upper respiratory tract infection and neurodegenerative diseases, e.g. Parkinson‟s disease and Alzheimer‟s disease.
Head trauma is a common cause of permanent anosmia due to shearing of the axons at the level of the cribriform plate. A structurally impaired pathway can cause disorganization among the nerve fibres which leads to a poor regeneration process (for review, see Ruitenberg and Vukovic, 2008). Fraction to the scull or the nasal bone can cause damage to the brain regions processing smell, or directly to the OE, resulting in a complete or partly complete olfactory loss (Zusho, 1982; Renzi et al., 2002).
12 Effects on the olfactory system after an infection are not very well known. A suggestion is that the OSNs in the OE and the olfactory bulb are damaged where a decrease can be seen in the number of OSNs after infection. The potential of fully restoring the ability to smell is dependent on the severity of the infection (Yamagishi et al., 1994). It has been proven that viruses can invade the central nervous system via the olfactory pathway in to the olfactory bulb and higher brain regions (Barnett et al., 1993), which would then cause the impairment in olfaction. The type of virus most associated with olfactory loss or the mechanisms for this is however unknown.
Loss of smell is also one of the first symptoms amongst people with neurodegenerative diseases. Cell death and typical disease markers such as plaques and Lewy bodies can be seen in the olfactory bulb in the early stages of these neurodegenerative conditions (Ohm, 1987; Pearce et al., 1995). Many speculations to the connection between the olfactory system and these diseases exists (for review, see Doty, 2008). But what is causing olfactory deficits and whether this is a cause or a consequence remains an open question.
1.5 Adult neurogenesis
Adult neurogenesis occurs within three different areas: hippocampus, the subventricular zone and the OE. It seems that neurogenesis in the adult OE is the highest of all known neurogenic regions. Adult neurogenesis in the OE occurs to replace OSNs. This is because the position of these neurons is very exposed to the potentially harmful influences from the outer environment. The replacement of OSNs allows for sustained ability to smell throughout life. Neurogenesis occurs from the HBCs at the base of the epithelium (Leung et al., 2007) that differentiate into GBCs, immature OSNs and finally mature OSNs. Neurogenesis can be quantified via labelling with 5-bromo-2-deoxyuridine (BrdU), a thymidine analogue that selectively incorporates into the DNA of dividing cells during the S-phase. Normally, repopulation of OSNs is most dependent
13 on GBCs (Carr and Farbman, 1992; Caggiano et al., 1994) and the HBCs are only activated in case the reservoir of GBCs gets depleted after extensive damage to these cells (Leung et al., 2007). During the maturation process, adult-born neurons have to regrow an axon from the OE through the cribriform plate to synapse with the correct dendrites of second order neurons in glomeruli of the olfactory bulb. Data from experimental studies suggests that this natural repair process takes approximately six weeks to complete (Cummings et al., 2000).
1.6 Injury models
Several injury models are used to trigger the neuronal cell death and neurogenesis in the OE. This makes it easier to study cell death, replacement and molecular responses within the primary olfactory pathway because everything happens in a larger scale compared to normal neuronal turnover which occurs only to a very low extent. Techniques are often used that either ablate or deafferent the olfactory bulb. The latter can be achieved via olfactory nerve transection or use of olfactory toxicants.
1.6.1 Surgical procedures
Olfactory bulbectomy (OBX) is a surgical procedure where the bulb is removed on one or both sides. Because of the lost synaptic target, apoptosis of the mature OSNs is induced in the intermediate part of the OE (Cowan et al., 2001; Carson et al., 2005). Although this triggers stem cell proliferation in the basal compartment, the epithelium will never fully recover because of the loss of target, and remains thinner than normal (Costanzo and Graziadei, 1983; Verhaagen et al., 1990). This model is particularly useful to study aspects of neuronal death and stem/progenitor cell activation in the OE in the early phases after injury as this surgical procedure is very reproducible.
14 1.6.2 Olfactory toxicants
Olfactory toxicants can also be used to cause massive OSN turnover. The advantage of these types of lesions, over the olfactory bulbectomy model, is that they allow for complete studies on pathway repair as synaptic targets for olfactory epithelial neurons in the olfactory bulb are not compromised. The route of exposure can be both inhalatory or systemic.
Triton X-100 is an olfactory toxicant that induces cell death in immature and mature OSNs after intranasal irrigation. This lesion gives a full recovery after 7 weeks when no difference can be seen from unlesioned control animals (Verhaagen et al., 1990). Methimazole is a drug used to treat hyperthyroidism but has side-effects that can induce loss of smell in humans after systemic administration (Schiffman and Gatlin, 1993; Cooper, 1999; Bandyopadhyay et al., 2002). It can also induce extensive necrosis in the rodent olfactory mucosa after an intraperitoneal injection (Brandt et al., 1990; Brittebo 1995; Genter et al., 1995; Mancuso et al., 1997). Many of the basal cells are spared and it is therefore possible for the epithelium to restore itself but with some invaginations (Brittebo and Eriksson, 1995; Bergman and Brittebo, 1999; Leung et al., 2007).
1.7 OSN death, phagocytosis and stem/progenitor cell activation
Lesion to the olfactory system results in a massive cell death of the OSNs in the first 24-72 hours after surgery. These apoptotic cells are cleared by macrophages in the olfactory epithelium via phagocytosis (Suzuki et al., 1995; Nan et al., 2001). Communication between neurons and the innate immune system is thought to be important to maintain a good surrounding environment for surviving neurons and progenitors that need to replace lost OSNs (Griffiths et al., 2007). In fact Borders et al. (2007a) showed that depletion of macrophages in the OE can increase OSN apoptosis after injury and decreases the number of proliferating basal cells in the OE. Macrophages secrete various chemokines, cytokines and growth factors that help to recruit more macrophages to the
15 area and stimulate epithelial stem/progenitor cells. Little is known about the molecular mechanisms behind successful signalling between immune cells and neurons in the OE.
Recently, a study showed that a chemokine called fractalkine is expressed by OSNs (Ruitenberg et al., 2008). The receptor for fractalkine is expressed on macrophages (Imai et al., 1997). Fractalkine signalling is thought to be neuroprotective via inhibition of the production of pro-inflammatory cytokines (Meucci et al., 1998; Mizuno et al., 2003; Cardona et al., 2006). Thus, fractalkine would be an appealing candidate to maintain tissue homeostasis in the OE.
1.8 Fractalkine signalling
Bazan et al. (1997) were the first to discover the chemokine CX3CL1, also called fractalkine in humans and neurotactin in mice. It is characterized by a conserved C-X-X-X-C motif and is the only member of a novel subclass of chemokines. This chemokine is a 95 kDa multidomain molecule that is produced as a membrane-bound glycoprotein. It consists of a transmembrane anchor domain via a mucinlike stalk and an extracellular chemokine part. The membrane-bound form of CX3CL1 acts as an adhesion molecule whereas proteolytic cleavage (shedding) of the chemokine gives rise to a soluble 80 kDa form that can induce chemotaxis. Shedding of the molecule takes place via disintegrin-like metalloproteinase 10 (ADAM10) and/or tumor necrosis factor-α-converting enzyme (TACE/ADAM17) (Garton et al., 2001; Tsou et al., 2001; Hundhausen et al., 2003). ADAM10 contributes to constitutive cleavage of CX3CL1, whereas TACE seems to mediate inducible shedding (Hundhausen et al., 2003).
CX3CL1 is expressed on endothelial cells, epithelial cells, smooth muscle cells and CNS neurons (Bazan et al., 1997; Pan et al., 1997; Harrison et al., 1998; Muehlhoefer et al., 2000; Lucas et al., 2001; Ludwig et al., 2002; Wong et al, 2002). Most recently this
16 chemokine was confirmed to be expressed in the neuronal layer of the OE (Ruitenberg et al., 2008). The fractalkine receptor CX3CR1 is the sole receptor for the fractalkine ligand (Imai et al., 1997). This receptor is a 7-transmembrane G-protein-coupled receptor expressed on monocytes, macrophages, dendritic cells, T-cells, natural killer cells in the circulation, and by microglia in the CNS (Imai et al., 1997; Harrison et al., 1998; Jung et al., 2000; Huang et al., 2006; Ruitenberg et al., 2008). Thus, fractalkine signalling through its receptor in the OE allows for direct communication between OSNs and monocyte-derived cells, i.e. macrophages and dendritic cells (Ruitenberg et al., 2008; see also Fig. 3).
Figure 3. The fractalkine ligand is released from the cell membrane of injured neurons via ADAM10 and TACE. It then interacts with its receptor mainly expressed on macrophages and CNS microglia. Fractalkine signalling is thought to be neuroprotective via the inhibition of the production of pro-inflammatory cytokines, i.e. TNF-α , IL-6 and IL-1β. (Ré and Przedborski, 2006; Cardona et al., 2006)
17 1.9 Aim of present study
The main aim of this study was to investigate putative neuroprotective roles of fractalkine/CX3CL1 signalling in the OE after experimentally-induced cell death and replacement of olfactory sensory neurons. For this study, a transgenic knock-in mouse was used in which the Cx3cr1 coding region was replaced by that of the green fluorescent protein (GFP) (Jung et al., 2000). This allows (1) for easy detection of GFP+ monocyte-derived cells in the OE and (2) to study cellular and molecular consequences of lack in fractalkine signalling during epithelial regeneration. To experimentally induce OSN death and replacement, target ablation or olfactory bulbectomy was chosen because of its reproducibility. qPCR was used to determine the expression levels of selected genes and immunohistochemistry was used to localize and validate these results. BrdU labelling and immunohistochemistry was also used to determine the extent of neurogenesis following injury.
18
2
MATERIALS AND METHODS
2.1 Experimental animals
A total of 62 C57BL6J mice (♂/♀; 2-4 months of age) were used in this study. Wild-type (Cx3cr1+/+), heterozygous (Cx3cr1+/gfp) and homozygous knock-in (Cx3cr1gfp/gfp) mice were generated from heterozygous Cx3cr1tm1Litt breeding pairs (Jung et al, 2000). In the latter transgenic mouse line, the coding sequence for enhanced green fluorescent protein (eGFP) was inserted into the Cx3cr1 coding region via targeted deletion, i.e. rendering it non-functional and placing eGFP under control of the Cx3cr1 promoter. The mice were kept on a 12h light/dark cycle and had free access to food and water. All procedures were approved by the Animal Ethics Committee of The University of Western Australia and in accordance with guidelines of the National Health and Medical Research Council (NHMRC) for animal handling and experimentation.
2.2 Genotyping
Genomic mouse DNA was isolated from tail snips (~1mm) of each experimental animal. Tail samples were incubated overnight at 55oC in 500µL digestion buffer (50mM Tris-HCl, pH 8.0, 100mM EDTA, 100mM NaCl, 1% SDS) supplemented with 25µL proteinase K (10mg/mL). The next day, 180µL NaCl (4M) was added to the solution and, after vortexing, the samples were centrifuged for 10 min at room temperature at maximum speed (13,793 x g) in a standard tabletop microcentrifuge. The supernatant was carefully transferred to a new tube and 380µL isopropanol was added to precipitate the DNA. The DNA was then pelleted via centrifugation for 5 min at maximum speed (13,793 x g). The supernatant was discarded and the pellet washed with 200µL 70% ethanol. After another short centrifugation at maximum speed (2 min; 13,793 x g), the supernatant was discarded and the pellet was left to air dry for approximately 30 minutes. The remaining pellet was dissolved in 40µL milli-Q water and the DNA
19 concentration was quantified with a NanoDrop 1000 spectrophotometer (NanoDrop Technologies, USA). On average, these preparations yielded 100 ng/µL DNA.
Two sets of PCR reactions were performed to detect Cx3cr1 and/or GFP gene copies in individual mouse DNA samples. A typical example of the PCR reaction and reagents can be seen in Table 1. Primer pairs were designed using Primer3 software (Rozen and Skaletsky, 2000) and specified in Table 2 (see below, section 2.9). Identity of the PCR product was confirmed by sequence analysis (shotgun).
Table 1. Reagents used in PCR reaction.
PCR runs were performed under the following conditions: an initial step of 95oC for 2 minutes (denaturation) followed by 30 cycles of 30s at 95oC (denaturation), 1 min at 55oC (primer annealing) and 1 min at 72oC (elongation). During the last cycle the elongation step was extended to 5 min. The size of the PCR product was analyzed via agarose gel (2%) electrophoresis. DNA was visualised with SYBRSafe (Invitrogen Corporation, USA) and the gel analyzed with Kodak Image station 2000MM (Fig. 4).
Reagent
~250ng cDNA 2.5µL
5x GoTaq PCR Buffer 5µL
2.5 U GoTaq DNA polymerase (Promega) 0.5µL
5 µM Forward primer 5µL
5µM Reverse primer 5µL
10mM dNTP mix 0.5µL
25mM MgCl2 2.5µL
20
Figure 4. Two separate PCR reactions were performed to identify the genotypes of each mouse used in this study. PCR reactions with a mouse DNA sample giving a product only for Cx3cr1 was classified as wild-type (Cx3cr1+/+). Heterozygous mice (Cx3cr1+/gfp) showed a product for both PCR reactions and the homozygous knock-in mice (Cx3cr1gfp/gfp) showed only a product for GFP.
2.3 Surgical procedures
Unilateral ablation of the olfactory bulb (target ablation) was used to induce retrograde death of olfactory receptor neurons in the olfactory epithelium. Olfactory bulbectomy was performed on all animals (48 hours and 72 hours) except for the control and/or sham group which did not receive any lesion. Mice were anaesthetised with 3% Avertin (2,2,2-tribromoethanol and 2-methyl-2-butanol; 300 mg/kg; Aldrich Chemical, USA) and kept on a warm plate. Head was shaved and the skin overlaying the target area wiped with 70% ethanol. A scalpel blade was used to generate an incision in rostrocaudal direction to expose the skull. A hole was drilled through the bone at the location of the right olfactory bulb. At the caudal end, the olfactory bulb was carefully separated from the forebrain with a sharpened 27 Gauge needle and subsequently removed using vacuum aspiration. After removal, resulting cavity was filled with a piece
193bp
1 2 3 4 5 1. 100bp DNA ladder 2. Cx3cr1+/+ 3. Cx3cr1+/gfp 4. Cx3cr1gfp/gfp 5. Negative control 265bp Cx3cr1 GFP
21 of sterile gelfoam and the skin sutured. Animal received subcutaneous injections of the analgesic Buprenorphine (0.1mg/kg; Reckitt and Colman, UK) and 0.2mL saline (0.9% NaCl) immediately after surgery and were then left to recover.
2.4 Tissue processing
For histological assessment, mice were sacrificed at 48 hours following surgery. All animals were administered bromodeoxyuridine (BrdU; Sigma, USA) to label proliferating cells in the olfactory epithelium. BrdU was injected intraperitoneally (100 mg/kg) at 2 hours prior to perfusion. At the specific time point, mice were deeply anaesthetised with sodium pentobarbitone (150mg/kg; Virbae, Australia). The animals were then perfused transcardially with 10mL saline followed by 30mL of 4% paraformaldehyde in 0.1M phosphate-buffered saline pH 7.4 (PBS). The olfactory epithelium and bulb were carefully dissected out, post-fixed overnight and then further incubated in 250mM EDTA in PBS for 12-14 hours at 4oC to decalcify the bones. The tissue was cryoprotected via subsequent overnight incubations in 10% and 30% sucrose in PBS, followed by snap freezing in dry-ice cooled isopentane. The tissue samples were stored at -80oC until further processing. Four series of horizontal sections (20µm) through the olfactory epithelium and bulb were cut on a cryostat (Leica CM3050 S; Leica Biosystems, Australia). Sections were collected on SuperFrost Plus slides (Menzel, Germany), air-dried for 2 hours and stored at -80oC until further processing.
2.5 Immunohistochemistry and –fluorescent labelling 2.5.1 Macrophage staining
After removal from -80oC, slides were left to defrost for at least 15 min at room temperature before being rehydrated in PBS. Sections were incubated with PBS containing 10% MeOH and 0.6% H2O2 for 30 min at room temperature to quench
22 at room temperature and further treated with a blocking solution (0.2% Triton X-100 and 2% bovine serum albumin (BSA; Sigma) in PBS) for 1 hour at RT to permeabilise the sections and prohibit unspecific binding of antibody. The blocking solution was also used as antibody diluent during all incubation steps. Sections were incubated overnight at 4oC in a humidified chamber with either rabbit anti-GFP (1:200; Chemicon, USA) for Cx3cr1+/gfp and Cx3cr1gfp/gfp mice, or rabbit anti-ionized calcium binding adaptor molecule 1 (IBA1; 1:250; Wako Chemical Industries, Japan) for Cx3cr1+/+ mice; IBA1 antibody selectively stains for macrophages and brain microglia. The next day, slides were carefully washed three times in PBS and incubated with biotinylated goat anti-rabbit secondary antibody (1:200; Vector Laboratories, USA) for one hour at RT. Slides were carefully washed and further incubated for 1 hour at RT with Vectastain Elite ABC reagent (1:200; Vector Laboratories). Slides were washed again three times in PBS for 5 min each and the staining developed using 3, 3-diaminobenzidine (DAB; Sigma) in the presence of 0.01% H2O2 for approximately 5-10 minutes at RT. After washing, slides
were counterstained with haematoxylin, dehydrated through graded series of ethanol/ toluene and coversliped with DPX mounting medium. Staining was examined using standard light microscopy.
2.5.2 Staining of proliferating cells in the olfactory epithelium
Staining for BrdU was used to visualise dividing cells in the basal stem/progenitor cell compartment of the olfactory epithelium in experimental mice. Immunohistochemistry for BrdU was performed as described above but required additional treatment with 2N HCl for 45 min at 37oC to denature the DNA prior to blocking and antibody incubation. Sections were further incubated with BEATTM blocker kit (Zymed Laboratories Inc., USA) as per manufacturer‟s instructions to eliminate nonspecific antibody binding. Mouse monocloncal anti-BrdU (1:100; Roche Diagnostics, USA) was applied to the sections for overnight incubation at 4 oC. After washing, slides were incubated for 1 hour at RT with biotinylated goat anti-mouse secondary antibody (1:200; Vector
23 Laboratories). Slides were then washed again, incubated with Vectastain Elite ABC reagent and the staining developed as per above.
2.5.3 Immunofluorescent staining procedures
To visualise mature olfactory sensory neurons and/or macrophages in the olfactory epithelium, sections were rehydrated in PBS and incubated with PBS containing 0.2% Triton X-100 and 2% BSA for 1 hour at RT. Additional incubation with BEATTM blocker kit was performed where applicable. For neuronal staining, one series of slides from each experimental animal was incubated with goat anti-olfactory marker protein (OMP; 1:1000; Wako), which selectively stains mature olfactory sensory neurons in the olfactory epithelium. Another series of slides was incubated with a mixture of polyclonal rabbit anti-IBA1 (1:200) and monoclonal mouse anti-GFP (1:100; Chemicon) for double labelling of intraepithelial macrophages in Cx3cr1+/gfp and Cx3cr1gfp/gfp mice. All primary antibody incubations were performed overnight at 4oC in a humidified chamber. The next day, slides were washed three times with PBS and incubated for 1 hour at RT with biotinylated donkey anti-goat (1:200; Vector Laboratories) for OMP staining, or a mixture of biotinylated goat anti-rabbit (1:200) and Alexa Fluor 488-conjugated donkey anti-mouse (1:400; Invitrogen Corporation) for intraepithelial macrophages. After three washes in PBS, sections were incubated with Alexa Fluor 546-conjugated streptavidin (1:400; Invitrogen Corporation) for 1 hour at RT. Another round of washings in PBS was used to remove any unbound antibodies and the slides were coverslipped in fluorescent mounting medium (Dako, USA) containing Hoechst 33342 nuclear dye (Sigma). Fluorescence microscopy was used to visualise the staining and images were captured at maximum signal intensity on a Leica TCS SP2 Multiphoton Confocal Microscope at the Centre for Microscopy, Characterisation and Analysis (UWA).
24 2.6 Cell counting
For quantitative assessments of the number of GFP+, IBA1+ or BrdU+ cells in Cx3cr1+/+, Cx3cr1+/gfp and Cx3cr1gfp/gfp mice, counts were obtained from septal olfactory epithelium at three defined levels along the dorso-ventral axis (Fig. 5). Sections for GFP and IBA1 were visualised under a Leica light microscope with motorised stage (Image Acquisition & Analysis Facility, UWA). Tiled images of olfactory epithelium on both sides of the septum from each level were captured using Image-Pro software (Media Cybernetics, USA) at 200x magnification and the number of GFP+/IBA1+ intraepithelial macrophages was counted. Separate counts were obtained from both the injured (ipsilateral) and the intact (contralateral) side.
Figure 5. Representative sections of the three defined levels along the dorso-ventral axis of the olfactory epithelium. Classical haematoxylin and eosin (H&E) cell staining was used in combination with Alcian blue for bony/cartilaginous tissue. Part of the septal bone (blue) can be seen at the midline in each section. Level 1 represents the most dorsal part of the olfactory epithelium that was analysed while level 3 represents the most ventral part (Courtesy of Dr. Jana Vukovic, School of Anatomy and Human Biology, UWA).
For BrdU+ cell counts, sections were visualised live under a Olympus BX50 light microscope at 600x magnification and the number of immunostained cells counted through the z-axis using StereoInvestigator software (MBF Bioscience, USA). In all
25 cases, the length of the analysed segment of olfactory epithelium was determined by tracing along the basement membrane. Data were expressed as the number of immunostained cells per millimetre (mm) of olfactory epithelium and averaged between the three levels for each animal. On average, 2-4mm of olfactory epithelium on either side of the septal bone was examined for each level per experimental animal.
To assess differences in the death of olfactory sensory neurons in response to injury in both Cx3cr1+/+ and Cx3cr1gfp/gfp mice, the number of OMP+ neurons in the olfactory epithelium were quantified using similar methods as described by Borders et al. (2007). In brief, three confocal images were captured of injured olfactory epithelium along the septum for each of the defined levels 1 and 2 at 630x magnification. The number of OMP+ neurons with a distinct cell body was counted using ImagePro software and expressed as a percentage of the total (Hoechst-positive) cell number. Obtained values from each level were averaged per experimental animal. Counts were derived from a total analysed length of 1430µm of olfactory epithelium per animal.
2.7 Dissection of olfactory epithelium and RNA isolation
Animal were killed and the olfactory epithelium was quickly isolated under a standard dissection microscope using RNase free methods. Each tissue sample was weighed and transferred into 200µL RNAlater (Ambion) on ice until all experimental animals were dissected. Olfactory epithelium was harvested from either side the septal bone, i.e. both ipsilateral and contralateral to olfactory bulbectomy. Next, RNAlater was removed and 350µL buffer RLT added (Qiagen Pty Ltd, Australia). The tissue was homogenized via trituration through a graded series of 21-, 25-, 26- and 27-gauge needles. Total RNA isolation was performed using RNeasy micro kit (Qiagen Pty Ltd) according to the manufacturer‟s instruction. The quality and concentration of the isolated RNA was determined with a NanoDrop 1000 spectrophotometer.
26 Reverse transcription (RT) of RNA to cDNA was performed as follows: 650ng (control group), 552ng (48h group) and 500ng (72h group) of RNA from each animal was used. The amount of RNA used was based on the lowest RNA yield for each group at the specified time point. The required volume of RNA (XµL) for each sample was calculated and mixed with 10-XµL H2O, 0.5µL oligo(dT), 1µL random hexamers and
1µL dNTPs to a final volume of 12.5µL. The mix was heated to 65oC for 5 minutes. A master mix containing 2.5µL 10x RT buffer, 5µL MgCl2, 2.5µL DTT, 1µL RNase Out,
1µL SuperScript III (Invitrogen Corporation) and 0.5µL H2O was added to a final
volume of 25µL. The mix was first incubated at 25oC for 5 min and then for 2 hours at 50oC. The reaction was inactivated by heating to 85oC for 5 min. Purification of the cDNA was performed using PCR Clean-up kit (MO BIO Laboratories Inc, USA) according to the manufacturer‟s instruction. cDNA was stored at -20o
C until further use.
2.8 Real-Time PCR
Quantification of gene expression in the olfactory epithelium was performed using real time PCR (Rotor-Gene 3000; Fisher Biotech, Australia). IQ SYBR Green master mix (Bio-Rad Laboratories, Australia) was used together with 0.5 or 1µL forward and reverse primer (5µM; Table 2) and 1µL cDNA for a total volume of 10µL. PCR runs were performed using the following conditions: 3 minutes at 95oC denaturation followed by 40-50 cycles of 0s at 95oC denaturation, 15s at 50-60oC (Table 2) primer annealing and 5s at 72oC elongation. A melt curve from 70-99oC (0.5oC/s) was performed to analyze the quality of the product. All samples were run in duplicate and the average of each sample was used for further analysis. A non-RT control was included at all times to make sure that no genomic DNA had been amplified. A standard curve was used to quantify the relative amount of transcript in each sample and the obtained values were normalized against ribosomal L19 as an internal control.
27
Table 2. Primers used for genotyping and real time PCR.
Gene Forward primer 5'-3' Reverse primer 5’-3’ Ta Product size
L19 CTG AAG GTC AAA GGG AAT GTG GGA CAG AGT CTT GAT GAT CTC 50oc 195bp
Cx3cr1 CTG GTG GGA AAT CTG TTG GT AGA AGA AGG CAG TCG TGA GC 60oc 193bp
GFP CAC ATG AAG CAG CAC GAC TT AGT TCA CCT TGA TGC CGT TC 60oc 265bp
OMP GCT CCG AGT AGA GAG CCT GA GTC CAG AAC CAC GTT CCA GT 55oc 142bp
β 3-tubulin TAG ACC CCA GCG GCA ACT AT GTT CCA GGT TCC AAG TCC ACC 60oc 127bp
Cx3cl1 ACG AAA TGC GAA ATC ATG TGC CTG TGT CGT CTC CAG GAC AA 60oc 120bp
TACE GTA CGT CGA TGC AGA GCA AA AAA CCA GAA CAG ACC CAA CG 60oc 197bp
Adam10 GAT GAC TAC TGC CTG GCC TA TGA TGC CTG TGT TCA ATG AC 60oc 160bp
IL-1β CAG GCA GGC AGT ATC ACT CA AGC TCA TAT GGG TCC GAC AG 50oc 249bp
IL-6 TTC CAT CCA GTT GCC TTC TT CAG AAT TGC CAT TGC ACA AC 60oc 199bp
TNF-α AGT CCG GGC AGG TCT ACT TT CTC CAG TGA ATT CGG AAA GC 60oc 296bp
2.9 Statistical analysis
Data were analysed for statistically significant differences between the Cx3cr1+/+, Cx3cr1+/gfp and Cx3cr1gfp/gfp mice using parametric (student t-test) and non-parametric (Mann-Whitney U test) comparisons. Data sets were considered significantly different from each other if p ≤ 0.05.
28
3
RESULTS
3.1 Quantification of macrophages in the epithelium 48h after injury
The epithelial response and macrophage influx were examined between Cx3cr1+/+, Cx3cr1+/gfp and Cx3cr1gfp/gfp mice at 48 hours after injury. As expected, the olfactory epithelium became thinner on the injured side of the OE compared to the uninjured side because of the retrograde cell death of the OSNs that occurs after olfactory bulbectomy (Fig. 6A-E) No differences in epithelial thickness were observed between genotypes (data not shown).
An increased number of IBA1+/GFP+ cells could be detected on the injured side of the epithelium compared to the uninjured side for both Cx3cr1+/+ (Fig. 6B, C) and Cx3cr1gfp/gfp mice (Fig. 6D, E). These immunostained cells had, in contrast to the more dendriform cells in the contralateral OE, a large, round phagocytic appearance, suggesting them to be phagocytic macrophages.
29
Figure 6. Immune cell response in the OE 48h after injury in Cx3cr1+/+ and Cx3cr1gfp/gfp mice. (A) Schematic image of the olfactory epithelium (grey) and bulbs. Images B-E were taken from the uninjured and the injured side of the OE (red boxes) along the septal bone (blue). (B-E) Monocyte-derived cells in intact (contralateral) and target-ablated (ipsilateral) OE. The dashed black line indicates the border between the OE and underlying lamina propria. Monocyte-derived cells are immunostained with DAB (brown) and the sections counterstained with haematoxylin (purple). Representative images of the uninjured (B, D) and injured side (C, E) of the epithelium in Cx3cr1+/+ and Cx3cr1gfp/gfp mice, respectively. Note that the epithelium became thinner post-injury compared to the uninjured side for both genotypes due to the loss of OSNs. More IBA1+/GFP+monocyte-derived cells were detected in the OE on the injured side compared to the uninjured side for both genotypes (C, E versus B, D).
30 To ascertain that the entire GFP+ cell population recruited to the OE was also positive for macrophage marker IBA1, double immunofluorescent labelling for IBA1 (Fig. 7A) and GFP (Fig. 7B) was performed, which showed an exact overlap between the two markers (Fig. 7C). A significant increase in the number of intraepithelial macrophages was found in the injured side of the epithelium when compared to IBA1+/GFP+ cell counts in the uninjured contralateral side (Fig. 7D; p < 0.002). Interestingly, comparisons between the genotypes showed that there was a significant (27%) increase in macrophage recruitment in Cx3cr1gfp/gfp mice compared to both Cx3cr1+/+ (p = 0.003) and Cx3cr1+/gfp mice (p = 0.03). Again, Cx3cr1+/gfp mice seemed to have an intermediate phenotype. No such increases were observed in SHAM-operated animals.
31
Figure 7. Macrophage infiltration into the OE of bulbectomised mice. Note the presence of large, round IBA1+ (A) and GFP+ (B) cells at 48 hours after injury. (C) There was an exact overlap between IBA1+ and the GFP+ cell populations (arrows). (D) Quantitative counts of monocyte-derived cells in uninjured and target-ablated OE. Note the influx of macrophages in response to injury and the increased recruitment into the OE of Cx3cr1gfp/gfp mice compared to both Cx3cr1+/gfp (p = 0.03) and Cx3cr1+/+ (p = 0.003). Bars represent mean ± SEM and asterisk indicates p < 0.05.
32 3.2 Gene expression analysis in the OE
Comparative gene expression analysis in OE samples between the three genotypes Cx3cr1+/+, Cx3cr1+/gfp and Cx3cr1gfp/gfp was used to assess the molecular consequences of CX3CR1 deficiency. Gene expression was measured in non-injured control animals as well as bulbectomised mice at both 48 and 72 hours after injury (Fig. 8-11). Quantification of Cx3cr1 and GFP expression was performed to evaluate injury responses and to confirm previous genotyping. As expected, no GFP expression was seen in Cx3cr1+/+ mice. Vice versa, Cx3cr1 expression was absent in Cx3cr1gfp/gfp mice. It is noteworthy that Cx3cr1+/gfp mice expressed Cx3cr1 at approximately 50% reduced levels. The reversed expression could be measured for Cx3cr1. The same trend could be seen for both GFP and Cx3cr1 and for all three groups (Fig. 8A). This may have implications for the use of heterozygous mice as “controls” since these mice often showed an intermediate phenotype between the wild-type mice and the homozygous knock-in mice. This could be related to reduced CX3CR1 receptor expression on the surface of monocyte-derived cells which ultimately resulted in altered responses. As expected, comparisons between control and bulbectomised animals at 48 hours after injury showed increased expression of GFP and Cx3cr1 (Fig. 8B; p < 0.01), which is indicative for macrophage influx and in line with the histological observations.
33
Figure 8. (A) Expression levels of GFP and Cx3cr1 in the OE of control and bulbectomised mice at 48 and 72 hours after injury. All samples were normalised against L19 as an internal control. Obtained values were plotted relative to data from Cx3cr1+/+ mice, which were set as 1 (100%), i.e. showing „relative fold change‟ in expression levels in Cx3cr1+/gfp and Cx3cr1gfp/gfp mice. Because of data
presentation relative to Cx3cr1+/+ mice, no comparisons can be made in terms of expression levels between the different timepoints or between the different genes. Only in case of GFP, data were presented relative to obtained values from Cx3cr1gfp/gfp mice. (B) Comparisons between the control animals and 48 hours after injury for GFP and Cx3cr1. Increased gene expression could be measured after injury for both GFP and Cx3cr1. Bars in each graph are the mean ± SEM and asterisks indicate p < 0.05.
34 No change in expression of fractalkine/Cx3cl1 itself was observed in uninjured control animals and bulbectomised mice at 48 hours after injury, regardless of genotype. However, at 72 hours after injury, a small but significant increase in Cx3cl1 expression levels was observed in Cx3cr1gfp/gfp compared to Cx3cr1+/+ mice (p = 0.02). Expression of Adam10 and TACE, the proteases that are involved in cleavage of CX3CL1 was also assessed. There was no change in Adam10 expression between the genotypes for any of the timepoints. A marginal (16%) drop in TACE expression levels was seen at 48 hours after injury for Cx3cr1gfp/gfp compared to Cx3cr1+/+ mice (p = 0.02) but this difference was no longer present at 72 hours after injury (Fig. 9).
Figure 9. Expression of Cx3cl1, Adam10 and TACE in intact and target ablated OE at 48 hours and 72 hours after bulbectomy. All samples were normalised against L19 as an internal control and plotted as „relative fold change‟ compared to Cx3cr1+/+
mice for each time point. No major changes for any of these genes was observed except for some marginal changes in TACE and Cx3cl1 expression at 48 and 72 hours post-injury, respectively, in Cx3cr1gfp/gfp mice. Bars represent the mean ± SEM and asterisks indicate p < 0.05.
35 In uninjured control mice, there were no differences in expression levels of the pro-inflammatory cytokines TNF-α, IL-6 and IL-1β between the genotypes (Fig. 10A). However, after bulbectomy there was a consistent trend towards increased upregulation of pro-inflammatory cytokines in Cx3cr1gfp/gfp mice, particularly TNF-α and IL-6, following bulbectomy. At 48 hours after injury, there was an approximate 1.4-fold increase in TNF-α (p = 0.04) and IL-6 (p = 0.09) expression in Cx3cr1gfp/gfp mice compared to their Cx3cr1+/+ counterparts. Interestingly, a similar, statistically significant increase was seen in Cx3cr1+/gfp mice for both TNF-α (p = 0.02) and IL-6 (p = 0.013). No change in IL-1β expression was seen at this timepoint between the genotypes (p > 0.4).
By 72 hours, differential expression of TNF-α and IL-6 between Cx3cr1gfp/gfp and Cx3cr1+/+ mice had now increased to 2.7- and 2.4-fold, respectively (p ≤ 0.014). A trend towards upregulated expression of IL-1β (1.5-fold) was also detected at this time point but this did not reach statistical significance (p = 0.14). Expression levels in Cx3cr1+/gfp mice had returned to those detected in their wild-type counterparts. In general, TNF-α was greatly upregulated in response to injury for all three genotypes (p < 0.001). Similarly, IL-6 expression also appeared uppregulated in response to injury but this did only reach statistical significance in Cx3cr1+/gfp and Cx3cr1gfp/gfp mice (Fig. 10B; p < 0.01). Pearson (correlation) test showed that there was a direct, inverse correlation between TNF-α and OMP (p = 0.03) and IL-6 and OMP (p = 0.039) expression levels.
36
Figure 10. Gene expression levels of TNF-α, IL-6 and IL-1β in the OE of control and bulbectomised mice at 48 and 72 hours post-injury. All values were normalised against L19 as an internal control and plotted as „relative fold change‟ in comparison to Cx3cr1+/+
mice. Note the increased expression levels of TNF-α and IL-6 in Cx3cr1gfp/gfp mice after injury. The bars in each graph represent the mean ± SEM and asterisks indicate p < 0.05.
37 Expression of OMP and β 3-tubulin was determined as a measure for mature and immature OSN content in OE samples (Fig. 11A). Again, there were no differences in expression levels between the genotypes in the control group. For OMP, a significant (40%) reduction in expression levels was seen at 48 hours after injury in Cx3cr1gfp/gfp mice relative to injured Cx3cr1+/+ controls (p = 0.04). A similar trend was visible at 72 hours after injury but this was not statistically significant due to intra-group variation. There was no change in β 3-tubulin expression between the genotypes for any of the timepoints although a trend towards reduced expression was seen at 72 hours after injury (p = 0.1). As anticipated, OMP expression levels were reduced in all three genotypes after injury compared to uninjured controls due to the loss of OSNs after bulbectomy (Fig. 11B).
38
Figure 11. Expression analysis of OMP and β 3-tubulin levels in the OE of control animals and at 48 hours OBX and 72 hours OBX. All samples were normalised against L19 as an internal control and plotted as „relative fold change‟ in Cx3cr1gfp/gfp
and Cx3cr1+/gfp mice compared to Cx3cr1+/+ counterparts. (A) Note the decrease in OMP levels in Cx3cr1gfp/gfp relative to Cx3cr1+/+ mice in response to injury. Cx3cr1+/gfp mice also appeared to have reduced OMP expression levels in comparison to wild-type controls. Expression of β 3-tubulin was slightly reduced in Cx3cr1gfp/gfp and Cx3cr1+/gfp mice at 72 hours after injury but this did not reach statistical significance (p ≥ 0.1). Bars in each graph are the mean ± SEM and asterisks indicate p ≤ 0.05.
39 A summary of the general injury responses for all selected genes across genotypes can be seen in Table 3.
Table 3. Gene expression 48 hours and 72 hours post-injury vs control. Red arrows indicate increased gene expression in response to injury. White arrows that are slightly pointing up indicate that there is a trend in upregulated expression and white horizontal arrows show no difference in expression levels. Absence of arrows indicates that the data couldn‟t be matched up.
3.3 Detection of OMP+ cells in tissue sections
To investigate if the reduction in OMP expression levels in OE samples from Cx3cr1gfp/gfp mice was due to increased loss of OSNs, immunofluorescent staining for OMP was performed to detect and quantify mature OSNs numbers in tissue sections
40 from Cx3cr1+/+ and Cx3cr1gfp/gfp mice at 48 hours after olfactory bulbectomy (Fig. 12A-D). Numerous OMP+ cells were found in the intermediate (neuronal) layer of the OE on the uninjured side, i.e. contralateral to olfactory bulbectomy, for both Cx3cr1+/+ and Cx3cr1gfp/gfp (Fig. 12A, C). A dramatic decline in OMP+ neurons was observed on the ipsilateral side for both genotypes (Fig. 12B, D). However, an exacerbated loss and advanced state of OSN degeneration was observed in Cx3cr1gfp/gfp mice, which was evident from less OMP+ cells and reduced apical dendrite expression. Quantitative counts confirmed a decrease in the number of OMP+ cells in target-ablated OE of Cx3cr1gfp/gfp at 48 hours after injury (Fig. 12E, p = 0.05).
Figure 12. Images of the OE from uninjured (A, C) and injured (B, D) side in Cx3cr1+/+ and Cx3cr1gfp/gfp mice, respectively. Sections are immunostained for OMP (red) and counterstained with Hoechst nuclear dye (blue). Arrows indicate OMP+ cells in the injured OE. Note that there is less OMP+ (mature) OSNs in Cx3cr1gfp/gfp mice and reduced expression of apical dendrites (B, arrowhead). GFP-expressing macrophages could also be seen in the OE of Cx3cr1gfp/gfp mice (D, arrowhead). (E) Quantitative counts of the relative number of OMP+ cells in injured OE. Note the aggravated loss of OMP+ OSNs in Cx3cr1gfp/gfp mice. Bars represent mean ± SEM and asterisk indicates p ≤ 0.05.
41 3.4 Neurogenesis in the OE 48 hours after injury
Labelling with BrdU was used to study cell proliferation in the basal progenitor compartment at 48 hours after injury in both Cx3cr1+/+ and Cx3cr1gfp/gfp mice. A typical example of BrdU+ cells in the basal layer of the OE is shown in Fig. 13A. Quantitative counts of the number of BrdU+ cells in Cx3cr1gfp/gfp mice revealed a significant (36%) decrease compared to their Cx3cr1+/+ counterparts (Fig. 13B; p = 0.007).
Figure 13. BrdU labelling of intraepithelial progenitor cells. (A) Typical image of BrdU-positive cells (brown) in the basal compartment of the OE at 48 hours after injury. (B) A decreased number of BrdU+ cells could be detected in the OE of Cx3cr1gfp/gfp compared to Cx3cr1+/+ (p = 0.007). Bars represent mean ± SEM.
42
4
DISCUSSION
The present study shows that the fractalkine signalling in the olfactory epithelium has an important role in the regulation of macrophage responses to injury and maintenance of an environment that prevents secondary cell death and allows for functional repair in vivo from endogenous stem cells.
4.1 Consequences of CX3CR1-deficiency on macrophage infiltration and inflammation
After injury, the vast majority of the mature OMP+ OSN population in the OE died, resulting in thinning of the epithelium. These observations are in agreement with many other studies that have used olfactory bulbectomy to study neuronal death and replacement in the OE (e.g. Verhaagen et al., 1990). There was no differences in epithelial thickness at 48 hours after injury between Cx3cr1+/+ and Cx3cr1gfp/gfp mice (data not shown). As anticipated, the number of intraepithelial macrophages was increased after injury for both Cx3cr1+/+ and Cx3cr1gfp/gfp when compared to the contralateral uninjured side. This finding was in accordance with previous studies since macrophages help to clear dying OSNs after injury (Suzuki et al., 1995; Nan et al., 2001). Macrophage infiltration was also evident from qPCR data on wild-type and Cx3cr1gfp mice, which showed increased levels of GFP and/or Cx3cr1 mRNA in target-ablated OE for Cx3cr1+/+, Cx3cr1+/gfp and Cx3cr1gfp/gfp mice compared to uninjured control samples. This is indicative for more monocyte-derived cells in the OE as shown by histological examination.
Quantitative counts of intraepithelial macrophages resulted in more IBA1+/GFP+ macrophages (27% increase) in Cx3cr1gfp/gfp compared to Cx3cr1+/+ mice. This finding is entirely novel as previous studies have mainly focussed on fractalkine signalling in
43 regulating the activation profile of macrophages or CNS microglia but not investigated its role in recruiting monocyte-derived cells to areas of injury and neuronal degeneration (e.g Cardona et al., 2006). Double immunofluorescent labelling of the macrophage marker IBA1 and GFP showed a complete overlap in individual staining patterns. This excludes the possibility that an additional IBA1-/GFP+ cell population was recruited in Cx3cr1gfp/gfp mice, which could have accounted for the observed increase in intraepithelial macrophages. Thus, lack of fractalkine/CX3CL1 signalling results in increased recruitment of macrophages into the OE after injury. Such a finding is in line with the current scientific view that fractalkine/CX3CL1 signalling is anti-inflammatory or immunomodulatory in the nervous system. Heterozygous Cx3cr1+/gfp mice showed an intermediate phenotype. The latter is an important observation and future studies should take care in using these mice as CX3CR1-expressing controls because of this and the reduced receptor expression levels.
To further examine the consequences of CX3CR1-deficiency at the molecular level, expression levels of selected genes were investigated between genotypes and in response to injury. ADAM10 and TACE are enzymes that cleave the membrane-bound fractalkine/CX3CL1 (Garton et al., 2001; Tsou et al., 2001; Hundhausen et al., 2003) but little is known how these enzymes can influence the activity of fractalkine in vivo. Adam10 expression was upregulated in response to injury. ADAM10 performs proteolytic shedding of CX3CL1 which disrupts the adhesion properties of this chemokine (Hundhausen et al., 2003). This might suggest that more chemotactic properties influence the biologic activity of fractalkine after injury due to shedding of the molecule. There was no change in TACE expression in response to injury except a small increase for the wild-type mice 72 hours after injury. No big changes in gene expression levels could be measured for Adam10, TACE, or fractalkine/CX3CL1 itself between the genotypes. This suggests that lack of signalling through the CX3CR1 receptor does not profoundly affect the expression levels of any of these genes in response to injury.
44 While no effects of a lack in fractalkine/CX3CL1 signalling were observed in the OE of young, unchallenged mice, significant differences were observed after experimentally induced turnover of OSNs. At 48 hours after injury a clear trend towards increased expression levels of TNF-α and IL-6 was observed. These findings are important as TNF-α is known to induce neuronal apoptosis in the OE (Farbman et al., 1999) while both these cytokines in general inhibit neurogenesis (e.g. Monje et al., 2003). In view of the intermediate phenotype that was often observed for Cx3cr1+/gfp mice, it was of interest that a similar increase was observed in both hetero- and homozygous Cx3cr1gfp mice at this time point. By 72 hours, differential TNF-α and IL-6 expression between Cx3cr1gfp/gfp compared to Cx3cr1+/+ mice was even more pronounced, with the observed differences in excess of 2.4-fold. Previous studies have reported that fractalkine can inhibit the production of pro-inflammatory cytokines in vitro (Mizuno et al., 2003) while in vivo increased pro-inflammatory cytokine expression has been reported in response to CX3CR1-deficiency (Cardona et al., 2006). However, these studies did not take into account absolute macrophage and/or microglia numbers in their assessment. The present novel data on increased macrophage recruitment in CX3CR1-deficient mice suggests that this increase might be relative rather then absolute. This needs to be further addressed in future experiments. For the 72 hour time point, a clear trend towards upregulated IL-1β expression was observed. IL-1β can inhibit proliferation of neuronal precursor cells in vitro (Wang et al., 2007) and is associated with neurodegeneration in vivo (Rothwell et al., 2003). It would be of interest to include later (intermediate) time points in future studies to investigate the effects of overall increased pro-inflammatory cytokine levels on epithelial recovery and stem cell differentiation. Taken together, these data suggests that lack in fractalkine signalling ultimately results in overall increased levels of pro-inflammatory cytokines. Future experiments should try and confirm these findings also at the protein level, e.g. by using Western blot or ELISA.
45 4.2 Lack of CX3CL1-signalling impacts on OSN survival and stem cell
proliferation
To investigate whether CX3CR1-deficiency and the resulting changes in expression levels of pro-inflammatory cytokines had a negative effect on epithelial regeneration, both qPCR and histological examination were used to assess cell survival and proliferation in the OE after olfactory bulbectomy.
OMP and β 3-tubulin were used as neuronal markers for mature and immature OSNs in the OE, respectively. Interestingly, the gene expression level for OMP was significantly reduced at 48 hours after injury in Cx3cr1gfp/gfp compared to Cx3cr1+/+ mice. Again, an intermediate phenotype was observed in heterozygous littermates. At 72 hours, a similar trend was present between Cx3cr1gfp/gfp and Cx3cr1+/+ mice but due to intra-group variation, this was not found to be statistically significant. These decreased OMP levels are indicative for increased cell death going on amongst the OSNs in the receptor-deficient mice. Indeed, this hypothesis was confirmed by quantitative cell counts of OMP+ neurons in OE tissue sections at 48 hours following bulbectomy. Previous in vitro studies have shown that TNF-α can induce apoptosis in organotypic cultures of the olfactory epithelium (Farbman et al., 1999; Suzuki et al., 2000). This study supports that hypothesis in vivo and provides evidence that fractalkine/CX3CL1 signalling can be neuroprotective by modulating macrophage recruitment and/or TNF-α expression. Spearman correlation tests showed a significant inverse relationship for expression levels of both TNF-α and IL-6 relative to OMP (p ≤ 0.03). These findings demonstrate that CX3CL1-signalling in the injured epithelium is important for OSN survival and that the relative increase in TNF-α and IL-6 levels, which resulted from CX3CR1-deficiency, directly contributed to neuronal death. Expression levels of β 3-tubulin appeared to be slightly reduced at 72 hours after injury in Cx3cr1gfp/gfp mice but additional histological analysis is needed, perhaps also at additional later time points, to confirm whether the immature neuronal population is also affected in its survival or proliferation after injury in the absence of fractalkine signalling.