Master Thesis
Electrical Engineering
Evaluation of weighting functions for Sidelobe
control in UWB SAR image processing
Habiba Akhter
This thesis is presented as part of Degree of Master of Science in
Electrical Engineering with emphasis on Signal Processing
Blekinge Institute of Technology
September 2012
Blekinge Institute of Technology, Sweden School of Engineering
Department of Electrical Engineering Supervisor: Thomas Sjögren
ii
This thesis is submitted to the Department of Signal Processing, School of Engineering at Blekinge Institute of Technology in partial fulfillment of the requirements for the degree of Master of Science in Electrical Engineering with emphasis on Signal Processing.
Contact Information
Author: Habiba Akhter
Email: haak09@student.bth.se, habiba.khandaker@yahoo.com
University Supervisor: Thomas Sjögren
Dept. of Electrical Engineering School of Engineering
Blekinge Institute of Technology (BTH), Sweden. E-mail: thomas.sjogren@bth.se
Examiner:
Prof. Mats Pettersson
Dept. of Electrical Engineering School of Engineering
Blekinge Institute of Technology (BTH), Sweden. E-mail: mats.pettersson@bth.se
School of Engineering web: www.bth.se/ing Blekinge Institute of Technology Phone: +46 457385000 SE-371 79 Karlskrona Fax: +46 45727129 Sweden.
Abstract
Ultra wideband (UWB) Synthetic Aperture Radar (SAR) holds huge possibilities for both terrestrial and celestial object sensing with excellent details which assists in science and technology. SAR systems associated with large antenna beamwidth, large signal bandwidth and low frequency operating in the VHF/UHF region is becoming gradually more popular because of their rising number of application in the areas of ground-penetrating radar (GPR) and foliage penetration radar (FOPEN).
Apodization techniques in UWB SAR imaging have attracted significant interest in recent years for sidelobe suppression in SAR images. This technique is split into two groups: linear apodization and non-linear apodization. Linear apodization technique means to apply amplitude weighting functions in frequency domain prior to the final inverse Fourier transform requisite to appropriately focus on the SAR images. Both linear and non linear techniques can be used to suppress sidelobes level.
Frequently used linear weighting functions are Hanning, Hamming and Blackman. Linear techniques can control the sidelobes level but image resolution reduces simultaneously. But non-linear techniques like Spatially Variant Apodization (SVA), Complex Duel Apodization and Dual-Apodization can suppress sidelobes and preserve the spatial resolution concurrently. However for these methods, it can be hard to understand how the output signal relates to input signal and also the phase information of image is lost. In this thesis paper, the main focus is, on apodization techniques to propose a new weighting function for sidelobe apodization and investigate it on real SAR images.
In this thesis, we also study Impulse response (IPR) function for UWB SAR image processing. A two dimensional sinc function is used as an impulse response function for narrow band (NB) SAR system. This function can be obtained from a two dimensional Fourier Transform of a SAR image. This rectangular estimation is reasonable for narrow band and narrowbeam SAR. But for large bandwidth and wide integration angles, this approximation for the UWB SAR spectrum is not valid. It can provide erroneous SAR image quality measurements.
To obtain precise image quality measurement, SAR image need to be generated for a range of different integration angle as UWB SAR systems are related with large integration angle to maintain azimuth focusing. So, in this work the choices of optimum windows have been investigated at different integration angles in order to see if there are large differences between NB SAR Apodization and UWB SAR Apodization.
Index Terms—Image processing, Synthetic aperture radar (SAR), Ultra Wideband (UWB),
Acknowledgement
All thanks to almighty God for blessing me with strength and ability to carry out this thesis work. First, and foremost, I would like to express my sincere gratitude to my honorable thesis supervisor Thomas Sjögren for providing me the opportunity to do work on such a wonderful topic and for his constant guidance, suggestions during the research work. He has been extremely patient with me which is the main reason I have been able to complete my thesis work. His knowledgeable supervision, instructive ways of explaining something helped me grasp some idea in an easy way. This thesis would have never been finished without his help. Thanks to Thomas again.
In addition, I would like to thank BTH staff for giving me the opportunity to join such a program. Special thanks to my friends and colleagues who made the life easy for me in aboard.
I humbly acknowledge FOI (Swedish Defense Research Agency) for providing me SAR real image for my research work.
Last but not least, I want to express my hearty gratitude to my parents and my family members for their continuous encouragement, support, and for their love.
Contents
Abstract ... iii Acknowledgement... v List of Figures ... ix List of Tables ... x Chapter 1 ... 1 1.1 Introduction ... 1 Chapter 2 ... 4Basics of Radar Engineering ... 5
2.1 Radar Principals... 6
2.2 Radar classifications ... 7
2.3 Radar Frequency Bands ... 8
2.4 Radar Equation and Resolution Calculation ... 9
Chapter 3 ... 11
Synthetic Aperture Radar ... 11
3.1 How does SAR works ... 12
3.2 SAR system ... 13 3.3 SAR geometry ... 14 3.4 Modes of SAR ... 16 3.5 SAR Resolution ... 17 3.6 Applications of SAR ... 19 Chapter 4 ... 20
Fundamental of Signal Processing for SAR System ... 21
4.1 Chirp Signal ... 21
4.2 UWB SAR... 22
4.3 SAR Doppler History ... 23
4.4 Pulse compression ... 24
4.5 Matched Filtering ... 25
4.6 SAR Image Formation Algorithms ... 28
4.7 Apodization Techniques... 29
Chapter 5 ... 29
Apodization Techniques for UWB SAR image processing ... 31
5.1 Linear Apodization ... 34
5.2 Non-linear Apodization ... 35
viii
Chapter 6 ... 38
Simulation Results of Apodization Techniques ... 39
Chapter 7 ... 49
Conclusion ... 49
List of Figures
Figure 2. 1: Basic radar diagram ... 6
Figure 3. 1: System Block Diagram………. 12
Figure 3. 2: Synthetic Aperture……… 13
Figure 3. 3: SAR Geometry………. 15
Figure 3. 4: Integration angle……… 16
Figure 3. 5: Three different SAR methods: Stripmap, scan and spotlight [1]………. 17
Figure 3. 6: Synthetic array formation………. 18
Figure 4. 1: Real part of Chirp signal given in (4.1) ... 21
Figure 4. 2: Spectrum of Chirp signal ... 22
Figure 4. 3: Diagram of the effect of Doppler shift on the returned frequency ... 24
Figure 4. 4: Plot of rect corresponding to signal ... 25
Figure 4. 5: Plot of rect corresponding to matched filter... 26
Figure 5. 1: Implementing Rectangular window in wave domain ... 31
Figure 5. 2: SAR spectrum in wavedomain... 32
Figure 5. 3: IRF and point target assessment parameters ... 37
Figure 6. 1: SAR image spectrum (integration angle 𝜃 = 55°) ... 40
Figure 6. 2: SAR non- apodized image with different (10 to 110) integration angle ... 40
Figure 6. 3: Contour plot of non-apodized image in dB... 41
Figure 6. 4: Apodized image using Rectangular weighting function ... 41
Figure 6. 5: Apodized image using Hanning weighting function in azimuth direction ... 42
Figure 6. 6: Contour plot in dB after applying Hanning weighting function in azimuth direction ... 42
Figure 6. 7: Apodized image using Hanning weighting function in range direction... 43
Figure 6. 8: Contour plot in dB after applying Hanning weighting function in range direction ... 43
Figure 6. 9: Apodized image by Hamming weighting function in azimuth direction ... 44
Figure 6. 10: Contour plot in dB by applying Hamming weighting function in azimuth direction ... 44
Figure 6. 11: Apodized image by Hamming weighting function in range direction ... 45
Figure 6. 12: Contour plot in dB after applying Hamming weighting function in range direction ... 45
Figure 6. 13: SAR apodized image after applying proposed new weighting function ... 46
Figure 6. 14: Contour plot in dB of apodized image after applying new weighting function... 46
Figure 6. 15: Non- apodized real SAR image... 47
x
List of Tables
2.1: Radar Frequency Bands 7
Chapter 1
1.1 Introduction
In recent years to recognize targets under all weather conditions, the high range resolution radar and sonar has become important. In natural world echo locating mammals for instance whales, dolphins or bats have an imperative to perceive, identify and attack prey for food. It’s a great deal for human that could be discovered by exploring how the nature operates. Echo locating mammals, particularly bats, have been investigated for many years. Altringham presents an outstanding preliminary treatment about this subject [1]. Bat can identify, choose and attack prey even in clutter weather over 50 million years. The idea of echolocation of bats can be applied to radar and sonar systems. The performance of target detection achieved by modern radar and sonar system is a long way short of that attained by bats [1].
Remote sensing images have already achieved importance in a broad range of applications from weather forecast to battlefield reconnaissance. Synthetic aperture radar (SAR) is one of the most promising remote sensing technologies. SAR overcomes the cloud-cover limitations of both optical and infrared imagers and the nighttime limitations of optical cameras.
Synthetic Aperture Radar (SAR) is a coherent radar system, able to produce high resolution images of the earth’s surface. The image corresponds to the backscattered electromagnetic energy, which relies on the properties of the surface, for instance its roughness, pitch and dielectric constant. The radar backscattering cross section also relies on the foliage. This reliance provides SAR images to be utilized in conjunction with models of the scattering method to determine different characteristics of the earth’s surface, such as topography.
SAR image processing often involves two dimensional Fourier transforms. The spectrum shape introduces sidelobes and it has potential of obscuring low intensity scatters in the images. Apodization techniques can decrease sidelobes level while preserving the image resolution. In this thesis paper, based on analysis of different linear and non-linear weighting functions, a new linear weighting function is proposed. This linear apodization technique preserves lower side lobes level than traditional apodization techniques. This method has been applied and verified with an actual SAR image.
2
1.2 Motivation for thesis
Some applications require that the sidelobes do not exceed an assigned level below the peak. In SAR systems images are always accompanied with sidelobes that severely distort the images. Both linear and non-linear apodization techniques can be used to reduce sidelobes level. In UWB SAR system linear apodization techniques can reduce the sidelobes level with the expense of the image resolution.
Nonlinear apodization techniques can reduce the sidelobes while preserving the image resolution. But it may be difficult to find what the relation between the original image and apodized image is. Moreover, non-linear apodization is not efficient for some cases. More than two weighting
functions are required for nonlinear apodization in UWB SAR imaging owing to non-rectangular spectrum and difficulty to preferring weighting functions. For Dual or Complex Duel Apodization apodization (CDA), it is very hard to choose appropriate weighting functions. It is not possible to find any optimal weighting functions for all SAR image. One optimal function that is appropriate for one SAR image can be inappropriate for other SAR images. However, Spatially Variant
Apodization (SVA) is not efficient for UWB SAR image processing due to it operates well only on rectangular spectrum of SAR images. Furthermore, Tri and Multi apodization is efficient in UWB SAR imaging but they also provide loss in phase information.
Therefore, this thesis mainly investigate on linear apodization technique in UWB SAR system that how it suppresses the sidelobes and preserves the image resolution. However, there is not much research done on linear apodization techniques in UWB SAR systems.
1.3 Thesis outline
Chapter 2 gives an overview of the radar technology which includes its design, how does it
transmit and receive signal, different types of radar, basic equation for radar.
Chapter 3 provides brief description of Synthetic Aperture Radar (SAR). This chapter represents
how a SAR system works and formation of synthetic aperture. Background of SAR, SAR geometry and modes of SAR; all basic concepts of SAR are described here. It gives extensive idea of SAR image resolution and applications. This information will facilitate readers to understand the basic terminology of SAR image processing.
Chapter 4 covers signal processing theory that is necessary for SAR image processing. Moreover,
an overview of the features of various popular SAR image processing algorithms is presented.
Chapter 5 focuses on apodization techniques which are the main part of this thesis. Both linear and
non linear apodization techniques of SAR image processing are descried. Also an Impulse response function (IRF) is stated for Ultra wideband (UWB) SAR image quality measurements.
3
Chapter 6 provides MATLAB simulation results by implementing a new linear weighting function
in real SAR data.
Chapter 7 concludes the thesis work with some suggestions for future work.
4
5
Chapter 2
Basics of Radar Engineering
Radar is an acronym for Radio Detection and Ranging. A radar system has one transmitter and one receiver. The transmitter emits radio waves and receiver collects signals that are reflected back from terrain or flying objects. Radar utilizes reflected electromagnetic energy to detect existence, elevation, range, angular position, speed and direction of the target. Radar acquires information about target from the characteristics of echo signal from reflecting targets. Through sensing the angle of the arrived echo signal, radar can detect the target’s angular position with a narrow beam directive antenna.
Due to the Doppler effect, the moving target e.g. aircrafts make a frequency shift in returned echo signal which create possibility to distinguish desired moving object from undesired stationary objects e.g. ground or ocean clutter [2]. Radar can detect some characteristics of a target e.g. size and shape by adequate high resolution. It is possible to get radar resolution in angle or range or both. Large antenna is needed for good angle resolution; on the other hand large bandwidth is needed for good range resolution. If relative motion exists between the particular part of a target and radar, the intrinsic resolution in Doppler frequency can be used to determining the cross-range dimensions. SAR azimuth resolution for imaging a sight such as land can be clarified as being as a result of Doppler bandwidth; however SAR is typically thought of as producing large synthetic antenna by preserving received signal in memory.
As a Radar system produces its own illumination, it can take image during both day and night, even a Radar system capable to acquire image in all weather as radio waves remain almost unaffected by clouds. For these individualities radar is developed to use in World WAR II for tracking ships and aircrafts. The first application of radar was in military to trace the ground, sea and air targets. Then it is widely used today for aviation, weather–forecasting and geological purpose.
Radar functions for instance in the microwave region of the electromagnetic spectrum, over the frequency interval from 10 to 40 GHz and it extends later into the higher frequency end of the broadcast region.
6
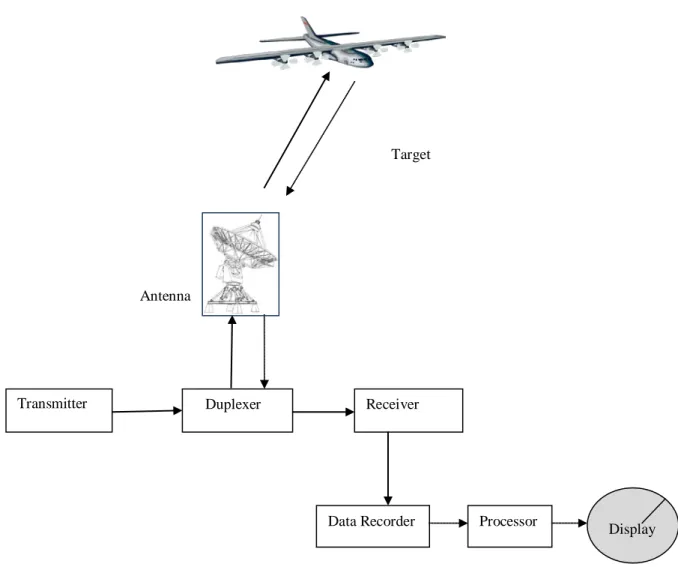
2.1 Radar Principals
A basic radar system includes a transmitter, antenna, switch, data recorder, output display and processor. The transmitter continuously emits pulses to a duplexer which switches the antenna between the transmitter and receiver. When pulse transmitting has finished, the duplexer switches control to the receiver so that antenna can receive echo signals. After having received the signals, to transmit another signal the duplexer transfer control to the transmitter again. Between the transmitter and receiver the duplexer may toggle control about 1000 times per second. This frequency for toggle however depends strongly on system operating frequency.
Target
Antenna
Figure 2. 1: Basic radar diagram
Subsequently received signals are sent from receiver to a data recorder for storing data. Afterward, the data should be processed into a format suitable for the end-user.
Processor Receiver Duplexer Transmitter Display Data Recorder
7
2.2 Radar classifications
Radar system may be split into different classes. Airborne, ground based, ship based or spacebone radars is a common such set of classes. It can be categorized on the base of some particular characteristics such as waveforms and frequency bands used. According to the functionality, radar can be divided as fire control, climate, exploration, over the horizon, acquisition, direction finding, track while scan, territory avoidance and territory following radar systems. Phased array radar is known as multifunction or multimode radars and use phased array antennas [5].
There are two types of Radar regarding to waveforms, as for instance Pulsed Radars (PR) and Continuous wave (CW). CW radars constantly transmit electromagnetic energy and utilize either modulated or unmodulated waveforms. The transmitting and receiving antenna of CW radar is separate. At the same time it broadcasts and receives signal, so it relies upon the Doppler frequency shift which is generated from a moving object to spilt the weak echo signal from a strong broadcasted signal. Usually CW radar can identify objects, find out the arrival track of received signal and determine their radial velocity from Doppler shift [6]. However, it normally cannot calculate range. For detecting the target range, we need additional complex waveform.
PR is another type of radar which is used to determine range or speed. PR utilizes a sequence of pulse waveforms. PR exploits frequency modulated or pulse modulated waveforms. It can be classified on the basis of Pulse Repetition Frequency (PRF) which is the number of pulses transmitted per second [7]. Low PRF, high PRF and medium PRF are the classification of PRF. Another two broad categories of PR are Moving Target Indication (MTI) radar and Pulse Doppler radar which uses Doppler shift. By sensing Doppler frequency shift MTI radar can separate moving objects from stationary background. To prevent range ambiguity, low PRF is used by MTI. Since the radar beam is scanned, the low PRF decreases the total number of hits per objects and it decreases the detectability of radar. Like MTI radar, the Pulse Doppler radar uses Doppler shift of echo signal for eliminating clutter (reflection from background recognized as clutter) in order to identify a moving airplane. But to prevent blind speeds it utilizes high PRF and it causes unambiguities in the measurement of the radial velocity. Moreover, operating with high PRF makes range measurement ambiguous [8].
Sometimes radars are also classified in accordance with the architecture of the system regarding to the geometry of the transmitter and receiver. There are different types of radar systems monostatic, bistatic and multistatic. In monostatic radar, the same antenna transmits and receives. Conversely, in bistatic radar the transmitter and receiver are separated. Multistatic radar consists at least three apparatus, e.g. two transmitters and one receiver or one transmitter and two receivers or multiple transmitters and multiple receivers.
8
2.3 Radar Frequency Bands
By radiating EM energy and using the echo spread out from a target can be recognized as radar. Radar systems can operate at frequencies from a few MHz of the spectrum. Letter designation of table 2.1 represents common frequency band at which radar operates, used by all radar engineers. Universally these radar bands are utilized in radar and they officially established as a standard by the Institute of Electrical and Electronics Engineers (IEEE). For the purpose of secrecy throughout World War II the unique code letters (P, L, S, X, and K) were launched. But it remains same later on.
Table 2.1: Radar Frequency Bands [7] [2] Band Name(Letter
code)
Frequency range(MHz) EW Letter Band(New Band Designator)(MHz) Wave Length Range HF 3 – 30 A 10-100 m VHF 30 – 300 A<250; B>250 1-10 m UHF 300 - 1000 B<500; C>500 30-100 cm L 1000 - 2000 D 15-30 cm S 2000 - 4000 E<3000; F>3000 7.5-25 cm C 4000 - 8000 G<6000; H>6000 3.75-7.5 cm X 8000 - 12000 I<10000; J>10000 2.5-3.75 cm Ku 12000 - 18000 J 1.67-2.5 cm K 18000 - 27000 J<20000; K>20000 1.11-1.67 cm Ka 27000 - 40000 K 0.75-1.11 cm V 40000 - 75000 L<60000; M>60000 4.0-7.5 mm W 75000 - 110000 M>60000 2.7-4.0 mm Mm 110000-300000 M>60000 1.0-2.7 mm UWB 1600–10500 18.75 cm – 2.8 cm
For indentifying targets behind the horizon, High Frequency (HF) radars used the EM wave’s characteristic of reflection from ionosphere. Perimeter and Acquisition Radar (PAR), Ballistic Missile Early Warning System (BMEWS) which employed for searching and tracking monopulse radar (operates at 245 MHz) used Very High Frequency (VHF) and Ultra High Frequency (UHF) bands. L-band radars are used for air traffic control and long range military search operations. Mainly ship and ground based medium range radars used S-band e.g. the Airport Surveillance Radar (ASR) which employed to control air traffic [8]. Metric instrumentation radar, fire control in military radar, weather detection radar and medium range search radar utilized C-band. X-band is used in military multimode airborne radars where antenna size is limited. Ku band SAR is used in military and planetary mapping. Since K and Ka band experienced atmospheric attenuation, these bands used for limited application like short range terrain avoidance, police traffic radar etc. Experimental radar system and extremely short range Radio Frequency (RF) hunters are utilized millimeter Wave (mmW) radars [3].
9 .
2.4 Radar Equation and Resolution Calculation
A radar system sends and collects electromagnetic waves to recognize range and speed of objects. While the signal is received, the receiver should record the time to measure the range of a distant target that is reflected by a radar signal. This is the time used for the radio frequency wave to propagate to target and return to the antenna. R, the target range is calculated by evaluating time delay denoted as ∆𝑡, time for traveling two way route between object and radar [3].
𝑅 = 𝐶 ∆𝑡
2 (2.1)
where the factor of 1
2 is used for time delay of two way, ∆𝑡 is in seconds and R is in meters.
The total power Pr returning to the receiving antenna is specified by following radar equation [9]
𝑃𝑟 = 𝑃𝑡𝐺𝑡𝐴𝑟𝜎𝐹4
(4𝜋)2𝑅𝑡2𝑅𝑟2 (2.2) where 𝑅𝑟 is the distance between target to the receiver, 𝑅𝑡 is the distance from sender to target, F is the pattern propagation factor, 𝜎 is the radar cross section of target which usually depends strongly on aspect angle, 𝐴𝑟 is the effective aperture of receiving antenna, 𝐺𝑡 is the gain of antenna and 𝑃𝑡 is the transmitting power. Hence, the larger time the target is illuminated; the more energy will be returned to the receiver. In monostatic radar, the transmitter and receiver are at the same place, 𝑅𝑟=𝑅𝑡 and the term 𝑅𝑡2 𝑅𝑟2 can be replaced by 𝑅4, here R denotes the range, the radar equation is reduced to
𝑃𝑟 = 𝑃𝑡𝐺𝑡𝐴𝑟𝜎𝐹4
(4𝜋)2𝑅4
(2.3)
The range resolution of all radar systems is directly related to pulse bandwidth and independent of the altitude of the platform. If the entrance time of foremost edge of the echo from far point follows the arrival time of the trailing edge of the echo from the closer point, every point can be distinguished in the time history of the radar echo [10]. Thus, the range resolution of radar is, 𝑅𝑟= 𝑐 𝜏2𝜌 (2.4)
where c speed of light and 𝜏𝜌 pulse length. The ground range resolution is,
𝑅𝑔 = 2𝑠𝑖𝑛𝜃𝑐 𝜏𝜌 (2.5)
where 𝜃 is the aspect angle. By the increase of bandwidth, range resolution can be increased. The azimuth resolution is [11],
10
where H is the altitude of antenna above the surface, λ is the wave length of the radiation. Azimuth resolution can be increased by reducing the aspect angle 𝜃, the wavelength λ and altitude H and also increasing the antenna length L.
By applying advanced signal-processing and constructing synthetic aperture, a SAR system utilizes the phase and magnitude information to improve the azimuth ground resolution of real aperture radar (RAR).
11
Chapter 3
Synthetic Aperture Radar
Remote sensing has drastically gained importance and is now a key part in current research for its huge scope in imaging the ground surface including hydrology, features and lithology. Active and passive are two types of remote sensing for imaging ground surface. In passive external sources of light or radio waves are used. But in active remote sensing, energy is produced inside the sensor system and for imaging measure the reflection of this energy.
SAR is a coherent active microwave method for imaging. With a sequence of microwave energy pulses, SAR system form imagery by SAR processing. After accurately SAR processing the reflected received radio waves, according to the Doppler frequency shift and time delay of pulse echoes, the energy is redirected to the data processor to form a ground image.
In 1951, Carl Wiley of Goodyear Aerospace discovered that there was possibility to get better resolution than supplied by antenna beam. He revealed that to get finer resolution than the size of the antenna footprint the motion of the platform can be used. Then in 1965 he patented "Pulsed Doppler Radar Methods and Apparatus". By implementing this, the resolution by SAR system was immensely increased comparing with real aperture radar. The progress has continued and CARABAS-II is the SAR system with best resolution regarding wavelength.
In real aperture imaging, the ground resolution relies on the size of the microwave beam of the antenna. Precise details on the earth can be settled by employing a narrow beam. The beam would be narrow if the antenna length is large i.e. the beam width is inversely proportional to the antenna’s size. Large antenna with short wavelengths of the transmitted signal can give high resolution. To attain high resolution images, it is required to consider antenna size and wavelength. By simply changing the transmitted signal’s frequency, the wavelength can be varied.
The basic mechanism of SAR is to transmit pulses and storing reflected echoes and merge echoes by proper algorithms.
12
3.1 How does SAR works
The main part of a SAR system is shown in Figure 3.1. According to the desired range resolution, a pulse generation unit produces pulses with specified bandwidth. Sender will amplify the pulses and through a circulator transferred to an antenna. After getting the output signal (returned echoes of scene) from antenna the receiver amplifies them at a desired level and a bandpass filter is applied. The SAR processors begin to determine SAR image after demodulation and A/D conversion of the signal. Motion measurement system provides the additional motion information. Operation sequence is arranged by the control unit, specifically the time schedule.
Figure 3. 1: System Block Diagram
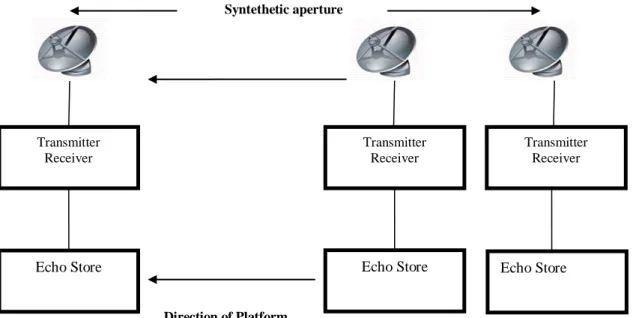
Forward motion of real antenna is utilized to synthesize a very long antenna. Pulse is transmitted at each position; the reflected back echoes pass through the receiver and then stored these recorded echoes in the storage. The difference of Doppler frequency for every point on the earth is
distinctive signature. SAR processing engages matching the Doppler frequency variation and demodulating by adjusting the frequency variation in the return echoes from each point on the ground [12]. We obtained image with high resolution after matched filtering. Length of synthetic aperture is shown in Figure 3.2.
Transmitter Pulse generation Motion Mesaurment Sensor Antenna SAR Processor Radar control Receiver A/D Conversion
13
Figure 3. 2: Synthetic Aperture
3.2 SAR system
This subsection presents historical SAR systems and up to the current state-of-art.
NASA Jet Propulsion Laboratory (JPL) built a polarimetric airborne SAR system which used L- band frequency. It was loaded on CV-990 aircraft system [13]. In 1985, AIRSAR was developed that includes all the features of the previous L-band CV-990 SAR and it also used P-band, C-band [14]. Young University developed YSAR which light weight and low cost comparing other SAR systems [15]. Canada Centre for Remote Sensing built CCRS C/X- SAR a (CCRS) which is multi-polarization and multi-frequency airborne SAR [16].
Several spaceborne and airborne SAR systems are developed for research institute, private industry and government agency. Twin-Otter SAR was designed by Sandia National Laboratories which used four bands including Ku band, Ka band, VHF/UHF and X band [17]. Environmental Research Institute of Michigan (ERIMM) developed interferometry SAR system with single polarization (HH) [18]. Electromagnetic Institute of the Technical University of Demark developed a single polarization C-band Danish SAR system [19]. Intera Technologies of Calgary operated STAR-1 and STAR-2 that are commercial airborne SAR systems [20].
NASA, the Italian Space Agency (ASI) and the German Space Agency (DARA, nowadays DLR) developed Shuttle Imaging Synthetic Aperture Radar (SIR) which operated in multi-frequency with multi polarization [21]. Japanese first earth remote sensing SAR launched in February 1992, Japanese Earth Resources Satellite-1 (JERS-1) which is an L-band, HH polarization SAR system. All these SAR systems are developed for scientific purposes [22].
Transmitter Receiver Transmitter Receiver Transmitter Receiver
Echo Store Echo Store Echo Store
Syntethetic aperture
Direction of Platform motion
14
In July 1991, European Space Agency developed European Earth Remote Sensing Satellite (ERS-1) which is a C- band, single polarization SAR system [23]. Swedish Defence Research Agency (FOI) developed CARABAS-II SAR system which is operates in VHF band from 20 to 90 MHz. It is a unique system to provide information on concealed targets under foliage or camouflage. The SAR system LORA, operated in the UHF band (200 to 800 MHz) is capable to detect moving target, used as a generic research tools both in civil and military applications for instance forest mapping [24]. Another recent developed SAR system is P-3, uses frequency band VHF and UHF (215 – 900 MHz) with 515 MHz bandwidth. PAMIR operated in X- band with a high simultaneous 1820 MHz bandwidth and BoomSAR which is ground based system in 50 – 1200 MHz.
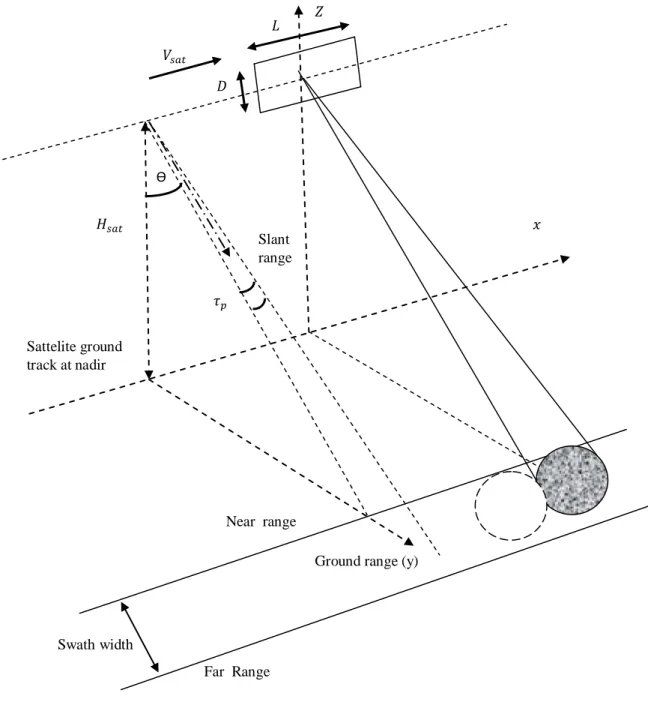
3.3 SAR geometry
The purpose of this section is to understand basic terminologies about synthetic aperture radar. Monostatic SAR data acquisition is quite similar with radar data acquisition when the transmitter and receiver are co-located. From the Figure 3.3, we can get the concept of a SAR imaging system. Range, the distance between antenna and target of the ground surface. Ground range is the distance between the flight path and point target. Slant range is the shortest line of sight distance between radar and the target. The direction parallel to the radar flight path is known as Azimuth (or along-track). Nadir is the point directly below the radar and azimuth direction occasionally referred as nadir-track.
The SAR system is mounted on a platform that is moving at high 𝐻𝑠𝑎𝑡 with a constant velocity Vsat. As illustrated in Figure 3.3, the antenna is looking at the look angle 𝜃 and continuously transmits radio pulsed of 𝜏𝑝duration at a rate identified by PRF. The height of antenna is D and length is L. The part of ground where the radar focuses is known as Swath. Near range is the edge of the swath which is near to the nadir track and the distant edge from nadir-track is the far range.
15 Swath width
Far Range
Ground range (y) Near range Sattelite ground track at nadir Slant range 𝜏𝑝 Ɵ 𝐷 𝐿 𝑍 𝑉𝑠𝑎𝑡 𝑥 𝐻𝑠𝑎𝑡
16
Figure 3.4 illustrated integration angle which is measured by the lines drawn from two end points of the flight path joining the point target. We can calculate synthetic aperture length from the integration angle.
Figure 3. 4: Integration angle
3.4 Modes of SAR
Stripmapping, scanSAR, spotlight, polarimetric, interferometry and squint modes are the common data acquisition modes for SAR. In stripmap mode, the antenna pointing direction is fixed with the radar platform moves. In this mode, azimuth resolution depends on the antenna pattern. To increase the resolution the spotlight mode can be used [25].
During a stripmap SAR operation, the system is inadequate to a narrow swath. This limitation can be overcome by operating scanSAR mode. In spaceborne SAR, usually scanSAR is used to increase width of swath. A wide swath can be attained by utilizing an antenna beam that is electronically steerable in elevation. In scanSAR mode, the radar operation time is divided between two or more individual sub-swath and achieves full image coverage in each [26].
Integration Angle Aspect Angle Aspect Angle Aperture length Point target
17
Figure 3. 5: Three different SAR methods: Stripmap, scan and spotlight [1].
Using the same physical antenna the spotlight mode provides fine resolution image than stripmap mode but involves complex hardware and processing algorithm. It gives competent imaging of several scenes and during a single pulse it also gives opportunity of capturing a scene at various viewing angle [26]. Squint mode needs powerful computation hardware design and used in military aircraft. Interferometry mode SAR is the recent technology which has ability to measure height of terrain and producing image with three dimensions.
.
3.5 SAR Resolution
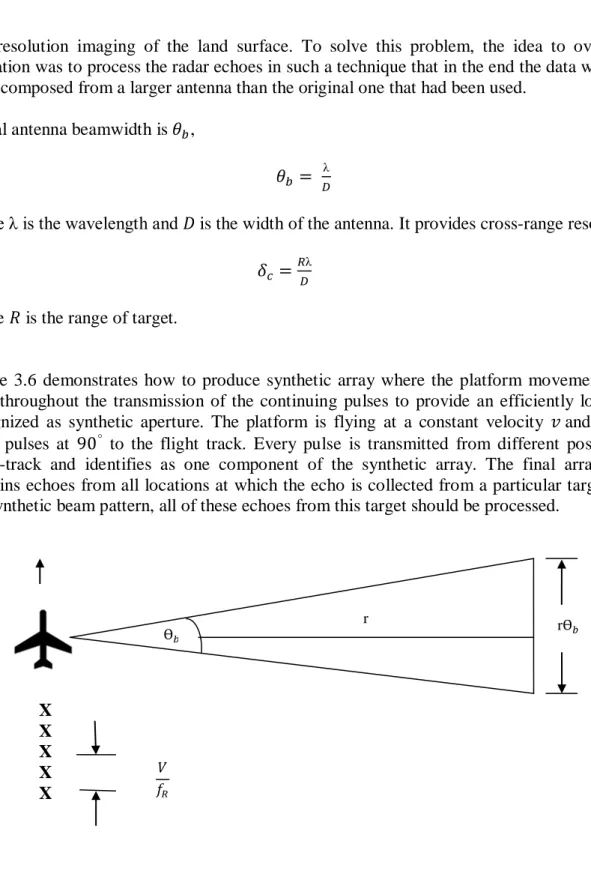
Resolution is an important characteristic of SAR image which is identified in terms of the minimum distance at which two closely spaced scatters of identical strength may be determined. It is essential to get good resolution across the radar beam (cross-range) and along the beam (range resolution) to attain fine resolution images of the terrain. The very long synthetic aperture antenna in SAR gives good resolution in the azimuth direction. The SAR resolution in azimuth is about one-half of the antenna length [27]. By using radar antenna with very narrow efficient beamwidth, high cross-range resolution can be achieved. To achieve this, physically a very large antenna is required. In practically it is not possible to carry an extremely large antenna which is necessary for
18
fine resolution imaging of the land surface. To solve this problem, the idea to overcome this limitation was to process the radar echoes in such a technique that in the end the data would appear to be composed from a larger antenna than the original one that had been used.
In real antenna beamwidth is 𝜃𝑏,
𝜃𝑏 = 𝐷λ (3.1)
where λ is the wavelength and 𝐷 is the width of the antenna. It provides cross-range resolution 𝛿𝑐, 𝛿𝑐 =𝑅λ𝐷 (3.2)
where 𝑅 is the range of target.
Figure 3.6 demonstrates how to produce synthetic array where the platform movement would be used throughout the transmission of the continuing pulses to provide an efficiently long antenna, recognized as synthetic aperture. The platform is flying at a constant velocity 𝑣 and transmitted radar pulses at 90° to the flight track. Every pulse is transmitted from different position on the flight-track and identifies as one component of the synthetic array. The final array of pulses contains echoes from all locations at which the echo is collected from a particular target. To form the synthetic beam pattern, all of these echoes from this target should be processed.
Figure 3. 6: Synthetic array formation r Ɵ𝑏 rƟ𝑏 X X X X X 𝑉 𝑓𝑅
19
The beamwidth of synthetic aperture is
𝜃𝑎𝑟 =2𝐿λ𝑎𝑟 (3.4)
where 𝐿𝑎𝑟 is the length of the synthetic array. Therefore, from the synthetic array the achievable cross-range resolution is specified as,
𝜑𝑐 =2𝐿𝑅λ𝑎𝑟 (3.5)
Since 𝐿𝑎𝑟 is estimated by distance along the flight-track to the specific target is in beam of antenna. Thus, it can be written as,
𝐿𝑎𝑟 = 𝑅 𝜃𝑏 (3.6)
Since 𝜃𝑏 = λ
𝐷 , the cross-range resolution can be illustrated as [28],
𝛿𝑐 =𝐷2 (3.7)
and it is independent of range. Owing to much higher cross-range resolution, SAR provides more suitable imaging comparing with traditional radar.
3.6 Applications of SAR
Synthetic Aperture Radar (SAR) provides possibility to survey ground and space for both military and civilian users. SAR has capabilities of capturing image both day and night with high resolutions it can even penetrate into materials, thus making it a powerful instrument for researcher. Moreover in remote sensing context, SAR is comparatively more independent as wavelength or sensor altitude does not make any effect in its geometric resolution.
SAR has a wide range of potential earth-science related applications. SAR has huge research potential for urban settlement and inhabitant’s analysis, investigate urban land utilization and expose the socio-economic condition of urban people [29]. SAR is used for ice monitoring at high latitudes to investigate ice concentration for navigation in frozen ocean.
SAR military applications include battlefields inspection, intelligence gathering and weapons supervision. SAR is also used for oceanography (Skoelv and Wahl 1994), topographic mapping, oil spill monitoring (Hovland, Digranes and Johannessen 1994), geology and mining (Taylor and Lynne 1986), agricultural taxonomy and evaluation, aquatic ice monitoring (Kwok, Drinkwater and Rignot 1990), ground utilize monitoring and terrestrial or celestial survey (Carrara, Majewski and Goodman 1995a). NASA has employed SAR systems in different operations including the Magellan mission to Venus, JPL’s SEASAT oceanographic satellite and the Apollo 17 lunar mission [30].
20
21
Chapter 4
Fundamental of Signal Processing for SAR System
4.1 Chirp Signal
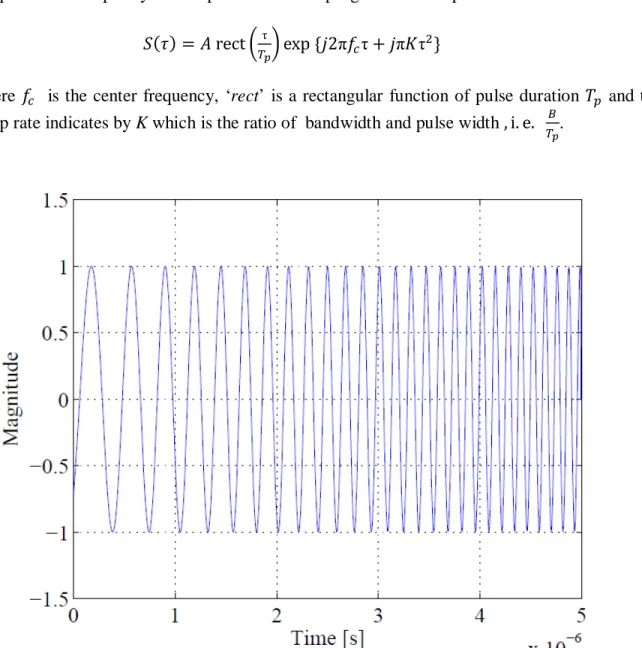
A chirp is a signal in which frequency increases or decreases with time. For some certain features it also known as Linear FM signal, it is like noise of a chirping bird. Chirp signal processing technique is known as CHIRP technique; here CHIRP stands for ‘Compressed High Intensity Radar Pulse’. It can be produced descending order (down-chirp) and ascending order (up-chirp). Chirp signal can be classified as exponential or linear. Generally, radar used up-chirped or linear chirp to retain simplicity. The expression for chirp signal is in complex form:
𝑆(𝜏) = 𝐴 rect �τ
𝑇𝑝� exp {𝑗2π𝑓𝑐τ + 𝑗π𝐾τ
2} (4.1)
where 𝑓𝑐 is the center frequency, ‘rect’ is a rectangular function of pulse duration 𝑇𝑝 and time 𝜏, chirp rate indicates by K which is the ratio of bandwidth and pulse width , i. e. 𝐵
𝑇𝑝.
22
Figure 4. 2: Spectrum of Chirp signal
For fine resolution SAR systems the linear FM or chirp waveform is a good choice. It is illustrated by
𝑝(𝑡) = cos �2𝜋 �𝑓𝑐𝑡 +𝛾𝑡2
2 ��, for |t| ≤ 𝑇𝑝
2 (4.2)
where 𝑇𝑝 is the pulse length, 𝑓𝑐 is the carrier frequency and 𝛾 is the chirp rate. Its phase is a quadratic function of time and frequency is a linear function of time which is varying at a rate 𝛾.
4.2 UWB SAR
In 1990 the Defense Advanced Research Project Agency (DARPA) defined UWB as “Ultra wideband radar is any radar whose fractional bandwidth is greater than 0.25, regardless of center frequency or the signal time-bandwidth product” [11]. For large fractional bandwidth it can acquire high resolution images but it requires large integration angle to obtain good resolution in azimuth also.
23
UWB has the capabilities of positioning and location detection within a few centimeters which leads it to recent research interest. It has great potential in Military applications for tracing enemy behind wall and around the place of the battle ground. UWB radar imaging has very important applications in GPR (Ground penetration Radar) and Surveillance system. The low frequency UWB SAR can detect objects hidden by ground surface or foliage and provide finer resolution images [31].
UWB SAR systems utilize a wide beam antenna and large fractional bandwidth. UWB SAR has been used by military to identify and categorize objects in special conditions using the capabilities of foliage penetration (FOPEN) or in ground penetration (GPEN).
4.3 SAR Doppler History
It is named after an Australian physicist Christian Doppler in 1984. The relative movement of the observer or sources changes in the frequency of an electromagnetic or sound wave is defined as Doppler-effect. When the source and observer moves toward and then moves away, it will make effect in change of wave frequency. The total Doppler effect results from motion of the source and motion of the observer.
In a SAR system, the satellite moves to our place or moves away from our place which makes a change in frequency is known as Doppler Effect. The frequency of Doppler-effect will increase while the satellite moves to us and the frequency will decrease as the satellite go away from our location.
Due to the Doppler-effect, the frequency of the return signal is bigger than the transmit signal because an object has relative velocity to the antenna in front of the beam. The frequency of return signal reduced due to the relative velocity goes away from the antenna when the object is located in the backside of antenna beam. There is no relative velocity between the antenna and the ground, when the object moves to the centre of the beam due to the forward motion of the platform, and as a result no change in frequency of the signal will found while the object is in the centre of the beam. The frequency of the return signal will be less and there will be a relative velocity away from the antenna. Consequently, the frequency of the return signal of a particular object on the ground changes over the period and the change is different for objects separated in the azimuth direction. For objects that do not move, there is no improvement with more antennas.
24
Figure 4. 3: Diagram of the effect of Doppler shift on the returned frequency
4.4 Pulse compression
A pulse compression technique is used to obtain better average transmitted power and concurrently to acquire wide bandwidth for fine range resolution. It broadcasts phase modulated waveform such as chirp.
Pulse compression utilizes matched filter for compressing the energy in a certain signal into a relative narrow pulse. Since the average transmitted power is related to the receiver Signal to Noise Ratio (SNR), the width of pulse need to increase whereas concurrently preserving sufficient range resolution also. It is possible by using pulse compression technique. Although maintaining the range resolution related to a short pulse, Pulse compression permits using low average transmit power of a comparatively long pulse.
The pulse compression ratio (PCR) can be represented by
PCR=𝑇𝑝𝐵 ≈ 𝛾𝑇𝑝2 (4.3) where 𝑇𝑝 is the pulse length, 𝛾 is the chirp rate and the pulse bandwidth B is equal to the change of rate of frequency multiplied by the length of pulse, i.e. 𝐵 ≈ 𝛾𝑇𝑝.
Antenna Velocity
F-f
F
F
F
F
F+f
25
The PCR is equivalent to the time-bandwidth product of the broadcasted pulse and correspond to the enhancement in resolution by pulse compression. Pulse compression techniques offer the accessibility of higher average power which helps to overcome the associated sensitivity difficulty by means of the narrow pulse system.
4.5 Matched Filtering
The transfer function or impulse response of a matched filter can be resolved by a signal in a technique which will provide the highest possible signal to noise ratio (SNR). With regard to some known signal, Matched filtering is the method of correlating a signal. Usually in a SAR system, the output of the matched filter is obtained by using convolution operation [32]. Correlation is similar to convolution with small difference. Here one of the signals is time reversed conjugate also. In a radar system, the received and transmitted signal will be the same with shifted in time. Due to the reflection, the signal is also reversed. For this reason, in SAR data analysis convolution is used [33].
The signal 𝑠(𝜏) is convoluted with matched filter 𝑚(𝜏) which contains the properties (phase) of desired signal.
The pulse compressed radar signal is given in Eq. 4.5, 𝑆(𝜏) = 𝑒−𝑖2𝜋(∅0+𝑓𝑐(𝜏−𝜏𝑑)+𝑘(𝜏−𝜏𝑑)2), 𝜏 ∈ �−𝑇𝑃
2 + 𝑇𝑑, 𝑇𝑃
2 + 𝑇𝑑� (4.4)
The matched filter 𝑚(𝜏), 𝑚(𝜏) = 𝑠∗(−𝜏 + 𝑇
𝑑) = 𝑒−𝑖2𝜋(∅0−𝑓𝑐𝜏+𝑘𝜏2), 𝜏 ∈ �−𝑇2𝑃,𝑇2𝑃� (4.5)
Figure 4. 4: Plot of rect corresponding to signal
|s|
𝜏
26
Figure 4. 5: Plot of rect corresponding to matched filter
The pulse compressed signal 𝑠𝑚𝑓 (𝜏) as Eq.3 is the convolution of 𝑆(𝜏) and 𝑚(𝜏). 𝑠𝑝𝑐 (𝜏) = ∫ 𝑒−𝑖2𝜋(∅0+𝑓𝑐(𝑡,−𝜏𝑑)+𝑘(𝑡,−𝜏𝑑)2)𝑒𝑖2𝜋(∅0−𝑓𝑐(𝜏−𝑡,)+𝑘(𝜏−𝑡,)2). rect �𝑡 ,−𝜏𝑑 𝑇𝑃 � rect � 𝜏−𝑡, 𝑇𝑃� ∞ −∞ 𝑑𝑡, (4.6) In Eq. 4.7 the integral is written in a shorter form by using substitution given in Eq. 4.8.
𝑠𝑝𝑐 (𝜏) = ∫ 𝐼. rect �𝑡 ,−𝜏𝑑 𝑇𝑃 � rect � 𝜏−𝑡, 𝑇𝑃 � ∞ −∞ 𝑑𝑡, (4.7) where 𝐼 = 𝑒−𝑖2𝜋(∅0+𝑓𝑐(𝑡,−𝜏𝑑)+𝑘(𝑡,−𝜏𝑑)2)𝑒𝑖2𝜋(∅0−𝑓𝑐(𝜏−𝑡,)+𝑘(𝜏−𝑡,)2) (4.8) The rect functions are evaluated In Eq. 4.9 and the integral is put into four cases.
and 𝑠𝑝𝑐 (𝜏) = ⎩ ⎪ ⎪ ⎨ ⎪ ⎪ ⎧ 0 𝑓𝑜𝑟 𝜏 − 𝜏𝑑 < −𝑇𝑝 ∫𝜏+Tp2 𝐼𝑑𝑡, 𝜏𝑑+−Tp2 for − 𝑇𝑝< 𝜏 − 𝜏𝑑 < 0 ∫𝜏𝑑+Tp2 𝐼𝑑𝑡, 𝜏−Tp2 for 0 < 𝜏 − 𝜏𝑑 < 𝑇𝑝 0 𝑓𝑜𝑟 𝜏 − 𝜏𝑑 > 𝑇𝑝 (4.9) In Eq. 4.10 two above mentioned integrals which are on the form ∫ 𝐼𝑑𝑡𝑏𝑎 , are solved by using substitution form of Eq. 4.8,
𝑠𝑚𝑓 (𝜏) = � 𝑒−𝑖2𝜋�∅0+𝑓𝑐(𝑡,−𝜏𝑑)+𝑘(𝑡,−𝜏𝑑)2� b a 𝑒𝑖2𝜋�∅0−𝑓𝑐(𝜏−𝑡,)+𝑘(𝜏−𝑡,)2� = 𝑒 −𝑖2𝜋(𝜏𝑑−𝜏)�−𝑓𝑐+𝑘�𝜏𝑑+𝜏−(𝑎+𝑏)�� 𝑖𝜋4𝑘(𝜏𝑑− 𝜏) . 2𝑗𝑠𝑖𝑛(2𝑘𝜋(𝜏𝑑− 𝜏)(𝑏 − 𝑎)) = (𝑏 − 𝑎)𝑒−𝑖2𝜋(𝜏𝑑−𝜏)�−𝑓𝑐+𝑘�𝜏𝑑+𝜏−(𝑎+𝑏)��. 𝑠𝑖𝑛𝑐(2𝑘𝜋(𝜏 𝑑− 𝜏)(𝑏 − 𝑎)) (4.10) |𝑚| −𝑇𝑝 2 � 𝑇𝑝 2 �
27
If we set 𝑏 = 𝜏𝑑+Tp
2 and 𝑎 = 𝜏 + −Tp
2 in Eq. 4.10 for − 𝑇𝑝 < 𝜏 − 𝜏𝑑 < 0, then it becomes:
= ��𝜏𝑑+𝑇2𝑃� − �𝜏 −−𝑇2𝑃��. 𝑒 −𝑖2𝜋(𝜏𝑑−𝜏)�−𝑓𝑐+𝑘�𝜏𝑑+𝜏−��𝜏−−𝑇𝑃2 �+�𝜏𝑑+𝑇𝑃2���� . 𝑠𝑖𝑛𝑐 �2𝑘𝜋(𝜏𝑑− 𝜏) ��𝜏𝑑+𝑇2 � − �𝜏 +𝑃 −𝑇2 ��𝑃 � = (𝜏𝑑− 𝜏 + 𝑇𝑃)𝑒𝑖2𝜋(𝜏𝑑−𝜏)𝑓𝑐. 𝑠𝑖𝑛𝑐�2𝑘𝜋(𝜏𝑑− 𝜏)(𝜏𝑑− 𝜏 + 𝑇𝑃)� (4.11) Now, set 𝑏 = 𝜏 +Tp 2 and 𝑎 = 𝜏𝑑− Tp
2 in Eq. 4.10 for − 𝑇𝑝 < 𝜏 − 𝜏𝑑 < 𝑇𝑃, then it becomes:
= ��𝜏𝑑+𝑇2𝑃� − �𝜏 −𝑇2𝑃��. 𝑒
−𝑖2𝜋(𝜏𝑑−𝜏)�−𝑓𝑐+𝑘�𝜏𝑑+𝜏−��𝜏𝑑−𝑇𝑃2�+�𝜏+𝑇𝑃2����
. 𝑠𝑖𝑛𝑐 �2𝑘𝜋(𝜏𝑑 − 𝜏) ��𝜏𝑑+𝑇2 � − �𝜏 −𝑃 𝑇2 ��𝑃 �
= (𝜏𝑑− 𝜏 + 𝑇𝑃)𝑒𝑖2𝜋(𝜏𝑑−𝜏)𝑓𝑐. 𝑠𝑖𝑛𝑐�2𝑘𝜋(𝜏𝑑− 𝜏)(𝜏𝑑− 𝜏 + 𝑇𝑃)� (4.12)
After combining (4.11) and (4.12), we get the following formula for the pulse compressed signal in the range−𝑇𝑝 < 𝜏 − 𝜏𝑑 < 𝑇𝑃,
𝑠𝑝𝑐 (𝜏) = (𝑇𝑃− |𝜏𝑑 − 𝜏|)𝑒𝑖2𝜋(𝜏𝑑−𝜏)𝑓𝑐. 𝑠𝑖𝑛𝑐�2𝑘𝜋(𝜏𝑑− 𝜏)(𝑇𝑃− |𝜏𝑑− 𝜏|)� (4.13)
And after rewriting the sinc part of the expression, the final expression becomes [33],
𝑠𝑝𝑐 (𝜏) = 𝑇𝑃�1 −|𝜏𝑑𝑇−𝜏|𝑃 � 𝑒𝑖2𝜋(𝜏𝑑−𝜏)𝑓𝑐. 𝑠𝑖𝑛𝑐 �2𝑘𝜋𝑇𝑃(𝜏𝑑− 𝜏) �1 −|𝜏𝑑𝑇−𝜏|𝑃 ��
for |𝜏𝑑 − 𝜏| < 𝑇𝑃 0,
28
4.6 SAR Image Formation Algorithms
SAR raw data is just the collected radar reflections during flight. Depending on system this more or less corresponds to a smeared out image with all objects smeared out as hyperbolas. Image processing algorithms are employed to process this spread out data into a focused image. Algorithms are selected according to their precision and competence. Depending on integration angle, SAR systems can handle huge amount of data. Sometimes a very precise algorithm might become ineffective in terms of processing time while an extremely fast algorithm can generate reduced image resolution.
Image processing algorithms are categorized into two groups; time domain and frequency domain algorithms. Time domain methods are also known as backprojection methods. By using two dimensional Fourier transforms, it is very easy to convert signal or data from time domain to frequency domain. Since frequency domain algorithms attempt to decrease the processing load and generate high quality imagery for non wide band (WB) SAR system. UWB SAR requires large integration times which induces frequency domain algorithm unsuitable for good quality imaging. For UWB SAR system time domain algorithm provides good result as they are capable of motion compensation to handle with large integration times. Time domain methods are based on backprojection principle [34]. Each signal is back projected onto the image plane according to their direction vector. All the way through that direction similar value is allocated and this procedure is continued for each sample and summary represents the desired imagery. This method is known as Global Backprojection (GBP) algorithm and utilized extensively in SAR image formation [35]. But it has drawback, its comput ation cost is high as it needs huge number of operation to obtain an image. Several time-domain algorithms are designed to overcome the drawback of the GBP, such as Local Backprojection (LBP) [2] and Fast Backprojection (FBP).
Frequency domain algorithms perform by employing Fast Fourier transform (FFT) method. Using complex multiplications or interpolation in frequency domain, these algorithms attempt to cancel out Doppler frequency effect. Chirp Scaling Algorithm (CSA), Range-Doppler Algorithm (RDA), Polar Format Algorithm (PFA) and Range Migration Algorithm (RMA) [36] are mostly used in SAR system. Unlike CSA, other frequency domain algorithm involves interpolation. For SAR systems RDA is the first designed algorithm and by performing azimuth FFT process SAR data is transferred to range Doppler domain. Unlike RDA and CSA, RMA is capable to work with wide integration angle and maintaining all phase information.
Frequency domain algorithms are efficient for linear aperture, but they are not good for non-linear aperture whereas in time domain algorithm motion compensation execute involuntarily for non-linear aperture and obtain same image quality for non-non-linear and non-linear aperture. Several time domain algorithms have no image size limitation, e.g. GBP while frequency domain algorithm requires huge computer memory for process and accumulate large data. In reality both domain algorithm contains different characteristics according to processing time and quality of image. The appropriate algorithm can be selected based on platform parameters, integration angle and threshold for suitable resolution.
29
4.7 Apodization Techniques
Apodization technique is a sidelobe suppression method which utilizes one or several weighting functions to achieve the optimum combination of sidelobe levels and mainlobe resolution. This thesis paper mainly focuses on different apodization techniques in SAR images and introduces a new weighting function which has possibility to be a good candidate for sidelobe reduction in SAR imagery.
The shape of the spectrum of a SAR image can create high intensity sidelobes and can be spread out low intensity in the images. Some applications of SAR desire certain limited sidelobes level. By using parametric windows we can decrease sidelobes but it reduces the image resolution. In this case apodization techniques that are non-linear can be used to suppress sidelobes whereas preserving the image resolution. Both linear and non-linear apodization technique can be used for suppressing sidelobes.
30
31
Chapter 5
Apodization Techniques for UWB SAR image processing
With the immense growth of spaceborne and airbone SAR technique, how to improve resolution of SAR images is one of the recent research interest. After applying Conventional FT based image reconstruction techniques in SAR and inverse SAR (ISAR) image, it gives limited resolution. Besides traditional SAR image processing system involves a 2-D Fourier transform that can generate significant high intensity sidelobes. Apodization technique introduces in SAR imaging to suppress the amplitude s of sidelobes of images.
General apodization technique is to implement two dimensional weighting functions to the spectrum of SAR images. This technique is known as rectangular approximation. After applying this technique in narrowbeam and narrow band SAR image, it induces only orthogonal sidelobes. But in UWB SAR imaging it induces orthogonal and non-orthogonal sidelobes. Employing two dimensional weighting functions in SAR image spectrum all the time faces loss in resolution. In case of narrowbeam and narrowband SAR where the spectrum is approximated to a rectangular area, the loss in spatial resolution usually acceptable, but for UWB SAR images this loss in resolution is very expensive.
Figure 5. 1: Implementing Rectangular window in wave domain 𝜃0 𝐾𝑟, 𝑚𝑖𝑛 𝛿𝑥 𝛿𝑐 𝑠𝑖𝑛𝜃20 𝐾𝑟 𝐾𝑐 ∆𝐾𝑟 W(𝐾𝑥, 𝐾𝑟) 𝐾𝑟,𝑚𝑎𝑥
32
The radar frequency ѡ, 𝑐 is speed of light, range wave number 𝑘𝑟 and the azimuth wave number 𝑘𝑥 are related together as [37]
ѡ =𝑐
2 �𝑘𝑟2 + 𝑘𝑥2 (5.1)
and ∆𝐾𝑟 = 𝐾𝑟, 𝑚𝑎𝑥 − 𝐾𝑟, 𝑚𝑖𝑛
Figure 5. 2: SAR spectrum in wavedomain
In Figure 5.2, 𝐾𝑐 and 𝜑0 are centre wavelength and integration angle of a SAR system. 𝐾𝑚𝑖𝑛 and 𝐾𝑚𝑎𝑥 are the wavenumbers corresponding the lowest and highest signal frequencies. The signal
bandwidth 𝐵𝑟 can be illustrated as [38],
𝐵𝑟= (𝐾𝑚𝑎𝑥 − 𝐾𝑚𝑖𝑛)/𝐾𝑐 (5.2)
In this paper, we apply window not only in azimuth and slant range direction but also in angular direction that is quite new. After applying window in angular direction, we observe that it efficiently suppresses sidelobe level and also reserves image resolution.
To implement non-linear apodization in UWB SAR, we should be careful to choose weighting functions to optimize the loss of image resolution. It is critical to choose weighting function for applying non-linear apodization technique in UWB SAR imaging. It can loss the phase information also. 𝐾𝑦 𝐾𝑚𝑎𝑥 𝐾𝑦′ 𝐾𝑐 𝜑′ 𝐾𝑥′ 𝐾𝑚𝑖𝑛 𝐾𝑥 𝐾𝑟′ 𝜑0
33
Impulse Response Function (IRF) is strongly related with measurements of SAR image resolution and evaluation of the quality of SAR images is mentioned in [39]. Generally two dimensional sinc function (𝑠𝑖𝑛(𝑥)� ) is utilized as IRF in SAR image formation which is gained from rectangular 𝑥 estimation for two dimensional SAR spectrum. On the basis of flat spectrum, 𝐻(𝐾𝑥, 𝐾𝑟) can be illustrated as 𝐻(𝐾𝑥, 𝐾𝑟) ≈ � 1 𝐾𝑥,𝑚𝑖𝑛 ≤ 𝐾𝑥 ≤ 𝐾𝑥,𝑚𝑎𝑥 𝐾𝑥,𝑚𝑖𝑛 ≤ 𝐾𝑥 ≤ 𝐾𝑥,𝑚𝑎𝑥 0 𝑒𝑙𝑠𝑒𝑤ℎ𝑒𝑟𝑒 (5.3)
The two dimensional Inverse Fourier Transform (IFT) of spectrum 𝐻(𝐾𝑥, 𝐾𝑟) can be written as [40].
ℎ(𝑥, 𝑟) = ∫ ∫ 𝐻(𝐾−∞+∞ −∞+∞ 𝑥, 𝐾𝑟). 𝑒𝑖(𝐾𝑥𝑥+𝐾𝑟𝑟)𝑑𝐾𝑥𝑑𝐾𝑟 (5.4)
In [39] demonstrates a two dimensional sinc function which is approximated from equation (5.3) for IRF SAR in both range and azimuth directions.
ℎ(𝑥, 𝑟) ≈ 𝑠𝑖𝑛𝑐 �𝑘𝑟,𝑐𝑥𝑠𝑖𝑛𝜃20� . 𝑠𝑖𝑛𝑐(𝑘𝑟,𝑚𝑎𝑥−𝑘2 𝑟,𝑚𝑖𝑛 𝑟) (5.5)
where 𝜃0 is an integration angle and 𝑘𝑟,𝑐 is the centre wave number. This function is applicable for NB SAR system. The maximum integration angle, bandwidth respectively 𝜃 ≤ 10° and 𝐵𝑟 ≥ 0.2 are suitable for NB SAR [38]. For wide integration angle (𝜃 ≈ 110°) and large bandwidth ( 𝐵𝑟≈ 1.1) this sinc function cannot be applicable.
A new IRF SAR is illustrated in [39],
ℎ(𝑣𝑡, 𝜑𝑡, 𝐵𝑟, 𝜃0) =𝑒 −𝑖𝜑𝑡 𝑣𝑡 � 𝑖𝑛ℎ1,𝑛−1(𝑣𝑡,𝐵𝑟) 𝑒𝑖(𝑛−1)𝜑𝑡 𝑠𝑖𝑛𝑐 �𝑛𝜃20�� + 𝑒−𝑖𝜑𝑡 𝑣𝑡 ℎ2(𝑣𝑡, 𝜑𝑡, 𝐵𝑟, 𝜃0) (5.6) where ℎ1,𝑛−1(𝑣𝑡, 𝐵𝑟) = −(1 +𝐵2𝑟) 𝐽𝑛−1 [𝑣𝑡(1 +𝐵2𝑟)] + (1 −𝐵2𝑟) 𝐽𝑛−1[𝑣𝑡(1 −𝐵2𝑟)] (5.7)
34 ℎ2(𝑣𝑡, 𝜑𝑡, 𝐵𝑟, 𝜃0) = −𝐵𝑟𝑠𝑖𝑛𝑐 �𝐵2 𝑣𝑟 𝑡𝑐𝑜𝑠 �𝜃2 + 𝜑0 𝑡�� 𝑒𝑖𝑣𝑡cos�𝜃 0 2 +𝜑𝑡�−𝑖𝜃20 + 𝐵𝑟𝑠𝑖𝑛𝑐 �𝐵2𝑟𝑣𝑡𝑐𝑜𝑠 �𝜃20− 𝜑𝑡�� 𝑒𝑖𝑣𝑡cos� 𝜃0 2−𝜑𝑡�+𝑖𝜃02
(5.8) The derived IRF SAR (5.5) is applicable for UWB IRF SAR system. This approximation is also suitable for NB SAR. However, by this approximation we can evaluate mainlobe areas of several SAR systems to estimate Peak Sidelobe Ratio (PSLR) and Integrated Sidelobe Ratio (ISLR) in order to asses SAR image quality.
5.1 Linear Apodization
Linear Apodization technique can suppress the Impulse Response (IPR) sidelobes but it also increases the main lobe width that involves with image resolution loss. In this technique amplitude weighting functions are implemented in frequency domain prior to the final Fourier transform needed to accurately focus the SAR images.
The classic linear weighting functions e.g. Hamming, Hanning, Blackman, Taylor etc. are implemented to SAR data to reduce the IPR sidelobes. It increases the IPR mainlobe width which leads to decrease the resolution of image. Comparing to unweight data Hanning window suppresses sidelobes at the expense of doubling the mainlobe width. The loss of resolution depends on which weighting function is used. In many applications of NB SAR, this resolution loss is acceptable but for UWB SAR imaging this loss is very high. The resolution loss in azimuth direction is more than range direction [40].
Some popular window function is illustrated here. Rectangular is the simplest window (5.9) which takes large amount of without any alteration and it directs to discontinuities at the end points.
𝑤𝑟𝑒𝑐(𝑛) = 1 (5.9)
The hamming window is extensively used in many applications e.g. speech processing. Hamming weighting function can diminish sidelobes intensity but it also degraded mainlobe resolution. This window has shape of
𝑤ℎ𝑚(𝑛) = �0.54 − 0.46 cos � 2𝜋𝑛
𝑀 � 0 ≤ 𝑛 ≤ 𝑀
35
The hanning window
𝑤ℎ𝑛(𝑛) = � 0.5(1 − cos � 2𝜋𝑛
𝑁−1� ) 0 ≤ 𝑛 ≤ 𝑀
0 𝑒𝑙𝑠𝑒 (5.11)
The blackman window
𝑤𝑏𝑙𝑘(𝑛) = �𝑎0− 𝑎1cos � 2𝜋𝑛 𝑁−1� + 𝑎2cos � 4𝜋𝑛 𝑁−1� 0 ≤ 𝑛 ≤ 𝑀 0 𝑒𝑙𝑠𝑒 (5.12) where 𝑎0 = 1−𝛼 2 , 𝑎1 = 1 2, 𝑎2 = 𝛼 2 and 𝛼 = 0.16
The kaiser window provides better sidelobes reduction and achieved high image resolution in some cases compared with SVA [41]. This window can be expressed
𝑤𝑘(𝑛) = �
𝐼0�𝛽�1−[(𝑛−𝑀2)/(𝑀/2�]2)0.5�
𝐼0(𝛽)
0 𝑒𝑙𝑠𝑒0 ≤ 𝑛 ≤ 𝑀 (5.13) Where 𝐼0 is the zero order Bessel function and 𝛽 is a tuning parameter which estimates the ‘mainlobe width – sidelobe peak’ tradeoff.
5.2 Non-linear Apodization
Non-linear apodization technique reduces the sidelobes without degrading the resolution of image. Spatially Variant Apodization (SVA), Complex Duel Apodization and Dual-Apodization and multi-apodization are effective non-linear apodization technique which suppresses the sidelobes without loss of spatial resolution image [42]. S. DeGraaf developed another nonlinear apodization method named Adaptive Sidelobe Reduction (ASR). As this method is the combination of non linear operator and linear apodization method, it can be employed for UWB SAR imaging [36]. Nonlinear operators make possible to preserve the range and azimuth resolution.
For Dual apodization weighted and unweighted SAR image are used correspondingly. In DA apodization to retain the unique phase information, it is required to collect the complex value from this couple of images on a pixel-by-pixel basis which has minimum magnitude. To find the complex values the weighted and unweighted pair of SAR images should investigate in real (I or in-phase) and imaginary (Q or quadrature) parts separately. If the real part values from the pair of
36
SAR images have opposite sign for sinc IPR, then the real part of SAR image would be zero which construe as intermediate weighting function, else we have to choose value of imaginary part and it would be minimum absolute value. This technique is known as CDA, as both I and Q components are considered here. In one dimensional SAR imaging CDA gives lower sidelobes than DA while in two dimensional imaging CDA is not effective for sidelobes reductions [42].
If three or more weighting functions are used in apodization, then it is called with Tri or Multi apodization technique. SVA (cosine-on-pedestal) used dynamic weighting functions and is very easy for estimation. It preserves clutter surface of unweighted image and resolution of mainlobe whereas also remove sidelobes from uniformly weighted SAR data. The weighting function of SVA is:
𝑊(𝑛) = 1 + 2𝑤𝑐𝑜𝑠(2𝜋𝑛
𝑁) (5.14)
The weighting factor 𝑤 can have values from 0 (i.e. Rectangle) to 0.5 (i.e. Hanning) [43].
5.3 SAR Image Quality Measurements
A SAR image quality measurement is an important issue that has been investigated from the beginning of the SAR design process. BAE SYSTEMS Advanced Technology Centre (BSATC) [39], ESA [44] [45], DLR [43], Alaska Satellite Facility (ASF) [46] etc. have manufactured image quality analysis software and used to calibrate NB SAR system. Most of these methods have focused on point target estimation or analyze quality parameters that are not possible to obtain from SAR image from itself [47]. For point target assessment Impulse Response function (IRF) is used to analysis the point target. Spatial resolution, Integrated Side Lobe Ratio (ISLR) and Peak Side Lobe Ratio (PSLR) are the parameters associated with SAR response to a point target. In Figure 5.3 𝐼𝑠 is sidelobe and 𝐼𝑚 is mainlobe.
37
Figure 5. 3: IRF and point target assessment parameters
According to [29] the familiar technique for image quality measurement is to divide the SAR image of a point target into sidelobes and mainlobe areas which is surrounded with rectangles of different dimensions. For determining SAR image quality parameters the collected integrated energy and peak value inside these areas are used.
For UWB SAR these methods can provide inaccurate SAR image quality measurements. As UWB SAR are all the time related with large integration time to maintain azimuth focusing , the UWB image quality should be determine at various integration angles [34]. Besides PSLR, ISLR and spatial resolution another parameter i.e. Differential Resolution (DRES) which need to consider for UWB SAR system mentioned in [34]
∆𝑑𝑥 = ∆𝑥−∆𝑥,𝑟𝑒𝑓∆𝑎,𝑟𝑒𝑓𝑎 (5.15) ∆𝑑𝑟 = ∆𝑟−∆𝑟,𝑟𝑒𝑓∆𝑟,𝑟𝑒𝑓 (5.16) Where ∆𝑑𝑥 and ∆𝑑𝑟 are the measured resolution in azimuth and range direction respectively. In [10] resolution equation, ∆𝑥, 𝑟𝑒𝑓𝑥 and ∆𝑟, 𝑟𝑒𝑓 are presented as references. Using these parameters it is feasible to assess the performance of CARABAS-II concerning SAR image quality.
To obtain accurate image quality measurement, the sidelobes and mainlobe are delimited by a concentric ellipse and ellipse respectively instead of rectangular area in UWB SAR system [34].
Spatial Resolution Side Lobe Main Lobe 3 dB 𝐼𝑠 𝐼𝑚 h(t) Azimuth or range
38
This page intentionally contains only this sentence.
![Table 2.1: Radar Frequency Bands [7] [2]](https://thumb-eu.123doks.com/thumbv2/5dokorg/5471376.142367/18.918.93.829.457.800/table-radar-frequency-bands.webp)


![Figure 3. 5: Three different SAR methods: Stripmap, scan and spotlight [1].](https://thumb-eu.123doks.com/thumbv2/5dokorg/5471376.142367/27.918.124.773.90.465/figure-different-sar-methods-stripmap-scan-spotlight.webp)