Nr 86- 1933
Statens väg- och trafikinStitut (vT1) -0581. 01 Linköping. ,
.
-Swedish Road and Traffic Research Institute ', S-581 01Linköping ' Sweden__ _ '_ombmedeffectofnolse,mirasound
andVibrationon
driverperformance
_ ' _ byUlfSandberg
" '
f___._l':,:Repr1ntfromthe1983InternationalConferenceonNo1seControlEngmeermg VV ' i » i
'.';(INTERNOISE83)m EdmburghGreatBr1ta1n13ISIuly1983Proceedlngs.
Nr 86 ' 1983
86
Statens väg- och trafikinstitut (VTI) 0 581 01 Linköping
Swedish Road and Traffic Research Institute ' S-581 01 Linköping 0 Sweden
Combined effect of noise, infrasound
and vibration on driver performance
by Ulf Sandberg
Reprint from the 1983 International Conference on Noise Control Engineering (INTEE-NOISE 83) in Edinburgh, Great Britain, 13 15 Iuly 1983. Proceedings, Volume 2, pages 887-890.
'! :[ J 4." .: . a, . . ' ' 3 :... l» _ ";q -'b __ '- J .. oi . . . »: ' x.. " v 3 :a'. ') ' . | ' .) | ' . I " ' ' ne'- ." 'k - A :.!" - .. " - 9!" . '\ l.. v).. .-. t.'*.':*...»- I'M,. .s.J'
it -,. 3
EDINBURGH
9 gal ,;
13 15JULY1983
La . 551 B LI , L3, __'. z ?
ALL aCOMBINED EFFECT OF NOISE, INFRASOUND AND VIBRATION ON DRIVER PERFORMANCE
Ulf Sandberg
National Swedish Road and Traffic Research Institute, 5-581 OI Linköping,
Sweden.
IMPORTANCE OF REALISTIC EXPOSURE AND TASKS IN A SIMULATOR STUDY A question with great impact on traffic safety is whether the acoustical exposure of drivers in road vehicles is detrimental to driving performance or not.
The interesting frequency range is approximately 2-20000 Hz, where the acoustical exposure generally is named infrasound below 20 Hz and noise (or
sound) above 20 Hz. In modern road vehicles the driving noise level generally is in the range 65-80 dB(A). The sound pressure level (Lin weighting), however, mostly
is 90 115 dB at frequencies below 20 Hz, 1 e in the infrasound range. Physically related to the acoustical exposure is the seat vibration exposure which typically is
in the range 0,2-I m/s2 on modern, paved roads.
Investigations on the influence of the above-mentioned environmental factors
have, so far, either used higher exposure levels or considered only singular
exposure types not the combination of noise, infrasound and vibration which
occurs in the real world. Also, studies have almost exclusively been made in simulators where sometimes quite artifical exposures have been used and, mostly, the task has been completely artificial. Lastly, exposures long enough to represent the real world, seldom have been used.
It is of prime importance that both task and exposure conditions be realistic; as indicated in ref 1, where it is shown that the mental load and noise level interact
in its influence on driving performance. The experiment described here was
designed to fulfil the requirement of realism as well as possible. DESCRIPTION OF THE EXPERIMENT
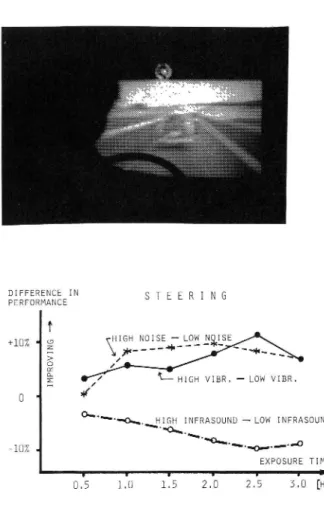
The study utilized a driving simulator in which the seat and all instrumentation imitated a bus driver's working place. A moving-road film which was laterally displaced corresponding to the steering of the driver was projected on a screen ahead of the driver (fig 1). Noise and vertical vibrations were produced to match both amplitude and spectra of measured bus environments. An infrasound signal was also added to simulate the extreme low end of the spectrum.
Ulf Sandberg
The driver's tasks were chosen as realistic as possible: his primary, continuous task was to steer the "bus" with the smallest possible lateral variation to
compensate for a random disturbance. Another primary task although not
continuous - was to break the "bus" at certain instants when a lamp was suddenly switched on. The secondary task was to keep the speed of the "bus" at a certain level. Most real highway driving has exactly these ingredients: To steer, to react fast (break) and to adjust the speed. The performance was measured as the RMS
steering deviation from an "ideal" lateral road position, the average reaction time
and the RMS speed deviation.
Two levels of noise (80 and 65 dB(A)), two levels of infrasound 12-16 Hz (110 and
80 dB) and two levels of vibration (1.0 and 0.3 m/s2 RMS) were combined. The low
levels were simulating the "best" bus environment found in a previous survey and the high levels were simulating typical "high-exposure" buses. An exposure time of 3 h was used, to simulate a boring long distance highway drive. The experiment was always started by a 0.5 h pre exposure test using the "low" exposure levels, continued with a 3 h exposure and ended with a post exposure test simular to the pre-test. 48 subjects (bus drivers) were participating in the experiments. Each subject had only one exposure, which meant that for each exposure group (8
combinations possible) we had 6 subjects.
RESULTS
For each subject, a normalization of all measurements was made to the results obtained in the pre exposure i e to each subject's non-exposed, "normal" perform ance. A variance analysis was run in which the independent variables were noise, infrasound, vibration and time. All possible combinations of these were tested against steering, breaking and speedholding performance. On the S% risk level the following significant results were obtained:
1. Steering and speedholding performance were impaired with time. However, as a result of the initial learning effect, the pre-exposure performance was some-what worse than during the main exposure. Interpretation: There is an initial learning effect, except for reaction time, which is more than counterbalanced by some fatigue effect during the exposure and the post exposure.
2. Increasing noise im roved the primary task performance, i e steering. When the
high level noise ceased (in the post exposure) performance decreased to the initial
level. In the secondary task, the decreased noise level led to an impaired speedholding in the post-exposure. Interpretation: Noise of the high level (80
dB(A)) has an arousal effect, which disappears soon after the exposure. The
arousal is, however, concentrated only on the primary task (fig 2).
3. An effect similar to that of noise is noticed for the vibrations, where the high level improves performance for the primary task (only). Interpretation: The same as for noise, i e an arousal effect on the primary task (fig 2).
4. A negative effect on performance is resulting from the high-level infrasound. It is noticed for all performance measures in the second half of the main exposure, although it is evident also in the first part for the primary task. It disappears in the post-exposure test where infrasound is low. Reaction time is increased 10-140/0
Noise and driver performance
after ca 1.5 h (fig 3). Interpretation: High infrasound impairs performance, especially after some time. A fatigue or drowsiness effect seems to be involved.
5. No interactions between noise and vibration were noticed.
6. An interaction between infrasound and vibrations was noticed only on the secondary task in the post-exposure. High-level vibrations improved a perform-ance which was impaired by infrasound.
7. Noise and infrasound interact on both the continuous tasks. Concerning the secondary task, the interaction is seen in both main and post exposure, while it is seen only in the second half of the main exposure for the primary task. The combination of high level infrasound and low level noise has a highly significant negative effect, while increasing noise eliminates this effect (fig #). High level noise appears to impair secondary performance.
8. Heart frequency decreased significantly with time but had only a weak relation with the exposure (the decrease with time was less when noise was high). 9. The subjects answered a questionnaire about their feelings during the experi ment. From this it appeared that the high-level noise group considered themsel-ves less drowsy than the low level noise group. On the other hand, those with low noise but high infrasound felt more drowsy than those with low infrasound.
10. The influence on TTS was also tested, although not reported here. Tests of diastolic and systolic blood pressure as well as adrenaline, noradrenaline and creatinine in the urine are not yet completed.
OVERALL CONCLUSION
Noise, infrasound and vibrations affect driver performance, at least at the exposures considered here. The influence of noise is to arouse the driver and concentrate his effort on the primary task (which improves) at some expense of the secondary task. A quite similar effect appears to arise from the vibrations considered here. Infrasound has a negative effect on performance, probably due to a fatigue or drowsiness effect after 1 2 hours of exposure. Noise and infrasound thus have opposite effects on performance, which sometimes may counterbalance each other. The arousal of noise may compensate for the drowsiness from infrasound. Masking of infrasound by noise may also be an important effect.
IMPLICATIONS
The effect of relatively high-level noise and vibrations on driver performance is more positive than negative in a long and relatively monotonous journey. Especi ally it may counteract an otherwise quite serious effect of high-level infrasound. The present trend towards lower noise levels (below ca 70 dB(A)) in road vehicles together with unaffected or even increased infrasound is not desired. A matched reduction of noise and infrasound is better.
REFERENCE
1. Finkelmann, J M; Zeitlin, L R; Filippi, CI A; Friend, M A: Noise and Driver Performance. Journal of Applied Psychology, 1977, Vol 62, No 6, 713 718.
Ulf Sandberg
EéEESE I EE N S T E E R 1 N G Fig la and lb (above). Part of the
driving simulator with its
"runn-T _ ing" road lm.
+10% . © HIGH NOISE -L0 _§ile
E ;|< -- """"' _
> . . . .
å ' L Fig 2 (left). Difference in steering
5 *,, HIGH VIBR' _ LOW BR" performance between the
high-0 ' level groups and the
correspond-o"~ ~0~.\H.I.CgLINFRASOUND LOW INFRASOUND ing low-level groups. The zero
10/ NEON _O level then equals the performance
_ 00 d ~.V -.
EXPOSURE TIME for the low level groups.
**
' I I l
0.5 1.0 1.5 2.0 2.5 3.0 [H]
CHANGE IN
REACTION TIME B R E A K I N G
Fig 3 (right). Difference in
re-action time (breaking) between 0 s - o YZe'Rb LEv EE1160705150005)_______
the high-level infrasound group and the low-level infrasound
group. The latter has been nor +0.05
-malized to zero level. 21+ sub jects in each group.
_) IM PR OV IN
INFRASOUND 1.0.10 EXPOSURE TIME _ 0.5 1.0 1.5 2.0 2.5 5.0 [H]**
DIFFERENCE IN S T E E R I N G PERFOQMANCE
"LN/ l __ EååHrmgå/IEÄUND Fig 4 (left). Interaction between
%
B"
"5.ij
xx
noise and infrasound as illustrated
0 g RX """-.a. "mm-an by the difference in steering
per-& LOW NOISE+LOW INFRASOUND HIFH REISESUNDHIGH I A formance_ _ between the groups
\\ With different exposures. The
LOW NOISE+\- zero level represents the non
1D%- HIGH INFRAsoum,x. /- ° exposed, normal performance inn ,, .
.\ _
v the pre exposure test.
EXPOSURE TImE__