metal oxides anchored on reduced graphene
oxide and their implementation as catalysts for
water oxidation
Shibbir Ahmed
Master’s Thesis 30 ECTS
Department of Physics, Umeå University
Supervisors
Dr. Thomas Wågberg Professor Dr. Guangzhi Hu
Associate Professor Guest Professor
Department of Physics Department of Physics
Umeå University Umeå University
Examiner
Dr. Xueen Jia
Researcher, Department of Physics
Umeå University
energy demand. In order to harvest energy directly from sunlight catalyst for oxygen reduction and evolution reaction are at the core of key renewable-energy technologies including fuel cells and water splitting. Herein, tungsten oxide-reduced graphene oxide (WO3-rGO), cobalt
oxide-reduced graphene oxide (Co3O4-rGO) and tungsten oxide-cobalt oxide-reduced graphene oxide
(WO3-Co3O4-rGO) nano-composites were synthesized via a facile, efficient, one-pot microwave
assisted method as an efficient electro-catalyst for water oxidation. The structural and chemical compositions of the produced nano-structures were investigated by Scanning Electron Microscopy (SEM), X-ray Photoelectron Spectroscopy (XPS), Raman Spectroscopy as well as thremogravimetric analysis. Catalytic performances of the engineered nano hybrids for the oxygen evolution reaction (OER) were evaluated using a standard three electrode system in 0.1 M KOH aqueous solution, with a coiled Pt wire as the counter electrode and an Ag/AgCl as the reference electrode. In the produced nano-composites, WO3 and Co3O4 nano-particles are
uniformly decorated on the reduced graphene oxide sheets without any agglomeration. The WO3-Co3O4-rGO hybrids afforded current density 1 mA/cm2 at 1.693 V vs RHE and the Co3O4
-rGO reached the current density 1 mA/cm2 at 1.769 V vs RHE regarding the catalytic performance for OER in alkaline solution. The over potential was significantly reduced by 76 mV after co-doping of WO3 with Co3O4-rGO nano hybrids. The WO3-Co3O4-rGO gives current
density 1 mA/cm2 at 1.658 V vs RHE. We also show that the over potential for oxygen evolution of the WO3-Co3O4-rGO was further reduced by illuminating the catalyst to visible light thus
manifesting the photo-catalytic properties of the hybrid catalyst.
Table of Contents
1. Introduction: ... 1
2. Theory: ... 4
3. Experimental: ... 8
3.1. Materials: ... 8
3.2 Graphene Oxide Synthesis: ... 9
3.3 Synthesis of Reduced Graphene Oxide: ... 9
3.4 Tungsten-rGO/Cobalt-rGO/Tungsten-Cobalt-rGO Synthesis Via Microwave Irradiation: 10 3.5 Making Transparent Film of WOx-rGO/CoxOy-rGO/WOx-CoxOy-rGO: ... 11
4. Characterization: ... 13
4.1 Structural characterization: ... 13
4.2 Electrochemical characterization: ... 13
4.3 Photo-electrochemical measurement: ... 14
5. Results and discussion: ... 15
5.1 Structural and morphological analysis: ... 15
5.2 Elemental composition analysis: ... 17
5.3 Catalytic performances: ... 25 5.4 Photo-catalytic performances: ... 27 5.5 Annealing effects: ... 28 6. Conclusion: ... 29 7. Outlook: ... 30 8. References: ... 31
1. Introduction:
Developing efficient methods to convert sunlight into clean and readily usable fuels such as hydrogen and methane on a large scale has long been a dream for researchers. [1] The major energy source today is carbon based fossil fuels. The energy consumption is increasing due to the world’s rising population and the higher average living standards. At the same time the availability of fossil fuel is proving inadequate to satisfy the huge demand. The increasing energy demand and the concurrent need to reduce the usage fossil fuel boost the research on renewable energy sources. The sun seems to be an eminent source of energy to overcome the present and future energy demand, because it is continuously irradiating approximately 120 PW of solar energy on the surface of the earth. [2] To date, through the utilization of photovoltaic (PV) technology only 1% of the total consumed energy comes from the solar energy. [2] Since the electrical photovoltaic power is not dispatchable, a complementary procedure is needed to transform the solar energy into a form of storable energy for later use.[2]
A photoelectrochemical (PEC) solar cell is a photo-induced water splitting device that absorbs solar energy and splits water into hydrogen (H2) and oxygen (O2) electrochemically.[3] Splitting
water into H2 and O2 by harvesting solar energy is an artificial photosynthesis that involves two
half-cell reactions, the oxygen evolution reaction (OER) and the hydrogen evolution reaction (HER).[2] Converting solar energy into molecular hydrogen is the most prevailing technique for making a clean fuel that can meet the future need as environmentally benign and renewable energy sources. However, to evolve H2 efficiently via the artificial photosynthesis in a viable
manner, it is important to first develop stable and effective catalytic system for water oxidation into molecular oxygen, which is the more challenging half reaction in the photo-induced water splitting. [4]
Since Fujishima and Honda reported a TiO2-based artificial photosynthesis system, metal oxide
semiconductors have become a promising resource of materials for water splitting applications.[1] Though TiO2 is not a very effective material in PEC applications due to its wide band-gap
(3.0-3.2 eV) which hinders its light harvesting efficiency in the visible range of the solar spectrum.[1] Various approaches such as 3d-metal doping, dye sensitization and quantum dots have been pursued to extend the TiO2 absorption into the visible range. All these approaches have been
materials drive world’s scientist to search further for alternative visible-light photosensitive and earth-abundant effective materials.[1]
OER has gained extensive attention owing to its vast applicability in the field of electrolysis cells and solar-to-fuel production. In spite of that, the overall efficiency of this system relies on the performance of oxygen evolution electrocatalyst.[5] Mostly, the higher anodic over potential of OER greatly constrains the conversion efficiency of the solar-to-fuel approach.[5] RuO2, IrO2 and
their combination of other metals are the latest OER catalyst based on rare earth metals. However, these catalysts may not be economically feasible due to their high cost and low availability.[6] Cheap multimetallic electro-catalysts, [7] [8] metal oxides, [9] [10] and anisotropic structure of M-Co, [11][12] (M = Ni, Fe, Mn, Zn, etc.) have been explored to overcome the above mentioned issues. Nonetheless, these catalysts are unable to offer better activity and stability by failure to keep the over potential in a tolerable low range. [7][8][11][12] Another challenging issue is to optimize the dispersion of these kind of materials on a highly conductive support. [13]
As an alternative to ruthenium and iron based electro-catalysts other metal oxide materials such as cobalt, nickel, manganese and much more ample and inexpensive materials for water oxidation have been examined.[4] The outcome of these studies have revealed that, among these abundant materials, cobalt oxides and the substituted cobaltites MxCoyO4 (M = many alkaline,
rare-earth cations and transition metal) show good OER performance.[4] Moreover, cobalt oxide spinel structures and Co3O4 have drawn special attention as potential anode materials for OER in
alkaline solution over the past decades.[4] Although, the extensive investigation on Co3O4 as an
electro-catalyst for water oxidation under alkaline conditions has showed that the disadvantage of strong causticity of alkaline condition limits its industrial applications.[4]
Recently, another potential unique material, WO3 has drawn the interest of researchers as a
suitable photoanode material in PEC architecture due to the following reasons.[1] Firstly, WO3
has sufficient band gap (≈ 2.6 eV), as a result allowing absorption of light in part of visible range of the solar spectrum.[1] Secondly, WO3 shows the theoretical maximum conversion efficiency (≈
6.3%) for photons having energy higher than 2.6 eV.[1] Thirdly, as compared to other semiconductor metal oxides, WO3 possesses excellent hole diffusion length (≈ 150 nm).[1] There
recombination in both bulk and surface and slow charge transfer at the semiconductor/electrolyte interface. That considerably limits its application as a potential photoanodes. [14]
In addition, nowadays different carbon allotropes including graphene, carbon nanotubes (CNTs), carbon nanofibers (CNFs), fullerene have been examined as OER electrocatalysts.[13] Though, as a catalyst the performance of the carbon materials alone are relatively low compared to the metal oxide decorated graphene. [13] Moreover, graphene has been proved as good catalyst support rather than as catalyst due to its large theoretical specific surface area and high intrinsic electron mobility, hence capable of supporting light absorption, charge transfer and electric conductivity.
[15]
To overcome the aforementioned shortcomings of Co3O4 and WO3 in catalytic performance, the
conductive characteristics of supporting materials play a potential role in sustaining catalytic activity. Recently engineered nano structures have been prepared by physical vapor deposition or annealing where Co3O4 catalysts supported on Au, Ni foam, graphene or mesoporous silica.[4]
The electrochemical performance for Co3O4 on various supports clearly indicates that these
hybrids are promising catalyst materials to develop robust, efficient, nano-sized catalyst for water oxidization in alkaline solution.[4] Wu et al.[15] reported that the incorporation of reduced graphene with WO3 nanoparticles or nanorods exhibits good photocatalytic performance.
Furthermore, Fu et al.[16] also produced WO3-reduced graphene nanocomposite with improved
phototcatalytic property via one-pot hydrothermal approach. They have achieved the best values in the photocurrent density for hydrothermally synthesized WO3-based PEC conversion.
However, most of the synthesis processes to produce hybrid nano-materials are complex and time consuming. Microwave synthesis process has been developed as an efficient technique to prepare engineered nano-materials.[17] Due to the higher reaction rates and shorter reaction times compared to other conventional heating system, microwave heating is becoming more and more popular.[17]
Motivated by the above mentioned ideas, in this thesis project I have aimed to produce WO3
-rGO, Co3O4-rGO and WO3-Co3O4-rGO nano structured electro catalyst for OER via a simple
one-pot microwave synthesis method and to investigate their catalytic behavior under light exposure. To date, many efforts have been devoted to prepare WO3-rGO and Co3O4-rGO;
of WO3-Co3O4-rGO. These hybrid materials demonstrate high catalytic performance and
chemical stability with a relatively low over potential for the OER under alkaline condition, considering that no noble metals are used in the catalysts and that the complete production can be performed in the ordinary kitchen microwave.
The anodes made by the WO3-Co3O4-rGO exhibits current density 1 mA cm2 at 1.693 V vs RHE.
The anodes made by the Co3O4-rGO afford current density 1mA/cm2 at 1.769 V vs RHE. Due to
the co-doping of WO3 with Co3O4 the over potential is thus reduced by 76 mV. The WO3-Co3O4
-rGO affords photo-current density 1 mA/cm2 at 1.658 V vs RHE for OER in alkaline condition. The over potential for oxygen evolution of the WO3-Co3O4-rGO was further reduced and the
yielded current density was increased when the catalyst was illuminated by visible light, manifesting the photo-catalytic properties of the hybrid catalyst. Even though these engineered materials do not display catalytic performance regarding the over potential that are in a line with state-of-the-art catalyst for water oxidation, the cost-effectiveness and availability of these materials make them potential candidates for up-scaled industrial applications. The structures and morphologies of the as-synthesized materials were characterized by scanning electron microscopy (SEM), X-ray photoelectron spectroscopy, and Raman spectroscopy as well as thermogravimetric analysis. Catalytic performances of these materials for OER were evaluated using a standard three electrode system, with a coiled Pt wire as the counter electrode and an Ag/AgCl as the reference electrode.
2. Theory:
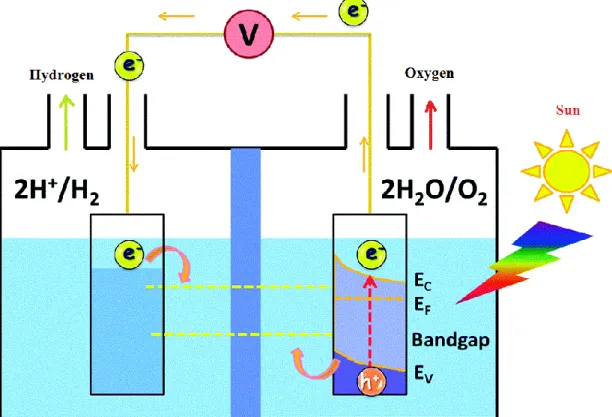
The conventional photoelectrochemical system (Fig. 1) for water splitting comprises two electrodes; the anode and the cathode. The anode is the photosensitive semiconducting materials-based electrode, on which light beam irradiate during the water splitting. The counter electrode is cathode, also called an auxiliary electrode and it is not irradiated by solar light. The photoactive material on the photoanode must absorb radiant light to raise its electrode potential higher than 1.23 V in order to make the water splitting reaction happen. The required energy to convert one molecule of H2O into 1/2O2 and H2 is 237.2 kJ mol-1 as the change in free energy (∆G), which
corresponds to an electrolysis cell voltage (∆Eº) of 1.23 V per electron transferred. As a result, O2 and protons (H+) can be produced by oxidizing the water molecules, as well as H+ can be
that in this thesis I have tested the required over potentials for water oxidation by implementing the hybrid materials first as electro-catalysts, since the setup is easier but yet the catalytic performance can be evaluated, before I finally tested also their photo-catalytic properties under visible light illumination.
Fig. 1 Schematic display of the basic mechanism of water splitting for PEC cells involves a hydrogen evolving cathode and an oxygen evolving photoanodes (n-type semiconductor).
When the solar spectrum with energy greater than the band gap of photoactive materials irradiate on the photoanodes, then electrons from valence band will be excited to conduction band, whereas the created holes stay at the valence band. To generate O2 on the photoanodes, a
photoinduced process has to produce four electron-hole pairs (Fig. 2) [18]
Fig. 2 Chemical reatcions in water splitting system. 4𝑂𝐻− → 𝑂
2+ 2𝐻2𝑂 + 4𝑒−
4𝐻++ 4𝑒− → 2𝐻 2
Band levels of the photoatcive materials are considered a crucial factor that generally influence the ability of water splitting. Because, water splitting process requires that the bottom level of the conduction band must be located at a more negative potential than the reduction potential of H+/H2, or the top of valance band should be more positive than the oxidation potential of
H2O/O2. [18] According to electrochemical principles, since the irradiation energy must be above
1.23 eV to drive the water splitting reaction forward, means that the energy of the light spectrum must be higher than the band gap in order to separate electrons and holes. In reality, the overpotential loss and the lowest thermodynamic energy requirement need at least 1.7-1.9eV for PEC water splitting.[18] Since the intensity of the solar spectrum dramatically falls off below 400 nm the upper limit of the photoactive materails band gap is determined to be 3.1eV. Thus, within the visible range of the solar spectrum the optimum value of the semiconductor band gap should ideally be somewhere between 1.9 and 3.1eV. [18]
Besides the energy gap, some others ctitical factors that also significantly affect the photoactivity of semiconductor materials are the charge separation, life time of the photo-generated electron-hole pairs and the charge mobility.[18] In order to improve the water-splitting reaction all these factors must be considered.
Electrochemical stability or resistance to photocorrosoin is another factor, which may constrain the usefulness of many photoctalytic materials during the water oxidation. In case of many nonoxide semiconcoductor materials, electron transfer through the interface between the semiconductor and electrolyte interface is hindred by either dissolution or the forming of thin films upon the semiconductor surface. It happens because of the photoinduced holes may sometime oxidize the semiconductor materials themselves rather than contributing to water oxidzation. The pH value of the electrolyte are commonly responsible for aforementoned unexpected photodecompositions in various photoactive materials and often limit their application under certain condition.
Oxide semiconductors are generally more stable, and they exhibit stable performance under many reaction conditions. [18] For instance, SnO2 and Ti2O are extremely stable over a wide
range of pH values aqueous conditions upon illumination. At the same time the stability of CdSe highly depends on some other things; pH values and the types of electrolyte. Due to the its corrosion in basic or neutral conditions the application of WO3 is mainly limited to acidic
elctrolyte.[19] Whereas the convetional transition metal oxide co-catalyst such as NiO or Co3O4 is
not appropraite. On the otherhand, it is notewirthy that if the transfer of carriers for water oxidation through the interface is faster than any competing reaction then the photocorrosion or anodic decomposition will be singnificatly inhibited.[18] Therefore, it is a critical issue for future utilizations to develop semiconductor materials with high stability against photocorrosion or anodic decompositon.
Graphene oxides (GO) are single layers of graphite, where different hydrophillic functional groups are attached. Fig. 3 displays a single GO sheet that contains hydrophillic carboxyl groups (red coloured) together with hyroxyl and epoxy groups (blue coloured). [20] [21] [22] . Due to the disruption of sp2 hybridization of graphene layers by the existing functional groups, GO is an electrical insulator. [23] Therefore, proper reduction of the GO is an important step in regaing desirebale electric properties of graphene. [23]
Fig. 3 Chemical struture of graphene oxide.[20][21][22]
GO flakes can be reduced to rGO via different methods,[24] such as thermals[25], chemical[26] [27]
[28]
as well as electrochemical reduction [29][30]. Among them, the chemical reduction is the most widely used method due to its applicability in both acidic and alkaline media.[24] Different reductants, for instance hydrazine[31] , dimethylhydrazine[32], hydroquinone [33], NaBH4 [34] and
Na2S [35] are used in chemical reduction methods. The disadvantages of the chemical reduction
methods are that the reactions are very slow and some of the used reductants are very much hazardous.[36] Recently, the redcution of GO has been investigated in different alternative ways
such as in alkaline condition[37], ultraviolet-assisted method [38] and thermal redcution method
[39]
where no hazardous reductants are used.[36] However, this method needs a rapid heating (>2000 °C min−1) either up to 1050 °C in an oven under argon gas or up to 800 °C under the presence of hydrogen gas. Study report has been revealed where microwave assisted heating system was utilized to study the possiblity of thermal redution of the as-prepared GO.[36]
3. Experimental:
3.1. Materials: 1. Graphite (200 mesh, 74µm) 2. Sulfuric acid (H2SO4 ,97%) 3. Potassium persulfate (K2S2O8) 4. Phosphorus pentoxide (P2O5)5. Sodium nitrate (NaNO3)
6. Hydrogen peroxide (H2O2, 30%)
7. Hydrochloric acid (HCl, 37%) 8. Potassium permanganate (KMnO4)
9. Tungsten hexacarbonyl (W(CO)6)
10. Cobalt carbonyl (Co2(CO)8)
11. Sodium sulfide (Na2S)
12. Disdtilled water (H2O, DI)
13. Acetone 14. Ethanol 15. Nafion
16. Carbon fiber paper
17. Fluorine doped tin oxide glass (FTO) 18. Glassy carbon
19. Nickel foam
20. Potasium hydroxide (0.1M KOH)
3.2 Graphene Oxide Synthesis: GO was synthesized using the improved Hummer’s
method. 4 g of graphite (200 mesh, 74 µm sized) were collocated into a round flask, afterwards 21 ml H2SO4 (97%) were added cautiously (approximately 0.5ml per second). Additionally, 3.3
g of K2S2O8 and 3.3 g of P2O5 were also added into the flask. This whole mixture was placed into
an oil bath and heated up to 80 ºC, the temperature was kept constant for 4.5 hours and the suspension was mixed by magnetic stirring. After 4.5 hours, the flask was removed from the oil bath, and then 650 ml of DI were added into this mixture, finally the suspension was left overnight. Next day, the excess of liquid was removed from the sediment, which consists of pre-oxidized graphite. The sediment was collected and washed with plenty of water to remove the acids and other residues. The washed sediment was filtered using a 1µm pore size Teflon filter paper. After filtration, the wet pre-oxidized graphite paste was dried completely at 80 ºC under ambient conditions. This synthesis step is denominated ‘‘pre-oxidization step’’ and it has been performed to decrease the graphite flakes sizes.
Now 2 g of pre-oxidized graphite and 2 g of NaNO3 were mixed together in a round flask and
placed in an ice bath. Then 80 ml of H2SO4 (97%) were slowly added, followed by 10 g of
potassium permanganate. The whole mixture was kept in an ice bath for 4 hours under magnetic stirring. Afterwards, the mixture was collocated onto an oil bath at 35 ºC for 2 hours with magnetic stirring. At this stage, the color of the mixture became green. After two hours, the flask was removed from the oil bath, and subsequently 80 ml of DI were slowly added under magnetic stirring. In this step, the mixture started bubbling and turned into brownish color. Then the whole mixture was again placed in the oil bath for 1 hour at 98 ºC with magnetic stirring. After one hour, the flask was again removed from the oil bath, and 200 ml of DI were added with it with magnetic stirring. To continue the further oxidation, 42 ml of H2O2 were added to this mixture
with magnetic stirring. Then whole suspension mixture was washed with an acidic solution (730 ml DI + 270 ml HCl) and left overnight. The next day, the precipitated graphene was collected by removing the liquid part from the top, and washed with water and ethanol several times. Finally the sample was dried at 60 ºC under ambient conditions.
3.3 Synthesis of Reduced Graphene Oxide: 100 mg GO were mixed with 100 ml of DI.
The solution was stirred by magnetic stirrer (Fig. 4 step-II) for one hour to break the big chunk of GO. Then this solution was sonicated (Fig. 4 step-II) for one and half hour to produce a good
dispersion. Later, 300 of mg Na2S were mixed with 5 ml DI and sonicated for 2-3 minutes to
dissolve them into water perfectly. The Na2S solution was finally mixed with GO suspension and
shaked strongly. Then, the whole mixture was kept in the oven at 95 ºC for 6 hours (Fig. 4 step-III). After 6 hours, the newly produced three dimensional structure of reduced graphene was taken out from the oven. This reduced graphene oxide was washed 6 times (Fig. 4 step-IV) with water and acetone in order to remove the unwanted byproducts. Each time of washing reduced graphene oxide was collected by centrifugation (7000 rmp).
3.4 Tungsten-rGO/Cobalt-rGO/Tungsten-Cobalt-rGO Synthesis Via Microwave Irradiation: Three clean bottles were used; and 100 mg of rGO (washed) were put into each of
them. 100 mg of tungsten hexacarbonyl were mixed with 4 ml of acetone and sonicated for 2-3 minutes to dissolve them perfectly. Thereafter the tungsten hexacarbonyl suspension was mixed to rGO into bottle one (Fig. 4 step-V). Similarly, 100 mg of cobalt carbonyl (since it is very reactive with oxygen it was weighed in the glove box) were mixed with 4 ml acetone and sonicated for 2-3 minutes to dissolve them perfectly. Then the cobalt carbonyl solution was mixed to rGO into the second bottle (Fig. 4 step-V). For the third bottle, 50 mg of tungsten hexacarbonyl and 50 mg of cobalt carbonyl were mixed with 4 ml acetone and sonicated for 2-3 minutes to prepare good dispersion before it was added to the bottle together with the rGO (Fig. 4 step-V). These three bottles containing the mixture of tungsten-rGO (WOx-rGO), Cobalt-rGO
(CoxOy-rGO) and tungsten-cobalt-rGO (WOx-CoxOy-rGO) were kept in fume hood to dry them
completely. Then the dried mixtures were grinded into powder separately (Fig. 4 step-VI). The powder was loaded onto a small tray and placed into a special glass tube. The glass tube was purged by argon gas (60 ml/min) for three hours in order to remove the air from the tube (Fig. 4 step-VII). Then microwave was started for 1-2 minutes with reduced argon flow (30 ml/min) (Fig. 4 step-VIII) and after few seconds the powder was glowing.
Fig. 4 Schematic illustration of microwave synthesis of WOx-rGO, CoxOy-rGO and WOx-CoxOy
-rGO.
3.5 Making Transparent Film of WOx-rGO/CoxOy-rGO/WOx-CoxOy-rGO: It is
essential to make a thin film of the metal oxide-rGO over a conductive substrate in order to utilize them as transparent electrode. There are two major methods to produce transparent thin film over a conductive substrate. These methods are; (I) at first film can be produced on the substrate from GO aqueous suspension and then reduce them using a hot vapor of reducing agent, [40] [41] [42] (II) making stable dispersion of rGO in any of dispersing agent first and then fabrication of transparent thin film of it. [43] [34] [44] [45] [46] [47] [48] [49] Since water is used as dispersion agent at the first method therefore, there is an advantage to produce high quality GO thin film through a direct vacuum filtration method or spin coating method. However, at the second stage of the first method; when GO goes through reduction process using a reducing agent, at this stage produced film could be contaminated or it my requires a severe annealing at
high temperature. [41][42] On the other hand, the second method directly uses the rGO dispersion to make the conductive thin film hence, in this process produced film is not contaminated and it does not require the tough post-reducing process environment.
There are several methods to produce stable rGO dispersion, such as use of an external dispersing agent, [45][46][47][48][49] chemical modification of GO or rGO platelet to achieve stable dispersion. [43] [34] [44] All of these processes are very challenging because the ultra-high surface area of graphene easily tend to agglomerates due to their strong van der Waals interactions.[50] In addition, performing chemical modification of GO or introduction of reducing agents to GO platelets prompt severe contamination of the resulting rGO films, that triggers the possible negative effects on the opto-electronic properties of the produced rGO films.[34] [44] A study report has been published where they have systematically examined an efficient method to prepare stable rGO dispersion in different dispersing agent such as, ethanol, dimethylformamide (DMF), and water without any assistance of chemical modification and dispersing agent. They have done this through two easy and versatile ways; controlling the degree of reduction and adjusting the pH of rGO dispersion. [50] There are also several other reports to attain highly stable rGO dispersion through either the modification of the graphene surface or reducing GO in the presence of surfactant. [51] Gao et al. reported that the stable dispersion of rGO was achieved by direct functionalization of graphene with nafion and utilized as a transparent conductor.[52] Furthermore, Koo et al. also demonstrated that the dispersion of rGO was attained by tuning the degree of reduction and the pH without the aid of any dispersing agent.[53]
In this project, dispersion of the metal oxide-rGO was prepared by an easy and simple method where neither chemical modification of GO nor any external reducing agent was utilized. Simply water and ethanol were utilized to prepare the dispersion of metal oxide decorated rGO and very little amount of nafion was used to make nice transparent conductive film. Several methods such as spray coating, drop casting have been thoroughly investigated to make the transparent conductive films of metal oxide-rGO on various substrate. Spray coating process was not very effective because it was not possible to shoot small sized rGO flakes on the target substrate. While it was spraying, the nano sized rGO flakes were flying away on the air before reaching to the target substrate. Therefore, the conductive film of the metal oxide-rGO was prepared by drop casting methods on various substrates.
4. Characterization:
4.1 Structural characterization: Scanning electron microscopy (SEM) analysis was
performed with a Zeiss Merlin FEG-SEM instrument. The Raman spectroscopy analyses were carried out on a Renishaw InVia Raman spectrometer with a charge-coupled device detector and using a laser excitation wavelength of 633 nm. The X-ray photoemission spectroscopy (XPS) was carried out on a Kratos axis ultra delay-line detector electron spectrometer using a monochromatic Al Kα source operated at 150 W. Thermogravimetric analysis (TGA) was performed with an air flow of 30 ml/min and a heating rate of 10K/min, from 25 ºC up to 900 ºC (METTLER Toledo TGA/DSC-1).
4.2 Electrochemical characterization: A potentiostat (AUTOLAB type PGSTAT302N)
was used to study the electrochemical analysis by liner sweep voltammetry (LSV) in a conventional three electrode system test cell with carbon fiber paper as the working electrode, Ag/AgCl as the reference electrode and Pt coiled wire as the counter electrode. For the measurement on the glassy carbon (GC), rotating ring disc electrode (RRDE) in a conventional three electrode test cell was used where glassy carbon (5 mm in diameter) as the working electrode, Pt rod as the counter electrode and Ag/AgCl as the reference electrode. Nickel foam and FTO (fluoride doped tin oxide) were also investigated as a substrate to prepare the working electrode. In the LSV and RRDE studies, an aqueous solution of 0.1 M KOH was used as the electrolyte. The measured potential versus Ag/AgCl in the three electrode configuration system was converted to reversible hydrogen electrode (RHE) scale according to the Nernst equation:
[18]
𝐸𝑅𝐻𝐸 = 𝐸𝐴𝑔/𝐴𝑔𝐶𝑙 + 𝐸°𝐴𝑔/𝐴𝑔𝐶𝑙 + 0.059𝑝𝐻
(Here EºAg/AgCl = 0.222V and pH = 13)
5 mg of metal oxide-rGO was mixed with 4.95 ml of ethanol (99.5 %), followed by 50 µl of nafion. Whole mixture was sonicated 3-4 minutes to dissolve the materials into the solution perfectly. In one case, 98.12 µl of the suspension (0.098 mg materials) were loaded on carbon fiber paper (CP) (0.785 cm2) by drop casting method. Similarly, in another step, 253 µl of the suspension (0.253 mg of materials) were loaded on the CP (0.785 cm2). For the measurement on GC, 5 mg of the metal oxide-rGO was added in 1 ml of 3:2 ethanol (99.5%)-water (DI) mixtures.
3-4 minutes sonication was performed to dissolve them uniformly. GC electrode was polished with 0.3 µm and 0.05 µm alumina slurries, and then 10 µl of the suspension was drop-coated on the electrode surface. After completely drying the suspension in ambient condition, 2 µl of nafion were applied subsequently on the surface of GC electrode to yield a uniform thin film. Later, the GC was also dried again in ambient air before using it as the working electrode.
4.3 Photo-electrochemical measurement: The photo-catalytic performances of the
produced nano-composites materials were also investigated using a standard three electrode system, with a coiled Pt wire as the counter electrode, an Ag/AgCl as the reference electrode and sample modified CP as the working electrode. A potentiostat (AUTOLAB type PGSTAT302N) was also used to study the photo-electrochemical analysis by liner sweep voltammetry (LSV) in a conventional three electrode system test cell using a 150W Retroreflective Incandescent lamp as the light source. The light was illuminated on the photo-anode through an optical quartz window and the distance between the light source and the photo-anode was fixed at 24 cm. 5 mg of metal oxide-rGO (Co3O4-rGO and WO3-Co3O4-rGO) was mixed with 4.95 ml of ethanol (99.5
%), followed by 50 µl of nafion. Then the mixture was sonicated 3-4 minutes to dissolve the materials into the solution uniformly. Later 253 µl of the suspension (0.253 mg of materials) were loaded on the CP (0.785 cm2). An aqueous solution of 0.1 M KOH was used as the electrolyte and the measured potential versus Ag/AgCl in the three electrode configuration system was also converted to reversible hydrogen electrode (RHE) scale according to the aforementioned Nernst equation. In order to further oxidize, in one case the sample modified CP (0.253 mg materials on 0.785 cm2) was annealed in oxygen ambient condition for 2 hours at 300 ºC.
5. Results and discussion:
5.1 Structural and morphological analysis:
Fig. 5 SEM images of WOx-rGO (a) scale bar 200 nm and (b) scale bar 1µm, CoxOy-rGO (c and
d) scale bar 1µm and WOx-CoxO4-rGO (e and f) scale bar 200 nm.
a b
c d
Scanning Electron Microscopy is a widely used analytical tool that provides high-resolution and long-depth-of-field emission images of the samples surface and near-surface. The SEM produces images of the sample by scanning it with a focused beam of electrons. The electrons interact with atoms in the sample, producing different signals that can be detected and that give information about the sample's surface topography and composition. The electrons generated from inelastic collision between incident electrons and loosely bonded outer electrons of specimen atom are called secondary electrons. The secondary electrons are emitted from the region close to the sample surface and they provide topographic information of the surface. The electrons created from elastic interaction of incident electrons with nuclei of atoms in a specimen are named backscattered electrons. The backscattered electrons are high energy electron that provides atomic number contrast information of the samples.
The growth of the nano particles on the rGO sheets prepared by three different methods was investigated by Scanning Electron Microscopy. The SEM images of WOx-rGO (Fig. 5 a, b) show
that 6-10 nm sized WOx nano particles are uniformly decorated on the rGO sheets, while Fig. 5
c, d display that the cobalt oxide nano-particles in the CoxOy-rGO samples are significantly
larger (50-100 nm) but still uniformly attached on the rGO sheets. The SEM images of the WOx
-CoxOy-rGO (Fig. 5 e, f) also display that larger nano particles distributed on the reduced
graphene sheets but with a larger size distribution (6-100 nm). By closer inspection comparing the contrast and appearance of the different particles one can conclude that the nano-particles in the large size regime (50-100 nm) probably are cobalt hydroxide or cobalt oxide nano-particles while smaller ones are the tungsten oxide nano-particles.
5.2 Elemental composition analysis:
X-ray photoelectron spectroscopy (XPS), based on photoelectric effects is an extensively used technique to investigate the chemical composition of surfaces (The escaping electron only travel from the upper 2-10 nm). This widely used technique was developed by Kai Siegbahn and his research group at the University of Uppsala, Sweden in the mid-1960’s. In this technique, a soft X-ray beam irradiates on materials surface and stimulates the electrons; simultaneously the kinetic energy of the escaping electrons is measured. The kinetic energy of the stimulated electrons can be connected to the binding energy or to the energy required to remove an electron from its orbitals. Since the binding energy of the electrons in the different orbitals also depends on the environment of the atoms, XPS is a very sensitive technique to derive information on the chemical bonding structure at the surface of samples.Fig. 6 shows the basic principle of XPS.
X-ray photon
1S
2S
2p
e-
Fig. 7 XPS spectra of the (a) GO, (b) rGO, (c) WOx-rGO and (d) CoxOy-rGO.
To study the chemical bonding structure of the pristine GO flakes, rGO and the metal oxide decorated rGO we have performed XPS measurement. For all samples we observe some characteristic signals in the wide energy XPS spectra. The peak corresponding to a binding energy of 284.8 eV are indicative of the carbon atom C1s signal and is assigned to the carbon atoms in a graphitic framework (C-C).[54] The peaks at 530.5and 531.8 eV observable in the XPS spectrum of all samples (Fig. 7 a, b, c, d and Fig. 8) correspond to the O1s signal and can be
0 200 400 600 800 1000 1200 2.0x10⁴ 4.0x10⁴ 6.0x10⁴ 8.0x10⁴ 1.0x10⁵ 1.2x10⁵ 1.4x10⁵ Intensity (cps)
Binding Energy (eV)
Intensity 0 200 400 600 800 1000 1200 0.0 2.0x10⁴ 4.0x10⁴ 6.0x10⁴ 8.0x10⁴ 1.0x10⁵ Intensity (cps)
Binding Energy (eV)
Intensity 0 200 400 600 800 1000 1200 0.0 2.0x10⁴ 4.0x10⁴ 6.0x10⁴ 8.0x10⁴ 1.0x10⁵ 1.2x10⁵ Intensity (cps)
Binding Energy (eV)
Intensity 0 200 400 600 800 1000 1200 0 1x10⁴ 2x10⁴ 3x10⁴ 4x10⁴ 5x10⁴ 6x10⁴ Intensity (cps)
Binding Energy (eV)
Intensity a b c d C1s O1s C1s O1s Na1s W4f C1s O1s Na1s Co3p Co3s C1s O1s Co2p Na1s W4d
attributed to doubly-bonded oxygen, singly-bonded oxygen in alcohols, ethers and epoxies.[55] Looking at the strength of the C1s and the O1s signals of the GO, the r-GO and the metal decorated samples one can see very clearly that the numbers of oxygen groups are decreasing drastically by the reduction process of the GO by using Na2S as reducing agent (comparing fig.
7a with 7b). It is also clear that the oxygen content decreases further, but not as obviously in the metal decorated samples (fig. 7c, and 7d) indicating that the microwave assisted synthesis process not only helps to decorate different metals oxides on the rGO but also to reduce the GO. This is especially clear in the samples decorated by Co, indicating that the cobalt atoms are more efficient in reducing the GO. It is plausible that some of these oxygen atoms are reacting with the metal atoms to form metal oxide nanoparticles.
Turning now our focus towards the signals representing the metal atoms in the wide range XPS spectra, we can assign the peak at 781.8 eV observed for the CoxOy-rGO and the WOx-CoxOy
-rGO samples (Fig. 7 d and Fig. 8) to the Co2p signal.[17] The XPS spectra of the WOx-CoxOy
-rGO also show intense O1s and Co2p peaks (Fig. 8) which confirm the presence of cobalt and oxygen. The peaks at 35.5 eV and 37.4 eV in wide spectrum of the XPS of the WOx-rGO and the
WOx-CoxOy-rGO (Fig. 7 c and Fig. 8) are attributed to W4f7/2 and W4f5/2 respectively.[15] The
metal oxide peaks were studied in more details by high resolution XPS spectra and the peak at 781 eV can also be clearly seen for the WOx-CoxOy-rGO sample (Fig. 9) as well as peaks of
W4f7/2 and W4f5/2 at 35.5 eV and 37.4 eV. Therefore, the presence of O1s, Co2p and W4f peaks
in the XPS results of the WOx-rGO, CoxOy-rGO and WOx-CoxOy-rGO (Fig. 7 c, d and Fig. 8)
and the similarity of the peaks with references 17, 54, 55 and 15 indicate that the nanoparticles decorated on the rGO comprise oxidized phases of cobalt and tungsten although the presence of metal hydroxides also cannot be rules out. Finally it is clear that the engineered nano materials produced by our method also contains some Na2S which was utilized as a reducing agent
signaling that Na2S is very difficult to remove despite repeated washing procedures by water and
acetone.
Fig. 9 High resolution XPS spectra of C1s, W4f and Co2p.
Atomic concentration (AC at %) of different chemicals in the GO, rGO, WOx-rGO, CoxOy-rGO
and WOx-CoxOy-rGO is shown in the table (Table. 1) below. For the CoxOy-rGO and the WOx
-CoxOy-rGO samples the oxygen content was not quantitatively determined but as seen in the
XPS spectra, it is clear that the oxygen ration is significantly lower than for the WOx-rGO
sample. 275 280 285 290 295 300 0 1000 2000 3000 4000 5000 Intensity (cps)
Binding Energy (eV)
Intensity 26 28 30 32 34 36 38 40 42 44 20 40 60 80 100 120 140 160 180 Intensity (cps)
Binding Energy (eV)
Intensity 770 775 780 785 790 795 800 805 810 815 550 600 650 700 750 800 850 900 Intensity (cps)
Binding Energy (eV)
intensity
C1s
Elements GO rGO WOx-rGO CoxOy-rGO WOx-CoxOy -rGO Carbon (C1s) 64.32 83.87 59.18 98.24 97.07 Oxygen (O1s) 35.68 16.14 21.89 Cobalt (Co2p 3/2) 1.77 2.28 Tungsten (W4f 7/2) 7.05 0.67 Sodium (Na1s) 11.89
Table 1: Atomic concentration of different chemicals in the GO, rGO and produced nano hybrids.
Raman spectroscopy is a spectroscopic technique developed by Raman and Krishnan in 1928 and this technique is used to observe vibrational, rotational, and other low-frequency modes in a system. This commonly used technique contains the family of spectral measurements made on molecular media based on inelastic scattering of monochromatic radiation. In this process, energy is exchanged between the photon and the molecule such that the scattered photon is of higher or lower energy than the incident photon. The variance in energy is made up by a change in the rotational and vibrational energy of the molecule and provides information on its energy levels.
Fig. 10 Raman spectra of WOx-rGO nano composites. The black curve is the experiment data
and the red curve is the fitted signal from the deconvolution.
The successful assembly of the metals oxides on the rGO and the chemical composition of the nano-composites were further investigated by Raman analysis. Fig. 10 shows a de-convoluted Raman spectrum of WOx-rGO. The four sharp peaks in the range of 200-1000 cm-1 correspond to
the bending and vibration modes of O-W-O bonds of WO3.[15] The peaks observed at 269 cm-1
and 790 cm-1 in Raman spectra correspond to the bending and vibrational modes of O-W-O bands of WO3.[16][56] The bands at ~1326 cm-1 and at ~1589 cm-1 are attributed to the defective
and graphitic nature of the carbon.[13]
0 200 400 600 800 1000 1200 1400 1600 1800 2000 2200 0.0 5.0x10⁴ 1.0x10⁵ 1.5x10⁵ 2.0x10⁵ 2.5x10⁵ 3.0x10⁵ 3.5x10⁵ 4.0x10⁵
Intensity (a.u.)
Wavenumber(cm-1)
Fig. 11 Raman spectra of the CoxOy-rGO where black curve is the experiment data and the red
curve is the fitted signal from the deconvolution.
Fig. 11 demonstrates the Raman spectra of the CoxOy-rGO that was de-convoluted into 8 peaks.
Two peaks centered at 482 cm-1and690 cm-1 are assigned to the Eg and A1g modes of the Co3O4
crystalline phase.[57] Other peaks in 193 cm-1 and 462 cm-1 could be due to the transverse and longitudinal optical phonon mode vibrations of the cobalt oxides.[13] Along with these, the additional visible peaks at ~1327 cm-1 and 1597 cm-1 could be assigned to the to the defective and graphitic nature of the carbon.[13][56]
Raman spectra of the WOx-CoxOy-rGO nano-composites are displayed in Fig. 12. In order to
draw information on the chemical analysis, the Raman spectra were also here de-convoluted by a peak fitting procedure. The bands centered at 269 cm-1 and at 683 cm-1 are attributed to the bending and vibrational modes of O-W-O bands of WO3.[16][15] The bands at 193 cm-1 and 462
cm-1 could be due to the transverse and longitudinal optical phonon mode vibrations of the cobalt
0 500 1000 1500 2000 0.0 2.0x10⁴ 4.0x10⁴ 6.0x10⁴ 8.0x10⁴ 1.0x10⁵ 1.2x10⁵
Intensity (a.u.)
Wavenumber (cm-1)
oxides.[13] The peak at 482 cm-1 is assigned to the Eg modes of the Co3O4 crystalline phase.[57]
The peak at 671 cm-1 can be attributed to Co3O4.[4] Moreover, the peaks around 1327 cm-1 and
around 1589 cm-1 could be assigned to the defective and graphitic nature of the carbon. [13]
Fig. 12 Raman spectra of WOx-CoxOy-rGO. The black curve is the experiment data and the red
curve is the fitted signal from the deconvolution.
The explorations of the chemical compositions of the nano hybrids performed by the XPS and the Raman analysis have ensured the successful decoration of the WO3 and Co3O4 on the rGO.
The stabilizations of these phases are also explained by the fact that these stoichiometries represent the most stable oxidized phase for these transition metals.Though the rGO was washed with water and acetone for several times after the reduction it was not possible to remove all of the unwanted chemicals from the materials thoroughly. So, there are some unknown peaks in
0 500 1000 1500 2000 0.0 2.0x10⁴ 4.0x10⁴ 6.0x10⁴ 8.0x10⁴ 1.0x10⁵
Intensity (a.u.)
Wavenumber (cm-1)
Raman and XPS spectra due to the existence of the chemicals. Moreover, due to the co-doping, many peaks have also shifted little bit from its original positions, pointing to the fact that some of the nanoparticles are indeed co-alloys of Co and W.
Furthermore, the amount of the WO3 and the Co3O4 loading (in weight percentage) on the rGO
has been confirmed by the thermogravimetric analysis. In the WO3-rGO, 86% of the WO3 was
successfully attached on the rGO. The relative weight loss in the TGA analysis after certain temperature, it was also established that 66% of the Co3O4 was successfully decorated on the
rGO sheets in the Co3O4-rGO nano hybrids. While WO3 was doped with Co3O4, it has been
found in the TGA report that the weight percentage of the metals oxides was 65% in the WO3
-Co3O4-rGO nano composites.
5.3 Catalytic performances:
Fig. 13 Oxygen evolution currents of WO3-Co3O4-rGO, Co3O4-rGO and WO3-rGO hybrids (a)
0.125 mg/cm2 (b) 0.322 mg/cm2 loaded on CP anodes.
The catalytic performances of the WO3-Co3O4-rGO, Co3O4-rGO and WO3-rGO in OER are
shown (Fig. 13 a) while these materials are loaded on the CP (0.098 mg on 0.785 cm2) or (at 0.125 mg/cm2)respectively. The WO3-Co3O4-rGO hybrid affords current density 1 mA/cm2 at
1.698 V vs RHE. The current density curve of the WO3-Co3O4-rGO shows the onset potential at
1.597 V vs RHE. The Co3O4-rGO nano-composites reach current density 1 mA/cm2 at 1.750 V
vs RHE. The current density curve of the Co3O4-rGO exhibits the onset potential at 1.640 V vs
1.0 1.2 1.4 1.6 1.8 2.0 0 1 2 3 4 5 6 7 J (mA/cm 2) E(V) vs RHE Co-rGO WO3-Co-rGO WO3-rGO
Only Nafi + Etha on CP
1.0 1.2 1.4 1.6 1.8 2.0 0 1 2 3 4 5 6 7 J ( mA/cm 2) E(V) vs RHE Co-rGO WO3-Co-rGO WO3-rGO
Only Nafi + Etha on CP
RHE. The attained current density by the WO3-rGO is very low compared to other
nano-composites.
The catalytic performances of the WO3-Co3O4-rGO, Co3O4-rGO and WO3-rGO for OER are
displayed (Fig. 13 b) while the loading of these materials on the CP were increased (0.253 mg on 0.785 cm2) or (at 0.322 mg/cm2). The WO3-Co3O4-rGO hybrid gives a current density of 1
mA/cm2 at 1.693 V vs RHE. The Co3O4-rGO nano-composites afford the current density 1
mA/cm2 at 1.769 V vs RHE. Also in this case, the attained current density by the WO3-rGO is
very low compared to other nano hybrids. It is also noteworthy that the WO3-Co3O4-rGO
nano-composites shows an over potential (1.693-1.23= 463 mV) 463 mV at 1 mA/cm2 (Fig. 13 b) in 0.1 M KOH solution which significantly lower (shifted by 76 mV) than the corresponding over potential of the Co3O4-rGO (1.769-1.23= 0.539) 539 mV at 1 mA/cm2 (Fig. 13 b) in the same
solution. The catalytic performances curves (Fig. 13 b) clearly indicate that the over potential is significantly reduced by 76mV (539-463=76 mV) after co-doping the WO3 with the Co3O4-rGO
nano hybrids.
The catalytic performance of the nano composites in the OER regarding the over potential has not improved remarkably due to the extra loading, because the additional loading just increases the layers of the materials, whereas the interactive surface of the catalyst till remains same. Moreover, the current density curve of the WO3-Co3O4-rGO and Co3O4-rGO nano-composites
show the onset potential at 1.597 V vs RHE and 1.688 V vs RHE respectively (Fig.13 b). Therefore, after co-doping the WO3 with the Co3O4-rGO nano composites the change in the
onset potential is 1.688-1.597=0.091 V vs RHE (91 mV).
In addition, prepared WO3-Co3O4-rGO, Co3O4-rGO and WO3-rGO were also loaded on FTO
glasses, GC and nickel foam in order to make electrode to investigate the catalytic performance in OER in alkaline solution. Though the catalytic performance in OER with little bit lower over potential was achieved while the GC was utilized as electrode. However, the catalytic performance of the GC electrode in OER regarding the current density was lower than the performances of the CP. Moreover, GC is not suitable in the commercial applications therefore the achieved data is not included in this report.
While FTO glasses were utilized as substrate to prepare electrode, the catalytic performances in OER was not satisfactory. In addition, the film produced by the nano hybrids on the FTO glasses was easily peeled off after chemical reaction with the electrolyte. Nickel is catalytically active in the PEC, therefore while nickel foam was utilized as substrate; it was difficult to distinguish the catalytic performances of the different materials loaded on it. Moreover, the thin film produced on the nickel foam was also easily peeled off after chemical reaction with the electrolyte. In order to distinguish the catalytic performance of the produced nano materials in OER, each time of the investigation the catalytic performance of the substrate were also investigated without loading nano-materials. Fig. 12 a, b exhibits the catalytic performance of the CP in OER while nano-materials were not loaded on it.
5.4 Photo-catalytic performances:
Fig. 14 Oxygen evolution photo currents of (a) WO3-Co3O4-rGO and (b) Co3O4-rGO nano
hybrids
Photo-catalytic performances of the produced nano hybrids (loaded on CP, 0.322 mg/cm2) were also investigated in alkaline condition. Fig. 14 a shows the catalytic and photo-catalytic performances of the WO3-Co3O4-rGO nano-composites in OER. While light was illuminated on
the anodes the WO3-Co3O4-rGO afforded photo-current density 1 mA/cm2 at 1.663 V vs RHE.
The over potentials at the photo-current density 1 mA/cm2 is (1.663-1.23= 0.433) 433 mV. Without light irradiation the same nano hybrids afforded current density 1 mA/cm2 at 1.693 V vs RHE (over potential 463 mV). Due to the light irradiation the over potential has reduced by 30
1.0 1.2 1.4 1.6 1.8 2.0 0 1 2 3 4 5 6 7 J mA/cm 2 V vs RHE WO3-Co-rGO with light WO3-Co-rGO without light
1.0 1.2 1.4 1.6 1.8 2.0 0 1 2 3 4 5 6 7 J mA /cm 2 V vs RHE
Co-rGO with light Co-rGO without light
mV (463-433 = 30 mV) in the case of WO3-Co3O4-rGO in OER. Due to the light irradiation on
the anodes the Co3O4-rGO hybrids have achieved the photo-current density 1 mA/cm2 at 1.693 V
vs RHE. The over potential at the photo-current density 1 mA/cm2 is (1.693-1.23 = 0.463) 463 mV. Without light illumination the Co3O4-rGO nano-composites afforded current density
1mA/cm2 at 1.769 V vs RHE (over potential 539 mV). In the case of Co3O4-rGO the over
potential has considerably reduced by 76 mV (539-463= 76 mV). The achieved results clearly indicate that nano hybrids materials are not only catalytically active but also photo-sensitive in OER. Co3O4-rGO nano hybrids show more photo-sensitivity compared to the WO3-Co3O4-rGO.
5.5 Annealing effects:
Fig. 15 (a) Oxygen evolution current of the WO3-Co3O4-rGO before and after annealing, (b)
Oxygen evolution photo-current of the WO3-Co3O4-rGO after annealing.
The WO3-Co3O4-rGO nano-hybrids materials loaded on the CP (0.322 mg/cm2) were annealed at
oxygen ambient condition for two hours at 300 ºC. After annealing it afforded current density 1 mA/cm2 at 1.779 V vs RHE. The corresponding over potential at this current density is (1.779-1.23 = 0.549) 549 mV. Whereas the WO3-Co3O4-rGO nano hybrids afforded current density 1
mA/cm2 at 1.693 V vs RHE (Over potential 463 mV) without annealing. The over potential is increased by (549-463=86) 86 mV due to the annealing. On the other hand, the WO3-Co3O4
-rGO loaded annealed CP (0.322 mg/cm2) gave photo-current density 1 mA/cm2 at 1.658 V vs RHE while the light was illuminated on the anodes. The over potential at the current density
1.0 1.2 1.4 1.6 1.8 2.0 0 1 2 3 4 5 6 7 J mA/c m2 V vs RHE WO3-Co-rGO WO3-Co-rGO (Ann) 1.0 1.2 1.4 1.6 1.8 2.0 0 1 2 3 4 5 6 7 J mA/c m2 V vs RHE
WO3-Co-rGO (Ann + light ) WO3-Co-rGO (Ann + without light)
1mA/cm2 is (1.658-1.23 = 0.428) 428 mV. The over potential has shifted by (549-428 = 121) 121 mV due to the light irradiation. Due to the annealing the nano-composites materials might have further oxidized, thus becomes more photo-sensitive, and also the annealing process might heal defects, making the excited electrons and holes being able to travel longer distances before scattering.
The photo-catalytic and catalytic performances of the produced nano hybrids in different conditions are shown together in the table below (Table. 2).
Samples Loading on CP (mg/cm2) Annealed 2 h 300 ºC Light irradiation Current density (mA/cm2) V vs RHE Over potential (mV) WO3-Co3O4 -rGO 0.125 No No 1 1.698 468 Co3O4-rGO 0.125 No No 1 1.750 520 WO3-Co3O4 -rGO 0.322 No No 1 1.693 463 Co3O4-rGO 0.322 No No 1 1.769 539 WO3-Co3O4 -rGO 0.322 No Yes 1 1.663 433 Co3O4-rGO 0.322 No Yes 1 1.693 463 WO3-Co3O4 -rGO 0.322 Yes No 1 1.779 549 WO3-Co3O4 -rGO 0.322 Yes Yes 1 1.658 428
Table. 2 Catalytic and photo-catalytic performances of the produced nano composites.
6. Conclusion:
In summary, a facile, efficient microwave assisted procedure has been successfully developed. By this one-pot synthesis method, WO3 and Co3O4 were effectively anchored on rGO where
nano particles are homogeneously decorated without any agglomeration. WO3-Co3O4-rGO nano
composites were produced by co-doping WO3 with Co3O4 where nano particles were uniformly
attached with the rGO sheets and no cross linkers or chemicals were utilized in this wonderful process to attach nano particles with the reduced graphene sheets. The WO3-Co3O4-rGO nano
composites produced by the microwave synthesis process have shown remarkable development in the catalytic performance in OER. The over potential has reduced by 76 mV at 1 mA/cm2 current density due to the co-doping of WO3 with Co3O4. The co-doping has also evolved the
potential reduction of the on-set potential (91 mV vs RHE) at the certain current density. The produced nano hybrids are not only catalytically active for OER but also photo-catalytically very sensitive for OER in alkaline condition.
7. Outlook:
This easy and simple method can be applied to decorate other kind of metal oxide on the reduced graphene sheets. Since co-doping showed significant improved result in the catalytic as well as photo-catalytic performance in OER, this procedure could be devoted to dope different metal oxide with one another in order to attain enhanced catalytic operation in the PEC. The microwave irradiation time is a crucial factor to control the size and agglomeration of the produced nano particles. Therefore, further research is required to optimize the size of the produced nano particles with desired catalytic performance. Moreover, graphene sheets in the nano composites are completely reduced consequently become highly hydrophobic, so it is very difficult make a colloidal dispersion of this material. In addition, many solvents have the negative impact on the attachment of the nano particles with graphene sheets. Some solvents either weaken the bonding force between the anchored nano particles and graphene or totally remove the nano particles from graphene sheets and agglomerate them on the certain area of the graphene sheets. So, further research is also required to improve efficient techniques and find the effective solvent to make colloidal dispersion of this materials in order make thin conductive film for anodic applications in the PEC. In order to apply the metal oxide rGO as anode in the PEC, it is very important to make conductive thin film of the nano compounds on the different substrates. Hence, conductive polymers are a vital factor to produce conductive thin film of the metal oxide decorated rGO on the different substrates. Therefore, further study is also required to find effective conductive polymers in a view to form conductive thin films without trapping the electrons and holes.
Acknowledgement:
First and foremost, I would like to say '' All praises to Allah'' who gave me the strength and good health to complete this thesis. My warmest appreciation to my wonderful supervisors Thomas Wågberg and Guangzhi Hu. I appreciate your valuable guidance, advice, insightful comments on my work and helping me to bring it up to the necessary standard for the completion of my thesis. I would like to express my deepest appreciation to all the members in this research group especially Tiva, Eduardo and Xueen for their practical help, sympathy, and their kind welcome to me in so many ways. My sincere thanks also go to Tohidul, Roland, Mosharof, and Nills who helped me in many ways.
8. References:
[1] H. Qi, J. Wolfe, D. Wang, H. J. Fan, D. Fichou, Z. Chen, Nanoscale 2014, 6, 13457.
[2] T. Lopes, P. Dias, L. Andrade, A. Mendes, Solar Energy Materials and Solar Cells 2014, 128, 399. [3] H. Ishihara, G. Kannarpady, K. Khedir, J. Woo, S. Trigwell, A. Biris, Physical Chemistry Chemical Physics 2011, 13, 19553.
[4] J. Wu, Y. Xue, X. Yan, W. Yan, Q. Cheng, Y. Xie, Nano Research 2012, 5, 521.
[5] C. C. L. McCrory, S. Jung, J. C. Peters, T. F. Jaramillo, Journal of the American Chemical Society 2013, 135, 16977.
[6] Y. H. Fang, Z. P. Liu, Journal of the American Chemical Society 2010, 132, 18214. [7] M. W. Louie, A. T. Bell, Journal of the American Chemical Society 2013, 135, 12329.
[8] Y. Y. Liang, H. L. Wang, J. G. Zhou, Y. G. Li, J. Wang, T. Regier, H. J. Dai, Journal of the American Chemical Society 2012, 134, 3517.
[9] J. K. Kim, W. Yang, J. Salim, C. Ma, C. W. Sun, J. Q. Li, Y. Kim, Journal of the Electrochemical Society 2014, 161, A285.
[10] N. H. Chou, P. N. Ross, A. T. Bell, T. D. Tilley, Chemsuschem 2011, 4, 1566.
[11] S. W. Lee, C. Carlton, M. Risch, Y. Surendranath, S. Chen, S. Furutsuki, A. Yamada, D. G. Nocera, Y. Shao-Horn, Journal of the American Chemical Society 2012, 134, 16959.
[12] M. Bajdich, M. Garcia-Mota, A. Vojvodic, J. K. Norskov, A. T. Bell, Journal of the American Chemical Society 2013, 135, 13521.
[13] S. K. Singh, V. M. Dhavale, S. Kurungot, ACS Applied Materials and Interfaces 2015, 7, 442. [14] Q. X. Mi, A. Zhanaidarova, B. S. Brunschwig, H. B. Gray, N. S. Lewis, Energy & Environmental Science 2012, 5, 5694.
[15] H. Wu, M. Xu, P. Da, W. Li, D. Jia, G. Zheng, Physical Chemistry Chemical Physics 2013, 15, 16138. [16] L. Fu, T. Xia, Y. Zheng, J. Yang, A. Wang, Z. Wang, Ceramics International 2015, 41, 5903.
[17] X. W. Xu, J. F. Shen, N. Li, M. X. Ye, Journal of Alloys and Compounds 2014, 616, 58. [18] J. Y. Gan, X. H. Lu, Y. X. Tong, Nanoscale 2014, 6, 7142.
[19] G. M. Wang, Y. C. Ling, H. Y. Wang, X. Y. Yang, C. C. Wang, J. Z. Zhang, Y. Li, Energy & Environmental Science 2012, 5, 6180.
[20] A. Lerf, H. He, M. Forster, J. Klinowski, Journal of Physical Chemistry B 1998, 102, 4477. [21] W. Gao, L. Alemany, L. Ci, P. Ajayan, Nature Chemistry 2009, 1, 403.
[22] L. B. Casablanca, M. A. Shaibat, W. W. W. Cai, S. Park, R. Piner, R. S. Ruoff, Y. Ishii, Journal of the American Chemical Society 2010, 132, 5672.
[23] R. Edwards, K. Coleman, Nanoscale 2013, 5, 38. [24] C. Li, G. Shi, Nanoscale 2012, 4, 5549.
[25] M. J. McAllister, J.-L. Li, D. H. Adamson, H. C. Schniepp, A. A. Abdala, J. Liu, M. Herrera-Alonso, D. L. Milius, R. Car, R. K. Prud'homme, I. A. Aksay, Chemistry of Materials 2007, 19, 4396.
[26] D. Li, M. Muller, S. Gilje, R. Kaner, G. Wallace, Nature Nanotechnology 2008, 3, 101. [27] I. K. Moon, J. Lee, R. S. Ruoff, H. Lee, Nature Communications 2010, 1.
[28] S. Pei, J. Zhao, J. Du, W. Ren, H.-M. Cheng, Carbon 2010, 48, 4466.
[29] H.-L. Guo, X.-F. Wang, Q.-Y. Qian, F.-B. Wang, X.-H. Xia, Acs Nano 2009, 3, 2653. [30] K. Sheng, Y. Sun, C. Li, W. Yuan, G. Shi, Scientific Reports 2012, 2.
[31] V. C. Tung, M. J. Allen, Y. Yang, R. B. Kaner, Nature Nanotechnology 2009, 4, 25.
[32] S. Stankovich, D. A. Dikin, G. H. B. Dommett, K. M. Kohlhaas, E. J. Zimney, E. A. Stach, R. D. Piner, S. T. Nguyen, R. S. Ruoff, Nature 2006, 442, 282.
[33] W. Guoxiu, Y. Juan, P. Jinsoo, G. Xinglong, W. Bei, L. Hao, Y. Jane, Journal of Physical Chemistry C 2008, 112, 8192.
[34] Y. Si, E. T. Samulski, Nano Letters 2008, 8, 1679. [35] W. Chen, L. Yan, Nanoscale 2011, 3, 3132.
[36] W. Chen, L. Yan, P. R. Bangal, Carbon 2010, 48, 1146.
[37] X. Fan, W. Peng, Y. Li, X. Li, S. Wang, G. Zhang, F. Zhang, Advanced Materials 2008, 20, 4490. [38] G. Williams, B. Seger, P. V. Kamt, ACS Nano 2008, 2, 1487.
[39] M. J. McAllister, J. L. Li, D. H. Adamson, H. C. Schniepp, A. A. Abdala, J. Liu, M. Herrera-Alonso, D. L. Milius, R. Car, R. K. Prud'homme, I. A. Aksay, Chemistry of Materials 2007, 19, 4396.
[40] G. Eda, G. Fanchini, M. Chhowalla, Nat Nano 2008, 3, 270.
[41] H. A. Becerril, J. Mao, Z. Liu, R. M. Stoltenberg, Z. Bao, Y. Chen, ACS Nano 2008, 2, 463.
[42] S. Watcharotone, D. A. Dikin, S. Stankovich, R. Piner, I. Jung, G. H. B. Dommett, G. Evmenenko, S. E. Wu, S. F. Chen, C. P. Liu, S. T. Nguyen, R. S. Ruoff, Nano Letters 2007, 7, 1888.
[43] RamanathanT, A. A. Abdala, StankovichS, D. A. Dikin, M. Herrera Alonso, R. D. Piner, D. H. Adamson, H. C. Schniepp, ChenX, R. S. Ruoff, S. T. Nguyen, I. A. Aksay, R. K. Prud'Homme, L. C. Brinson, Nat Nano 2008, 3, 327.
[44] S. Park, J. An, I. Jung, R. D. Piner, S. J. An, X. Li, A. Velamakanni, R. S. Ruoff, Nano Lett 2009, 9, 1593.
[45] Q. Su, S. Pang, V. Alijani, C. Li, X. Feng, K. Müllen, Advanced Materials 2009, 21, 3191. [46] Y. Liang, D. Wu, X. Feng, K. Müllen, Advanced Materials 2009, 21, 1679.
[47] S. Stankovich, R. D. Piner, X. Q. Chen, N. Q. Wu, S. T. Nguyen, R. S. Ruoff, Journal of Materials Chemistry 2006, 16, 155.
[48] H. Chang, G. Wang, A. Yang, X. Tao, X. Liu, Y. Shen, Z. Zheng, Advanced Functional Materials 2010, 20, 2893.
[49] E. Y. Choi, T. H. Han, J. Hong, J. E. Kim, S. H. Lee, H. W. Kim, S. O. Kim, Journal of Materials Chemistry 2010, 20, 1907.
[50] K. Min, T. H. Han, J. Kim, J. Jung, C. Jung, S. M. Hong, C. M. Koo, Journal of Colloid and Interface Science 2012, 383, 36.
[51] J. P. Tessonnier, M. A. Barteau, Langmuir 2012, 28, 6691.
[52] Y. Liu, L. Gao, J. Sun, Y. Wang, J. Zhang, Nanotechnology 2009, 20.
[53] K. Min, T. H. Han, J. Kim, J. Jung, C. Jung, S. M. Hong, C. M. Koo, J Colloid Interface Sci 2012, 383, 36.
[54] S. Stankovich, D. A. Dikin, R. D. Piner, K. A. Kohlhaas, A. Kleinhammes, Y. Jia, Y. Wu, S. T. Nguyen, R. S. Ruoff, Carbon 2007, 45, 1558.
[55] R. Rozada, J. I. Paredes, S. Villar-Rodil, A. Martinez-Alonso, J. M. D. Tascon, Nano Research 2013, 6, 216.
[56] P. Q. Wang, Y. Bai, P. Y. Luo, J. Y. Liu, Catalysis Communications 2013, 38, 82. [57] C. W. Tang, C. B. Wang, S. H. Chien, Thermochimica Acta 2008, 473, 68.
![Fig. 3 Chemical struture of graphene oxide. [20] [21] [22]](https://thumb-eu.123doks.com/thumbv2/5dokorg/5440410.140612/13.918.320.585.506.729/fig-chemical-struture-graphene-oxide.webp)


