Mars 2019
Resilience-enhancement through
Renewable Energy Microgrid Systems
in rural El Salvador
Mathias Alarcón
Robin Landau
Teknisk- naturvetenskaplig fakultet UTH-enheten Besöksadress: Ångströmlaboratoriet Lägerhyddsvägen 1 Hus 4, Plan 0 Postadress: Box 536 751 21 Uppsala Telefon: 018 – 471 30 03 Telefax: 018 – 471 30 00 Hemsida: http://www.teknat.uu.se/student
Resilience-enhancement through Renewable Energy
Microgrid Systems in rural El Salvador
Mathias Alarcón & Robin Landau
This Master thesis investigates how Renewable Energy Microgrid Systems (REMS) can enhance resilience for a rural grid-connected community in El Salvador. The study examines the optimally resilient design of a grid-connected PV-Wind-Battery hybrid energy system. The optimally resilient system configuration was determined based on energy affordability, defined as minimum net present cost (NPC) and energy reliability, which was defined as a 1% maximum annual capacity shortage. The system modelling and optimisation was performed in the HOMER (Hybrid Optimisation of Multiple Energy Resources) software, where the system was optimised for different scenarios. The results of this study show that REMS can enhance resilience by lowering
electricity costs for the community and thus increasing energy affordability. However, the REMS did not manage to make an equally substantial impact on energy reliability, due to the grid performance that proved to be high with few annual power outages. Besides the grid connection, the optimally resilient system was driven entirely by PV energy since it proved to be highly profitable. Wind power and battery storage were excluded from the optimally resilient system since they did not contribute to
affordability and the capacity shortage limit was met already from the PV unit and the grid. Furthermore, the results show that self-sufficiency can be provided with REMS from the local energy resources, but that it is unrealistic with current costs due to the high battery prices. The study concludes that REMS should be considered as a
legitimate resilience measure in rural El Salvador.
ISSN: 1650-8319, UPTEC STS 19006 Examinator: Elísabet Andrésdóttir Ämnesgranskare: David Lingfors Handledare: Claudia Blanco
Populärvetenskaplig sammanfattning
Centralamerika är en region som de senaste 20 åren drabbats hårt av naturkatastrofer och extremväder, och El Salvador är ett av de utsatta länderna i regionen. Den här rapporten syftar till att undersöka hur ett mikronät baserat på förnybar elproduktion kan bidra till att öka resiliensen för ett bostadskooperativ på landsbygden i El Salvador. Resiliens kan beskrivas som ett systems förmåga att förebygga utsatthet, klara av att utsättas för chocker och återhämta sig snabbt. Energitillgång är en faktor som brukar lyftas som central för resiliens, och Sustainable Energy for All (SE4ALL) och International Energy Agency har i sina definitioner av konceptet energitillgång lyft fram faktorerna ekonomi och tillförlitlighet. I den här studien undersöks hur dessa faktorer skulle påverkas om mikronät drivna av förnybar energi implementeras i det salvadoranska bostadskooperativet Cuna de la Paz. Det görs genom att simulera olika mikronätssystem och undersöka utfallen för de totala elkostnaderna och leveranssäkerheten.
Mikronät är en teknik som blivit allt mer populär till följd av att förnybara energitekniker baserade på lokala resurser har fallit i pris. Ett mikronät är ett energisystem i mindre skala som på ett kontrollerat och säkert sätt hanterar lokal elproduktion och elförbrukning. Mikronätet kan vara anslutet till ett regionalt elnät och har också möjlighet att operera i ett så kallat ö-läge, då systemet fungerar isolerat från elnätet. I denna studie har olika nätkopplade mikronätssystem bestående av solpaneler, vindkraftverk och batterilagring simulerats och optimerats för att se vilken kombination av energitekniker som sammantaget bidrar till mest resiliens.
Studien har genomförts i samarbete med den salvadoranska icke-statliga organisationen FUNDASAL som ansvarar för bostadskooperativet. Genom en fältstudie erhölls information kring bland annat bostadskooperativens elförbrukning, det regionala elnätet och kostnader för energiteknikerna i mikronätet. Därefter modellerades och optimerades systemet med hjälp av programmet HOMER Pro. Optimeringarna utfördes i tre olika nätscenarion, där ett av dessa fungerade som huvudscenario. Huvudscenariot byggde på nätdata från år 2017 med högre leveranssäkerhet medan det andra scenariot byggde på nätdata från år 2005 med lägre leveranssäkerhet. I det sista scenariot undersöktes om systemet med de lokala energiresurserna skulle kunna bli självförsörjande. I det scenariot kunde inte el köpas från det regionala elnätet.
Resultaten visar att mikronät kan bidra till att öka resiliensen för bostadskooperativet främst genom sänkta elkostnader. Elnätet i huvudscenariot visade sig vara tillförlitligt vilket gjorde att ett mikronät inte på samma sätt bidrog till att förbättra leveranssäkerheten. Resultaten visar också att solpaneler är den mest lönsamma energitekniken att investera i för bostadskooperativet. Varken vindkraft eller batterilagring visade sig vara motiverat att inkludera då kombinationen av solpaneler och elnät var tillräcklig för att skapa ett leveranssäkert system och medförde de lägsta totala kostnaderna. Simuleringarna i det tredje scenariot visar att bostadskooperativet skulle kunna bli helt självförsörjande med hjälp av ett mikronät. Däremot bidrog den
uppskattade batterikostnaden till ett orimligt dyrt energisystem. Sammantaget visar rapporten att mikronät drivna på förnybar energi är en gångbar åtgärd för att öka resiliensen för landsbygdssamhällen i El Salvador.
Acknowledgements
There are many people that in different ways have been of great help to us in the process. First and foremost, without the dedication and drive of Claudia Blanco, Technical Director at FUNDASAL, our aspirations and ideas for the project might just have ended up as ideas. Claudia was absolutely vital for making the study happen, and we are eternally grateful for her support. Nina Larrea, We Effect’s Regional Director in Latin America, belongs to the same VIP category. Thanks to her curiosity and willingness to let all important Regional Directorial duties aside to help some students realising a high-shooting idea, we got connected with FUNDASAL.
Our work in El Salvador was facilitated by professor Sandra Gutiérrez from the Central American University (UCA) who allowed us access to the university and introduced us thoroughly to important topics of the country (and her students). Roberto Melara, Civil Engineer at FUNDASAL, was a crucial support for us in our quest for different types of data: he arranged meetings, drove us there and tried to meet all our questions with great patience. Also Julio Meléndez, Assistant Director at FUNDASAL, drove us around and shared us his great hospitality. As the first Salvadoran face we encountered after the passport control at the airport, Julio’s friendliness put its mark on our entire stay.
Many more people deserve to be mentioned: Diego Salcedo from AES El Salvador for providing valuable information and a good introduction to the energy sector of the country, Leticia Martinez, Mario Quezada, Isaac Seguro and Monica Hérnandez from FUNDASAL and We Effect for helping us out and introducing us to the Cuna de la Paz-project and Daysi for her friendship. Collectively, we want to praise the staff at FUNDASAL and We Effect, the cooperativists of Cuna de la Paz and the surfers of El Tunco.
Our university subject reader David Lingfors deserves a special recognition for bearing with us all along and correcting our direction in times of perplexion. So does Malin Frisk who got us inspired with her thesis, and gave us valuable inputs.
Finally, we want to acknowledge Emma Stenbacka for being our constant company and equally supportive regardless of our progression, and our families and friends for accepting our absence.
To all mentioned above and the people of El Salvador, Thank you
Mathias Alarcón & Robin Landau,
Abbreviations
AC – Alternating CurrentACOVIAMET – Asociación Cooperativa de Vivienda por Ayuda Mutua El Triunfo ACOVICUPA – Asociación Cooperativa de Vivienda por Ayuda Mutua Cuna de la Paz ARENA – Allianza Republicana Nacionalista
CEL – Comisión Ejecutiva Hidroeléctrica del Rio Lempa CNE – Consejo Nacional de Energía de El Salvador DC – Direct Current
DER – Distributed Energy Resources DG – Distributed Generation
ETESAL – Empresa Transmisora de El Salvador
FMLN – Frente Farabundo Martí para la Liberación Nacional
FUNDASAL – Salvadoran Foundation for Development and Minimal Housing HOMER – Hybrid Optimisation of Multiple Energy Resources
IEA – International Energy Agency
JICA – Japanese International Cooperation Agency LCOE – Levelised Cost of Energy
LGE – Ley General de Electricidad MER – Mercado Eléctrico Regional NGO – Non-Governmental Organisation NPC – Net Present Cost
O&M – Operation and Maintenance
REMS – Renewable Energy Microgrid Systems SAIDI – System Average Interruption Duration Index SAIFI – System Average Interruption Frequency Index
SIGET – Superintendency of Electricity and Telecommunications of El Salvador PV – Photovoltaic
1
Table of contents
1. Introduction ... 3
1.1 Study aim ... 5
1.2 System setup and study delimitations ... 5
1.3 Disposition ... 6
2. Background ... 7
2.1 El Salvador ... 7
2.2 Electricity in El Salvador ... 8
2.2.1 Electricity profile ... 9
2.2.2 El Salvador’s electricity system ... 12
2.2.3 Electricity prices ... 14
2.2.4 Solar and wind ... 16
2.3 FUNDASAL ... 18
2.3.1 Work and philosophy ... 19
2.3.2 Project Cuna de la Paz ... 19
2.4 Microgrid systems ... 22
3. Methodology and data ... 25
3.1 Modelling procedure and simulation outline ... 25
3.1.1 Modelling and optimisation in HOMER Pro ... 26
3.1.2 System modelling ... 27
3.1.3 Simulation and result outline ... 30
3.2 Data ... 31
3.2.1 Energy resources ... 31
3.2.2 Load profile ... 33
3.2.3 Grid profile ... 35
3.2.4 Electricity prices ... 41
3.2.5 Component prices and details ... 43
3.2.6 Other factors ... 46
3.3 Sensitivity variables ... 48
4. Results and analysis ... 49
4.1 Scenario: Reliable grid ... 49
4.1.1 Base case ... 49
4.1.2 Sensitivity analysis ... 52
4.2 Scenario: Unreliable grid ... 55
4.2.1 Base Case ... 55
2 4.3 Scenario: Self-sufficiency ... 60 5. Discussion ... 63 5.1 Main lessons ... 63 5.2 Methodology discussion ... 64 5.3 Contextualisation ... 65 5.4 Further research ... 67 6. Conclusions ... 68 7. References ... 69
Appendix A - Who did what? ... 78
Appendix B – Interview questions ... 79
3
1. Introduction
When it comes to extreme weather events and climate catastrophes, less developed countries have been more afflicted than industrialised countries historically. A region that has been remarkably stricken by weather-related disasters the last 20 years is Central America, where several countries occupy the top ranks of the Global Climate Risk Index (Kreft et al., 2017). One of those is El Salvador, a country hit by natural disasters such as Hurricane Ida in 2008 (Shoda, 2012) and the extreme drought in 2015 which left over 3.5 million Central Americans in need of humanitarian assistance. The most vulnerable groups are the rural communities and small-scale agricultural producers who see their livelihoods and homes affected and often demolished (FAO, 2016). The country has also been affected by non-climate related natural disasters such as the 2001 earthquake, which reached 7.6 on the Richter scale and killed more than 1000 people (BBC, 2018). As a result of these problems, which are compounded with violence and criminal gang activity, many Salvadorans have to leave their communities in search of safety (OAS, 2015). Because of the problems the country faces, the concept of resilience is of great importance in the modern context of El Salvador. Resilience can be defined as “the ability of
countries, governments, communities and households to manage change, by maintaining or transforming living standards in the face of shocks or stresses, while continuing to develop and without compromising their long-term prospects” (Brooks et al., 2014, iii).
This definition covers both a system’s ability to cope with shocks and stresses (like earthquakes and droughts) and the ability to remain strong and continue to improve in the long run. Hills et al. (2018, 23) state that resilience management is a “key strategy for
managing disaster risk under climate change”. According to Kelly-Pitou et al. (2017),
resilience measures are actions that should be taken today to protect communities from direct damage and at the same time help remove the long-term impacts of climate change. Such actions should make systems stronger and smarter than they were in the past. Energy access is a vital factor in the resilience context, as argued by several sources. The International Energy Agency (IEA, 2019a) states that “access to affordable and reliable
energy services is fundamental to reducing poverty and improving health, increasing productivity, enhancing competitiveness and promoting economic growth”. Hills et al.
(2018) stress that energy access is crucial for people’s livelihoods and wellbeing, and that a lack of energy access could be a key constraint in providing resilient occupations and be a cause of poverty for the most vulnerable communities to climate change. Perera et al. (2015) describe energy access as an enabler to poverty reduction. According to the Sustainable Energy for All’s (SE4ALL) definition of energy access, two factors of crucial significance are affordability and reliability (Angelou, 2014).
As renewable energy technologies become less expensive, opportunities for increased energy access are emerging. The foreword of the 2017 edition of the World Energy Outlook describes the cost reductions of solar photovoltaics (PV), wind power and battery storage as one of the major trends that “profoundly reshape the energy sector” (IEA,
4
2017, 3). The International Renewable Energy Agency (IRENA) states that the strong business potential of renewable energy is the “chief driver” of the capacity growth of the technologies, and that it offers “increasingly exciting economic opportunities” (IRENA, 2018, 3), where the most evident example is the 80% cost reductions of PV modules between 2009 and 2018. They consider renewable energy to be a key opportunity especially in developing countries (IRENA, 2018). These renewable technologies are often utilised in microgrid applications (several examples are presented in this study). A microgrid can be described as an integrated electrical grid system, with local loads and energy production that is often (but not necessarily) renewable, and which can operate both in connection with a main grid and in isolation (Smith and Ton, 2012). Wu et al. (2016) express that community level microgrids can provide reliable and resilient electricity services with the aim to optimise electrical, economic and societal goals by serving critical loads. Kelly-Pitou et al. (2017) consider microgrids to play an increasingly popular role in discussions regarding electrical grid reliability. They further constitute renewable microgrids to be an effective local level action to contribute to long-term challenges of sustainability.
Resilience is a central focus of the work of the Salvadoran NGO FUNDASAL (the Spanish acronym for the Salvadoran Foundation for Development and Minimal Housing in English). FUNDASAL works on the ground in El Salvador with the mission to provide secure and dignified housing to the groups that are vulnerable to the contemporary hazards. The NGO has worked for 50 years with the construction and fortification of both rural and urban communities (FUNDASAL, 2017a). An ongoing rural project is Cuna de la Paz, where a grid-connected community village consisting of 62 homes and a community center along with the necessary infrastructure is under construction. The plan is to partially maintain the community through eco-tourism. FUNDASAL is recognised for their construction and integral project management expertise. Nevertheless, local energy solutions have not yet been considered or evaluated by the organisation.
The combination of the hazardous Salvadoran environment, the rise of business opportunities of renewable energy integrated in microgrid systems and the Cuna de la Paz project provide an interesting study case for assessing how a promising system solution could contribute to enhanced resilience. Perera et al. (2015) acknowledge that the concept of resilience needs to be understood as context-specific, which makes case studies ideal in developing the toolbox of resilience-enhancing activities in different geographic regions (also supported by Hills et al. (2018) and Stone (2013)). A research gap that they identify is the general need to specifically map the challenges and opportunities in different regions at different scales. Central America appears to be an under-investigated region regarding energy connection and resilience. Balint (2006) points out that most regional assessments tend to focus on Africa and Asia and that Central America has been left behind. Twelve years later, Madriz-Vargas et al. (2018) recognise the same issue, indicating that this region still needs attention.
5
1.1 Study aim
The aim of the study is to investigate if Renewable Energy Microgrid Systems (REMS) can provide enhanced resilience to rural Salvadoran communities, exemplified by the Cuna de la Paz project, and how a REMS should be designed to optimally do so. In accordance with the energy access definition presented by SE4ALL (Angelou, 2014) and IEA (2019), resilience is conceptualised as the energy- affordability and reliability, which is investigated with different premises in various scenarios presented in Chapter 3.
1.2 System setup and study delimitations
Cuna de la Paz is a community village under construction and described in detail in Section 2.3.2. It has already been connected to the main grid and a fortification is planned. The microgrid systems that were investigated in this study are simulation products and have thereby only been studied through computational models. They were modelled to work in times of power outages from the main grid as long as there is sufficiently available local energy resources (such as solar PV production or battery-stored energy). In compliance with the circumstances they were modelled as grid-connected, only providing electricity to the community. This was decided with FUNDASAL who did not consider a thermal demand for the project. Therefore, the systems do not provide thermal energy.
The modelled system designs consist of combinations of PV modules, a wind turbine, battery storage and a grid connection. The sizes, locations and orientations of the components are presented in Section 3.2.6. The study focuses on implementing renewable energy since it aligns with the planned eco-touristic profile of the Cuna de la Paz-project, besides the sustainability aspect of renewable energy that makes it comply with resilience. Consequently, fossil fuel-based electricity generation is excluded. Diesel generation was thereby excluded even though it has successfully been implemented in many rural microgrids with the benefit of being able to provide power when the renewable sources do not produce sufficiently (Eziyi and Krothapalli, 2014). The issue is nevertheless more critical in off-grid Microgrid systems where no main grid provision can be counted on. The PV modules and the wind turbine were chosen because of the recognised potential of solar insolation and wind energy in the studied area (further elaborated in Section 2.2.4). Other renewable energy sources, such as biomass energy and hydro energy were excluded. Biomass energy normally consists of agricultural crop remain or forest bioenergy resources and were considered to be insufficient in the studied area since it lacks farming activity. Hydro energy was excluded since no suitable water streams were available in the vicinity. PV modules and the wind turbine were also chosen due to their advantage of being easily managed, with little harm to the vicinity and high social acceptability (Dawoud et al., 2018). The term for the system that is used in this report is Renewable Energy Microgrid System (REMS).
The modelled location of the production units in the community is presented in Section 3.2.6. Only rooftop spaces have been considered for the PV modules. However, the
6
weight limit of the rooftops has not been considered within the study. Therefore, the decision making of choosing the most suitable rooftops for the installation of PV modules did not depend on construction boundaries.
The community is connected to a local grid. The modelled system’s possibility to sell electricity to the grid was however not limited by restrictions regarding the capacity of the local grid. It was therefore assumed to manage all surplus electricity that the system generates in all simulations.
1.3 Disposition
This section gives an overview of the disposition of the thesis. The background chapter (2) begins by briefly introducing the country El Salvador in section 2.1, while Section 2.2 discusses electricity-related issues of the country. Section 2.3 outlines the organisation FUNDASAL and the project Cuna de La Paz. The background chapter ends with a discussion of microgrid technologies in Section 2.4.
The methodology and data chapter (3) presents the research methodology and data collection of the study. They were decided to be presented in the same chapter since the chosen methodology stemmed from the type of data that was available. The chapter introduces the modelling procedure and the simulation outline in section 3.1. In Section 3.2, the data acquisition of the study is described and discussed. Lastly, the selected sensitivity variables are presented in Section 3.3.
The results and analysis chapter (4) presents the results of the optimisations. The different results for the three scenarios (presented in Section 4.1, 4.2 and 4.3) are illustrated and analysed. The discussion chapter (5) aims to widen the results to a broader context. The chapter starts by highlighting the main lessons from the results in Section 5.1. In Section 5.2, the methodology of the study is discussed, and Section 5.3 contextualises the findings. The discussion chapter ends by recommending further research in Section 5.4 before the concluding Chapter 6.
7
2. Background
This chapter introduces the aspects that were considered relevant for the understanding of the study. Section 2.1 gives a general introduction to El Salvador. In Section 2.2 a more in-depth presentation of electricity-related issues of the country is presented, such as the electricity production, electricity prices and the current status of solar- and wind power. Section 2.3 presents FUNDASAL and the Cuna de la Paz project. Lastly, microgrid technologies are presented in Section 2.4.
2.1 El Salvador
El Salvador (see Figure 1) is the smallest and most densely populated country in Central America with an area of 21’000 km2 and a population of 6.4 million (Landguiden, 2018a). Its neighbouring countries are Honduras, Guatemala and Nicaragua. The country is located in the tropical zone and has two seasons. The dry season extends from November to April, and the wet season from May to October, when the country receives heavy rain falls (Nations Encyclopedia, 2019).
Figure 1. Location of El Salvador (Source: OpenStreetMap, 2019. © OpenStreetMap’s donors, available under the Open Database Licence.)
Between 1979 and 1992, the country suffered badly due to its ongoing civil war and about 75’000 Salvadorans lost their lives. Years of social injustice and military-dominated rule caused a left-wing movement, led by guerrilla and paramilitary squads, to take up arms against the regime. The war reached its dramatic climax when archbishop Romero was assassinated in 1980 (Calvo-Gonzalez and Humberto, 2015). After the war, the country has stabilised, and the last presidential elections have been considered to be democratic. In February 2019, Nayib Bukele was elected president, the first candidate not representing the previously dominant parties constituted by leftists FMNL and conservative ARENA, which were the opposing sides in the civil war (NBC, 2019). The economy has traditionally been heavily dependent on the the agricultural sector, which accounted for 25% of the GDP in 1987 (Countrystudies, 2019). However, during the last decade, the
8
service sector has dominated the economy. There is also a big informal sector in the country, and many families rely on money from Salvadorans who have migrated to the U.S (Landguiden, 2018b). Some sources claim that this kind of income accounted for 18.3% of the total GDP in 2017 (Orozco, 2017).
Another important and worrying issue for the country is the threat from gang criminality. El Salvador has had one of the higher murder rates in the world due to criminal gang activity, and the police forces have been struggling to cope with the situation since the early 1990s. (Woody, 2018).
2.2 Electricity in El Salvador
This section is an introduction to the Salvadoran electricity context and discusses the electricity generation (2.2.1), electricity system (2.2.2), electricity prices (2.2.3) and the current situation for solar and wind power (2.2.4). Before the Salvadoran electricity situation is entered in depth, a contextualisation of the electricity access in Central America is presented in Figure 2.
Figure 2. The national electrification rate of the Central American countries in 2000, 2005 and 2016. Developing Asia and Sub-Saharan Africa are included as a reference. Data source: IEA Energy Access Database (IEA, 2019b): National electrification rate.
Figure 2 shows that El Salvador in 2016 has the second highest electrification rate in Central America with 96%, after a rapid growth since 2000 (a growth that is shared by most of neighbouring countries). The electrification rate interval of the Central American countries in 2016 is between 76% (Honduras) and 99% (Costa Rica). Developing Asia (including for example China, India, Indonesia and South-East Asia) and Sub-Saharan Africa (including all African countries except for those fronting the Mediterranean) are included as reference. The statistics show that Developing Asia’s rate relate to the lower scoring Central American countries Nicaragua and Honduras with 89% in 2016. Sub-Saharan Africa, with a 42% electrification rate in 2016, gives a completely different situation. The statistics imply that the Central American countries in general have
0 10 20 30 40 50 60 70 80 90 100 % 2000 2005 2016
9
experienced a quick electrification growth from 2000 with high rates in 2016 compared to other developing regions.
2.2.1 Electricity profile
The generated electricity in El Salvador originates from 3 major sources. Figure 3 demonstrates the Salvadoran electricity matrix in 2017.
Figure 3. The sources of the electricity in the Salvadoran utility grid 2017. Data source: SIGET (2017): Cuadro r3, 37, 38B and 73.
As Figure 3 shows, the main electricity source is hydro power, although geothermal and thermal energy are not far behind (net imports disregarded). The electricity generation in El Salvador is heavily influenced by rainfall and hydroelectric potential, which becomes clear in a comparison with the 2016 electricity matrix, shown in Figure 4.
Figure 4. The sources of the electricity in the Salvadoran utility grid 2016. Data source: SIGET (2016): Cuadro 37 and 79 and SIGET (2017): Cuadro r3.
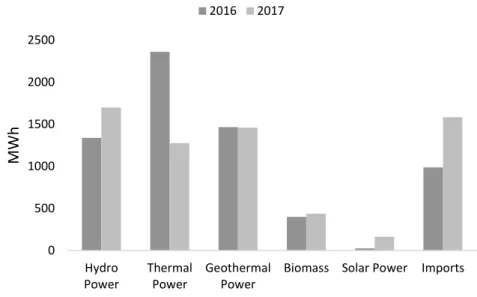
A dry 2016 paved the way for increased thermal energy production. With almost 40 percent of the injected electricity, the power system is clearly dependent on thermal power during dry years. Figure 5 provides a closer comparison of the year profiles of 2016 and 2017. Hydro Power 26% Thermal Power 19% Geothermal Power 22% Biomass 7% Solar Power 2% Imports 24% Hydro Power 20% Thermal Power 36% Geothermal Power 22% Biomass 6% Solar Power 1% Imports 15%
10
Figure 5. The sources of the electricity in the Salvadoran utility grid 2016 and 2017. Data source: See Figure 2 and 3.
Among the energy sources shown in Figure 5, hydro power is the prioritised energy source when available since it has the lowest production margin costs. The fluctuation in hydro power (caused by seasonal variations and year to year anomalies) is covered by thermal power. The domestic and relatively cost-effective geothermal and biomass power supplied base loads remain in largely unchanged between seasons and years (JICA, 2012). With 204 MW of installed geothermal capacity, the volcanic El Salvador is the largest producer of geothermal power in the region, as well as one of the world’s leading countries in basing its domestic power system on the utilisation of the power source (with 22 percent of the injected electricity both 2016 and 2017) (World Watch, 2019). The first geothermal power plant was built back in 1976 (see data source for Figure 7), and the installed power has grown steadily since then. The sugar cane-based biomass production is a more novel power source, with the first large-scale plant in production in the early 2000s. However, biomass power has experienced a rapid growth from 20 MW in 2003 to 264 MW in 2017, and with further investments in efficiency and the use of new crops, Salvadoran biomass power is expected to continue to increase (CNE, 2019a). Solar energy is presented in Section 2.2.4.
Figure 6 shows that El Salvador’s net electricity imports have increased significantly in recent years: roughly 18 times between 2012 and 2017. This indicates that El Salvador has issues with the economic competitiveness of their domestic electricity. Since the formalisation of the Central American Regional Electricity Market (MER) in 1996, El Salvador has by far been the biggest importer of electricity in the region. The main exporter is neighbouring Guatemala, whose low electricity end price stems from their expansion of hydro power and biomass, and also their transition in thermal production from oil to coal (Molina, 2017). In El Salvador, on the other hand, the vast thermal power consumption (critical not least during the dry periods) is based entirely on oil combustion (IEA, 2018, Table 1.3). Besides increasing import dependency (El Salvador does not have
0 500 1000 1500 2000 2500 Hydro Power Thermal Power Geothermal Power
Biomass Solar Power Imports
M
Wh
11
large petroleum resources), reliance on oil makes for electricity price vulnerability, as will be discussed in Section 2.2.3.
Figure 6. The Salvadoran net imports of electricity 1986-2016. Data source: SIGET (2017): Cuadro 09.
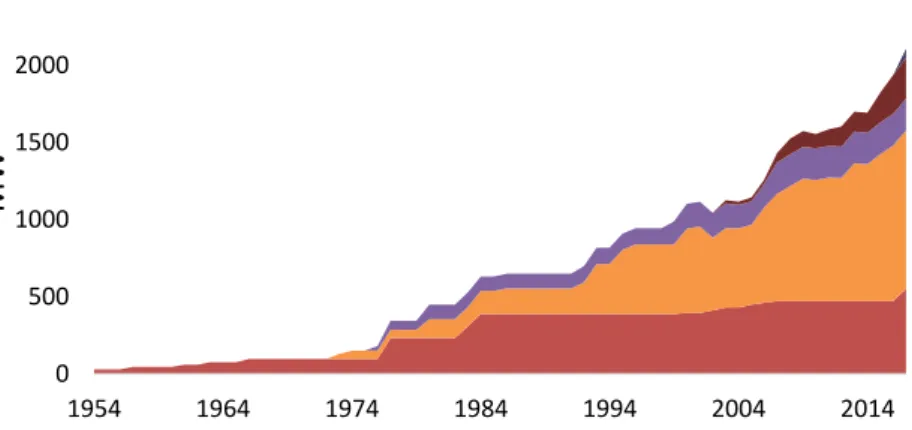
In order to provide some perspective on the Salvadoran electricity generation system, Figure 7 presents the installed capacity from the origin of the nation scale power system (1954) to the latest available data (2017).
Figure 7. The development of the installed power capacity in El Salvador 1954-2017. Data source: SIGET (2017): Cuadro 07.
For the first 20 years all power generation mainly originated from the first two hydro power plants. In the 1970s thermal and geothermal production started contributing to an extended power capacity. Since then, all three power sources have been significantly expanded, although thermal power has had the most significant expansion (JICA, 2012). A trend that started at the turn of the century is the surge of the renewables, which so far
0 200 400 600 800 1000 1200 1400 1600 1800 1986 1991 1996 2001 2006 2011 2016 MWh 0 500 1000 1500 2000 2500 1954 1964 1974 1984 1994 2004 2014 MW
12
has been most clearly manifested by rapidly increasing biomass power. The rise of solar PV and wind energy that has started in recent years will be discussed in Section 2.2.4.
2.2.2 El Salvador’s electricity system
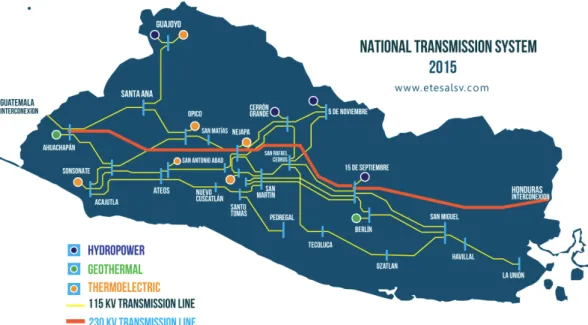
In the first half of the 20th century only a few communities had electricity access from local turbines, managed by local grid operators. 1954 gave birth to not only the inauguration of the first large scale hydro power plant of 30 MW, but also the vertically structured National Electrification Program and its ambition to provide electricity services to all of El Salvador (CNE, 2019b). The power system was managed publicly through la Comisión Ejecutiva Hidroeléctrica del Rio Lempa (CEL), who stayed in charge of both the major production plants and the operation of the national grid (CNE, 2017a). The first 20 years gave rise to a rapid growth of the national grid, and in 1970 most of the Salvadoran territory had electric supply (Grupo CEL, 2015). In 2016, briefly 60 years later, the Salvadoran national electrification rate was 96%, the next highest in the region behind Costa Rica (see Figure 2). Figure 8 shows an up to date Salvadoran map with the national transmission system and major power production plants, and Figure 9 shows the 230 kV grid that connects the Central American countries.
Figure 8: El Salvador’s transmission system and main power plants. Source: CNE (2016) 14. Used with permission.
13
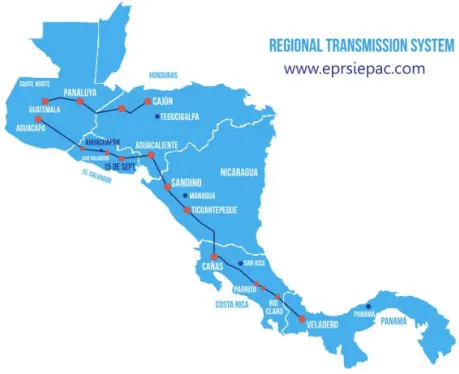
Figure 9: The interconnection of the Central American countries electricity systems. Source: CNE (2016) 15. Used with permission.
The transnational grid is in fact one line (see Figure 9), which makes it vulnerable. In July 2017 for example, a power outage caused by a downed Panamanian transmission line hit millions of users in Panama, Costa Rica and El Salvador (Sibaja, 2017). The vulnerable interconnection becomes problematic regarding the extreme weather events that regularly hit Central America (mentioned in Chapter 1). The transnational Siepac transmission grid has planned capacity reinforcements through a second power line that is to be operational in 2024, but there are indications that the expanded transmission capacity will not withstand the increase in demand that the Central American countries will face in the time to come (Dorothal, 2018).
The 1990s became a time of major energy sector reforms for many of the Latin American countries including El Salvador, driven by a development program from the World Bank. The first step was the foundation of the General Law of Electricity (LGE) which lay the juridical base of the system operation and provides the General Superintendency of Electricity and Telecommunication (SIGET, the main data source in the study regarding El Salvador’s electricity sector) the regulation and supervision responsibility. With the superintendency in place, the restructuration continued with privatisation reforms where the previously governmental (i.e. CEL) driven thermal power plants and distribution grids where auctioned to private operators. The national high voltage grid was kept in government control through the newly constituted Transmission Company of El Salvador (ETESAL), and the new electricity market was managed through the Transaction Unit (UT) founded for the purpose. The new market is characterised by supply and demand-based spot pricing. An important role is provided to the distribution grid owners since they take responsibility for the delivery in their respective areas and the invoicing for the integral costs (CNE, 2019c).
14
2.2.3 Electricity prices
The end electricity price consists of various components which are charged by the distribution grid operators. The main cost covers the Energy Price Transferrable to Tariff (PET) which considers the marginal costs of production (virtually the spot price which makes up 85% of PET), power capacity readiness and maintenance of the national grid and the market (CNE, 2019c). Besides, the end customer is charged for the distribution grid operator’s transmission costs and for extra fees, that practically can be considered as the operating expenditure. The invoices that have been presented to the authors have indicated that the PET makes out on average 75% of the total charged cost, meaning that approximately 64% of the end customer price covers the spot pricing.
The spot price covers the marginal cost of the electricity generation. As described in Section 2.2.1, the electricity production depends on the availability of the relatively cheap hydro power. Since the tropical climate of El Salvador provides two seasons (dry and wet), the availability is highly season based. Moreover, dry year anomalies provide an additional uncertainty. The peak month of hydro generation 2010 provided 294 GWh nationally, while the corresponding number the year before was 193 GWh (as pointed out by JICA (2012)). The availability of the cheapest electricity generation is therefore unreliable, which consequently opens for end electricity price variations, both on a seasonal and yearly basis.
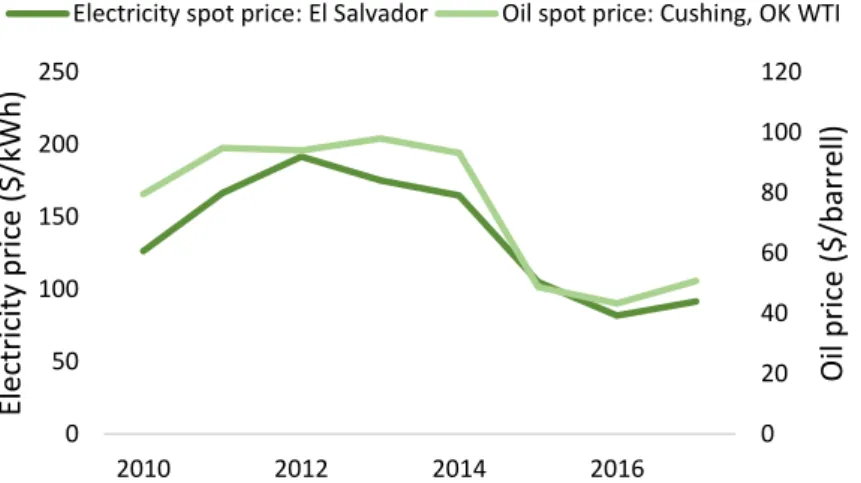
The lack of hydro power availability is complemented by thermal power production from petroleum derivatives. The thermal production is significant in both seasons but dominates to a higher degree when the hydro power does not produce at its higher capacities. Thermal production is not weather dependent, but it provides a substantial element of price volatility in another way. The cost of electricity production in Salvadoran thermal power plants is depending directly on the international market price of crude oil: a price which has fluctuated dramatically the last decades. Figure 10 shows the development of the crude oil spot price 1997-2017, Figure 11 the mean annual electricity spot price in El Salvador and the crude oil spot price 2010-2017 on a yearly basis and Figure 12 the electricity spot price in El Salvador and the monthly crude oil spot prices 2016-2017.
15
Figure 10. The spot price development of crude oil 1997-2017. Benchmark: Cushing, OK WTI. Source: EIA (2019).
Figure 11. The development of the crude oil spot price (Benchmark: see Figure 10) and the electricity spot price in El Salvador 2010-2017. Sources: EIA (2019) and SIGET
(2017) Cuadro 27.
Figure 12. The development of the crude oil spot price (Benchmark: see Figure 10) and the electricity spot price in El Salvador January 2016 to December 2017. Sources: EIA
(2019) and SIGET (2017) Cuadro 27.
0 20 40 60 80 100 120 1997 2001 2005 2009 2013 2017 Oi l p ri ce ( $ /b arr el l) 0 20 40 60 80 100 120 0 50 100 150 200 250 2010 2012 2014 2016 Oi l p ri ce ( $ /b arr el l) El ect ri ci ty p ri ce ($ /kWh)
Electricity spot price: El Salvador Oil spot price: Cushing, OK WTI
30 35 40 45 50 55 60 60 70 80 90 100 110
jan-2016 dec-2016 nov-2017
Oi l p ri ce ($/ b ar re ll) El ectri ci ty p ri ce ($/ MWh )
16
The figures show not only that the crude oil market price is highly volatile, but also that El Salvador’s electricity spot price has followed the crude oil price both on a yearly average the last 8 years and also to a high extent month to month in 2016 and 2017. Zummaratings (2017) affirm that the Salvadoran spot price depends to a high extent on the international petroleum prices and that this is the reason for the relatively low electricity prices the last years. JICA (2012) and CNE (2018) observe that the Salvadoran production capacity in the years following the electricity sector reform only expanded with oil-combustion plants since that type of production generated best profits as it is characterised by high marginal costs which are directly covered by the spot price – resulting in more expensive electricity. At the same time, the World Energy Outlook 2017 states that:
"The future trajectory for oil prices, both their average level and their volatility around this level, is a critical uncertainty for any forward-looking energy analysis." (IEA, 2017,
93).
Despite these currently low petroleum prices El Salvador has the highest electricity costs in Central America 2018, a factor that contributes to the rapidly growing competition driven electricity imports (Molina, 2018).
To mitigate the expenses of the poorest Salvadorans, the government issue electricity subsidies which can cover up to half of the total costs of electricity. The subsidies were expanded in 2018 and are expected to facilitate 950 000 families (CNE, 2017b). To be entitled subsidies there are a few criteria that must be met. Most notably, the consumer has to be an individual proprietary of no more than a single home with a total consumption of maximum 105 kWh per month (La Prensa Gráfica, 2017).
2.2.4 Solar and wind
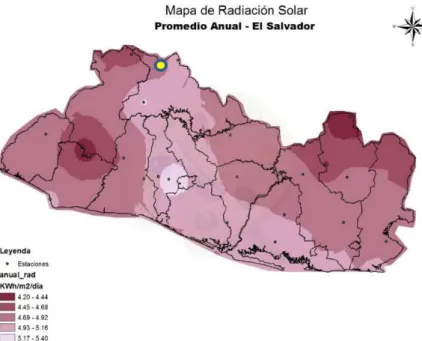
There is an understanding of the need to produce less expensive electricity in El Salvador, and a way that has been highlighted is to strengthen renewable energy. In 2010, the National Energy Council (CNE) (with responsibility for the social and economic development strategies regarding the energy sector) issued a number of goals for the future. One of the most important goals was to diversify the energy production by expanding the renewable energy sector. The Japanese International Cooperation agency (JICA) was consulted for a thorough investigation in order to provide an integral plan for integrating renewable energy to the Salvadoran power sector (the so called “Master plan”). The report was released in 2012 and included for example energy potential measurements and strategy formulations which have been widely utilised in reports and projects that promote renewable energy. Figure 13 and 14 present the solar and wind power potential map respectively, where JICA points out zones where it is suitable to launch solar- and wind power projects.
17
Figure 13. The solar potential in El Salvador. The yellow dot represents the location of Cuna de la Paz. Source: JICA (2012) 4-9. Used with permission.
Figure 14. Sites with wind potential in El Salvador. The yellow dot represents the location of Cuna de la Paz. Source: JICA (2012) 7-2. Used with permission.
In 2018, CNE released a new plan (the “Indicative plan”) that proceeded with the mission of diversifying the electricity production in El Salvador. The background of the report stated that the increased electricity demand in El Salvador will result in prices three times higher without an active expansion plan. The lead motive of the plan was to avoid even higher electricity prices in the future practically by any means necessary where all price reducing technologies were revised (from solar and wind to cheaper oil derivatives) (CNE, 2018).
18
The articulated goals of decreasing the electricity prices have resulted in various newly installed solar PV projects. The project type that has attracted most attention is the directly grid connected solar park in projects where global operators are invited by the government to give bids and thus enable major investments in the energy sector. The biggest solar park that is installed in early 2019 is the Providencia park of 101 MW, which is the biggest park in the Central American region (IndustryAbout, 2018). The other finalised parks are significantly smaller; aggregated with Providencia the total solar park capacity is 150 MW (SIGET, 2017, cuadro 35). The electricity price development depends on a variety of factors, but at least it seems like the injection of solar power has contributed to lower electricity prices according to a SIGET press release (Bellini, 2017). According to the earlier mentioned indicative plan, there are plans for a number of large solar parks yet to be installed in the following years, such as the Capella Solar-park of equal size as Providencia that is planned to be finalised in April 2019 (CNE, 2018). At the time of writing (February 2019) not a single utility scale wind power plant is finalised, but there is a financed project of 50 MW which is planned to be delivering power to the grid from April 2020 (Hernández, 2017).
Although considerably smaller in size, there are a number of PV-systems designed for self-consumption in El Salvador. Mainly installed on government buildings, schools and universities, a CNE summary shows that the installed capacity is 25 MW on approximately 130 locations, where most of them most likely are rooftop installations (CNE, 2019d). The JICA-report states that the potential for urban environment PV-systems is high due to the great solar radiation in the country as a whole and especially in the San Salvador metropolitan area (JICA, 2012). The installations of residential PV-systems have not yet started to get under way, only a small number have been performed in the high-class areas. Another type of PV-system solution is the off-grid system, where smaller loads are supplied by solar panels with an intermediate battery storage in areas not reached by the national grid. Two Salvadoran village examples are Caserío los Encuentros (AES El Salvador, 2016) and El Sauce (MITD-Lab, 2019). However, they remain nothing more than a parenthesis due to the high electification rate of the country (96%).
2.3 FUNDASAL
FUNDASAL (Salvadoran Foundation for Development and Minimal Housing) is a private non-governmental organisation that strives to create better homes for Salvadorans with scarce economic resources. With funding from both national and international organisations, they create housing projects throughout El Salvador. The organisation was founded in 1968, when a natural disaster eradicated many neighbourhoods in the capital, San Salvador. The neighbourhoods were mostly populated by impoverished families that lacked the economic capability to fund a rebuilding process. A group of Christians, that had the economic ability, helped the families to rebuild their homes. After finalising the rebuilding, the group started to mobilise a larger organisational structure, since the need to facilitate homes for similar groups of people (whom were either forced to move or to
19
rebuild their homes due to natural disasters or violence) was much needed. Since the start, FUNDASAL has finalised 21 projects, giving over 3000 families new homes (FUNDASAL, 2017a).
2.3.1 Work and philosophy
FUNDASAL has different institutional programs that provides frameworks for how to operate depending on the qualifications for the project design. The “Neighbourhood improvement program” aims to reduce risk factors for violence and strengthen the environment of public spaces. The “New urban settlement program” and the “Rural habitat improvement program” attempts to facilitate new housing possibilities to families in rural areas and areas that have been affected by natural disasters (FUNDASAL, 2017b). All the programs have the intention of creating socially sustainable housing. Parts of the projects have been implemented with the idea of cooperativism. The idea of cooperative housing entered the organisation in the late 90s when FUNDASAL came in contact with the Swedish Cooperative Center (now We Effect). Instead of only building the houses, the cooperative approach creates opportunities for the families to be a part of the construction and maintenance process (FUNDASAL, 2017c). Before initiating a project, FUNDASAL provides training and education in how to construct and build the houses for the people part of the cooperatives. The homes are built by seismic resistant adobe bricks (a type of sun-dried mud bricks) which the cooperativists create, using resources that are normally abundant on the project site. Throughout the building process, FUNDASAL provides the cooperativists with technical expertise and other necessary support. The projects are funded by FUNDASAL and its partners with the aim of making the housing cooperatives self-managing (FUNDASAL, 2017d). As mentioned earlier, FUNDASAL has finalised 21 housing project and has various ongoing projects in different parts of El Salvador. The organisation is often engaged in the political debate, advocating for adequate housing habitat for all Salvadorans. In September 2018, the organisation celebrated its 50th anniversary by inviting collaborators and international organisations for a three-day long congress, containing lectures, workshops and field trips to the different housing projects (FUNDASAL, 2018).
2.3.2 Project Cuna de la Paz
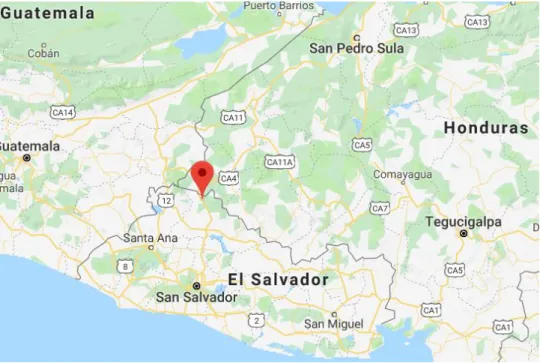
The project Cuna de la Paz is located in northern El Salvador, in the municipality of La Palma, Chalatenango. La Palma had an important role during the civil war, where the town hosted the peace treaty between the guerrilla army and the military in 1992. Figure 15 shows the location of the project site. As Figure 13 and 14 show, the location of Cuna de la Paz has beneficial local energy resources.
20
Figure 15. Location of Cuna de la Paz (Google Maps, 2019).
The project consists of two cooperative groups (ACOVICUPA and ACOVIAMET) and they intend to build 62 family houses, creating a space for developing social activities, a community center and a water pump facility. The two latter are already built but none of the family houses are yet constructed and there is still no final date on when the project will be completed.
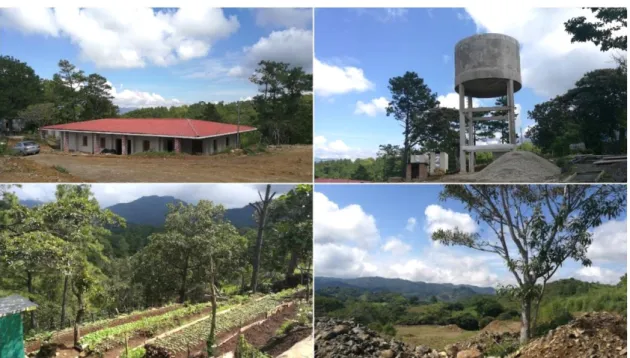
The project also strives to give the cooperativists a possibility to build artisanal workshops with the aim of attracting tourists to the location. The cooperativists have already created a tourist route, which gives a view over the nearby mountain landscape and there are plans to also start a small café. With the approach to attract tourists, the cooperatives are hoping to benefit the community economically and create job opportunities. They have also created a cultivation area with the intention of becoming self-sufficient to a high extent when it comes to vegetables. The family houses will all be built with the same design and each house has an area of 64 m2, including two bedrooms, a kitchen, a living room and one bathroom.
Figure 16 consists of pictures of the project site with the community center, the water tank and the area where family houses will be built.
21
Figure 16. Community center, water tank facility, cultivation area and family house area. Source: the authors.
All the buildings within the project will have access to a local electricity grid which is operated by the company CAESS. The community center is currently connected, and Figure 17 shows a photo of the local electricity grid, taken from the community center.
22
2.4 Microgrid systems
The concept of microgrids is defined by the U.S Department of Energy as local grids which consist of a group of interconnected loads and distributed energy resources (DER). The microgrid can be connected to the utility grid or be disconnected and work in island- mode, which means that it can meet the end-users demand by ensuring energy supply to the critical loads in a reliable manner. The ability to work independently from the grid mitigates outages and disturbances and therefore strengthens the grid reliability (Smith and Ton, 2012). DER can be different types of energy technologies, storage technologies or demand management applications. The separate elements together constitute distributed generation (DG) for end-use customers in the vicinity (Cultura, 2011) (Microgrid Institute, 2014). Furthermore, Cultura (2011) describes that the implementation of DERs can vary a lot between system designs. Some systems are designed for bigger communities or remote islands, where renewable energy resources are available, whereas some are planned for single or a couple of households. Microgrid Institute (2018) divides microgrids into five different categories:
1) Off-grid microgrids -which are not connected to a utility network, usually found on remote sites and islands.
2) Campus microgrids - which have a connection to a utility network but in the case of an outage to a certain level manages to maintain power on-site. Prisons, universities and hospitals are examples of such locations.
3) Community grids- that provide service to several customers within a specific community.
4) District Energy - microgrids that for multiple facilities can provide electricity and thermal energy for heating and cooling.
5) Nanogrids - defined as a single energy domain or a single facility that operates independently as a very small network.
The energy in microgrids that comes from DG can originate from both renewable and non-renewable energy technologies. Typical energy technologies that are used are photovoltaics, fuel cells, wind turbines, biomass, and diesel generators. When different sorts of technologies are integrated the whole system becomes a hybrid microgrid. DG can generate both AC and DC power, thus the hybrid microgrids have the advantage of producing both types (Nejabatkhah and Yun, 2015). A properly planned design is then necessary to integrate different AC/DC sources and loads. Patrascu et al. (2017) classifies the methods into three different categories; AC-coupled, DC- coupled and hybrid-coupled. In contrast to Nejabatkhah and Yun (2015), Patrascu et al. more emphasises the benefits with systems that are DC-coupled. In a configuration that is DC-coupled, energy sources are connected to a DC bus, and the bus voltage demonstrates the balance in the system. Several energy technologies (such as photovoltaics) naturally generates DC-current. Therefore, a more efficient connection can be obtained since the source can be connected directly via a DC/DC converter. But when the loads in the system needs AC,
23
or the microgrid is connected to the utility grid, a bi-directional converter is needed (Patrascu et al., 2017).
In remote rural areas, Eziyi and Krothapalli (2014) states that the most common systems are based on various combinations of wind turbines, photovoltaics and diesel generators. Nejabatkhah and Yun (2015) highlights benefits of diesel generators, since they can cope with other DERs intermittency problems. However, Hubble, and Ustun (2017) points out that by removing fossil-based power generation (where diesel is the most common) more than environmental benefits are gained; the implementation of diesel generators into a microgrid requires a costly infrastructure, such as road building, fuel transportation, technical understanding of storage and maintenance.
Nevertheless, excluding the implementation of diesel generators and only relying on REMS can be challenging for the operation of the microgrid. Shuaixun et al. (2012) points out some key problems that come with microgrids only driven by renewable sources (such as solar and wind). The first problem is how to balance the intermittency of renewable energy sources with the microgrid loads. According to Katiraei (2008) the microgrid can handle intermittency more easy when connected to the utility grid as the latter can supply or absorb power differences of the microgrid generated power, to balance the system. However, when the microgrid must work in island-mode the power balance can be maintained through different strategies. Pinpointing critical loads within the system is one strategy in order to reassure that vital services work. A type of load that does not need instantaneous energy supply are the deferrable loads, which energy demand can be postponed when power is lacking. Water pumps are an example of a deferrable load within a community microgrid since their function often can be postponed until the power balance is restored.
As mentioned earlier, diesel generators are commonly used in microgrids, and they have the capability of meeting a mismatch between loads and the distributed generation. However, when excluding non-renewable energy sources from a microgrid, Chen (2010) highlights the importance of a good energy storage system. The energy storage system can shave the peak demand or store surplus electricity from DGs and thus work as dispatchable sources. The storage system can contain batteries, fuel cells, supercapacitors or flywheels.
To maintain the function of the microgrid and the balance between the loads and the DG a good control architecture is needed. As pointed out earlier and additionally by Rat (2018), fluctuations and weather dependent renewable energy sources pose a challenge to the balance of the system, as well as the cost of the equipment. Therefore, the author presents two different management approaches. The first approach is focusing on supply management and differ if the microgrid is isolated or not. The supply management intends to program the production of energy sources so that they meet given constraints for the system. In the first case, when the microgrid is isolated, the costs in order to meet the technical requirements are being minimised. In the second case the operating costs are being minimised and the profit of the DG, when selling to the grid, is being maximised.
24
The second management approach refers to decisions made with the intention of reducing the energy consumption from the local grid. Load control is part of the demand management and handles how to dispatch the generated electricity and prioritise the different loads. A common dispatch strategy is to always let the DGs operate at full power and serve the primary load. The surplus power can go to the lower prioritised objects, such as serve the deferrable loads or charging the storage system (Rat, 2018). Usually a controller makes decisions regarding the management of the system. Depending of the size of the microgrid, different control structures can be used. For smaller microgrids, sometimes only one controller is needed. When the microgrid is bigger, it can be divided into smaller subsystems.
25
3. Methodology and data
This chapter presents the different aspects of the methodology and data selection. A perhaps more traditional approach is to allow them two different chapters, since they represent different procedures where the methodology precedes and determines the data selection. It was decided to merge the subjects to one chapter since the work process partially has followed the opposite sequence. Prior to a field study it can be hard to predict what type of data that will be available. The field visit allows the researcher to determine the available data in a way that can be more difficult or at times impossible from afar. Sometimes one has to accept suboptimal data due to unexpected difficulties in acquiring the preferred. This turned out to be the case in a couple of instances in this project (primarily with the grid data acquisition), and when there is a lack of directly applicable data one must be creative. It was therefore considered most suitable to present the methodology and data together.
The chapter consists of 3 sections. Section 3.1 describes the model-related features with selection of optimisation software, the model creation and the outline of the result presentation. Section 3.2 presents the acquisition of the different inputs and how it was decided. Lastly, the sensitivity variables are presented in Section 3.3.
3.1 Modelling procedure and simulation outline
The aim of the study was to investigate how REMS should be designed to optimally enhance the resilience of Cuna de la Paz. Resilience is conceptualised as the energy- affordability and reliability. The key measurements of the REMS performances are therefore metrics that represent the total cost of the electricity over the system lifetime and the amount of the demanded total load that is being satisfied. In Section 3.1.2 the applied metrics are motivated. Another aspect of energy reliability is to examine the possibility for a self-sufficient REMS, where the community can rely entirely on the local system for the electricity consumption and thereby does not have to depend on the main grid performance. It can be seen as an energy assurance if the REMS can satisfy the load demand entirely by local renewable production. Therefore, this reliability aspect was also taken into consideration in the study. Section 3.1.3 Result outlines how the simulations were motivated and structured.
The study setup needs to be carried out as a balance act where local information and viewpoints are set against academic conventions. This understanding has been considered in the data collection and modelling- and optimisation processes and has led to an approach emphasising the use of local primary sources in the data collection, while the modelling and optimisation has followed established conventions in the hybrid energy system evaluation field.
26
3.1.1 Modelling and optimisation in HOMER Pro
Since the strive was to create and optimise the REMS model in a procedure similar to other studies in the field to make the results comparable, it was regarded as preferable to utilise a widely used integral software for the purpose. Evaluating affordability and reliability in REMS-models is a task that in itself is rather complex since various aspects need to be considered (such as different production setups, control system designs, grid performance, etc.) and thus leaves a wide range of design decisions and parameter selections to be estimated. Models created from scratch in softwares such as MATLAB or Python give the designer a full degree of freedom in the design which certainly can be of interest in projects where the subject of study is the performance of specific technical setups. This study however aims to evaluate optimal REMS setups on a more general level, which therefore makes a broadly used integral software for the purpose a suitable selection.
By examining the field of REMS evaluation in different site-specific cases it becomes clear that one specific modelling- and optimisation software is frequently used (for example in Hubble and Ustun (2017), Sawle et al. (2017), Panhwar et al (2017), Frisk (2017), Li et al. (2018), Glania et al. (2016) and Silva (2011)): HOMER Pro, provided by HOMER Energy LCC and originally developed at the National Renewable Energy Laboratory (NREL) (referred to as simply HOMER in the report). The acronym stands for Hybrid Optimisation of Multiple Energy Resources and its website states: “The
HOMER microgrid software navigates the complexities of building cost effective and reliable microgrids that combine traditionally generated and renewable power, storage and load management. (…) HOMER is the established global leader for microgrid design optimisation and feasibility.” (HOMER Energy, 2019). Sinha and Chandel (2014)
describe the edge of HOMER in comparison to other similar softwares as its simulation engine, which is designed to handle denser simulations, along with the possibility to combine off-grid and on-grid applications (which also is highlighted by Mishra et al. (2016)). Zahraee et al. (2016) points out the software's ability to construct sophisticated sensitivity analyses with various factors. Those aspects are critical for a study like this, where the objective is to investigate optimal microgrid designs for resilience provision from a variety of approaches, and thus requiring the possibility to simulate multiple setups with various sensitivity cases.
HOMER simulates the system combinations, presents the configurations based on optimal economical result and provide sensitivity analyses for the defined sensitivity variables. The simulations are made with all allowed component sizes for all component combinations. In each time step, energy balance calculations are made where the energy demand and supplies (of the different sources) determine the flow between the components. In systems where non-momentary units are included, such as generators and batteries, the applied control parameters decide the components behaviour. Based on the selected performance specifications which give the user the option to regulate the simulations (such as allowed capacity shortage which was utilised in this study) the system configurations that do not fulfil the criteria are discarded. The total system cost
27
over the specified lifetime for the eligible system combinations (including capital, replacement, operation and maintenance and fuel) are estimated as the Net Present Cost (NPC), a metric that is regarded as the primary economic figure and on which the optimisation is based. NPC is estimated as the total lifetime costs minus the present value of all the earned revenues over the system lifetime with a real discount factor that accounts for the change of value over time. HOMER presents the optimal system combinations and the optimal component sizes sorted on lowest NPC. The same procedure is made for every sensitivity case, and the results are presented as a hierarchy of the optimal system combinations for each sensitivity case. Various metrics such as levelised cost of energy (LCOE), payback time and capacity shortage are included in the presentation of each simulation.
3.1.2 System modelling
The Cuna de la Paz project was described in section 2.3.1. The cooperative structure that marks the project brings a combination of collective and private property which has implications for the ownership of the microgrid system. The ownership and economic benefit structure of the implemented REMS can be arranged in different ways. A setup which would go well together with the purpose of the project (and also with this study) to facilitate the situation for the cooperativists would be to fund the system centrally (a work suited for FUNDASAL), while the self-produced energy would prosper the cooperativists directly through cheaper electricity bills. There are certain trade-offs that would need to be resolved, not least the balance between the central ownership and the provided benefits to the households. These ownership issues are outside the scope of this study, nevertheless they need to be considered for the modelling. To not complicate matters more than necessary the community was modelled as one unit. That is a simplified approach, since the project will at least consist of 62 privately owned houses along with the cooperatively owned community center, water pumps and public lighting. However, modelling as a single unit has substantial benefits. Most importantly it provides simple and easily understood metrics for the performance of the whole system (including the total production, storage, control units and loads), which is desirable when investigating the potential on a general level. Besides, HOMER is not designed to handle a wide range of electrical load profiles or complex ownerships. Regarding the advantages that the software brings, the best suited choice was considered to simplify the community to one unit containing everything. The disadvantage is that this setup does not clarify how each cooperativist reaps the benefits of (supposedly) cheaper electricity. But again, that would not be possible since the ownership structure is not yet specified.
The constructed process model is adapted to suit with HOMER and is presented in Figure 18.
28
Figure 18. Schematic representation of the optimisation procedure.
The green boxes represent the various input factors that were the basis for the optimisation in HOMER that is illustrated by the yellow circle. The result of the optimisation is represented by the blue box where both the optimal system combinations and the different sensitivity analyses are provided. The purple box shows the information that is presented about the optimal system of the different scenarios that are described in the following sections. The selected data resolution was hour-based, since it makes the simulations run-time manageable (unlike the minute-resolution profiles tried, which demanded multi-hour run-times for simple setups).
The optimisations were executed with regard to net present cost (NPC) since it is an integral economic figure that takes all costs and revenues of the system lifetime into account and therefore fully accomplishes the measurement of the energy affordability aspect (very straight forward since HOMER’s optimisation is based on NPC). To account for the energy reliability, the constraint of a maximum (yearly) capacity shortage is added. In HOMER, capacity shortage is defined as the difference between the required operating capacity and the available operating capacity in each time step. The required operating capacity is the load added up with the by the user chosen operating reserve (which is a safety measure to ensure that the system has marginals to provide more power than precisely what is needed). The unmet load-metric was considered to be better suited to correspond to the energy reliability aspect of resilience, since it is defined strictly by the difference between the load and the provided operating capacity and thereby gives a measure of the exact amount of energy that the system has failed to deliver to meet the direct demand (see HOMER Energy (2018)). By setting the operating reserve to 0, the