Locating Solid Waste Landfills in Mafraq
City, Jordan
N.A. Al-Ansari
1,a, A. Al- Hanbali
2and Sven
Knutsson
31&3Department Civil, Environmental and Natural Resources Engineering, Lulea University, Sweden
2
NIPPON KOEI CO., LTD,2, Kojimatchi 4-chome, Chiyoda-ku, Tokyo 102-0083 JAPAN
anadhir.alansari@ltu.se
Article Info
Received: 10th December 2011
Accepted: 5th January 2012
Published online: 1st March 2012
ISSN 2231-8844 © 2012 Design for Scientific Renaissance All rights reserved
A
BSTRACTProtection of the environment from solid waste hazards is becoming a serious problem. Different laws and legislations had been put into practice for this purpose. The effect of solid waste in countries like Jordan with limited financial and natural resources and high population growth rate is more severe. To overcome these difficulties, prudent management system for solid waste is required. Furthermore, solid waste disposal site should be selected using scientific criteria to prevent any harmful effect on local communities and the environment. Criteria for solid waste disposal dump site for Mafraq city were selected in accordance with well known international requirements that suit the local conditions. These criteria were used to select the best suitable solid waste dump site using remote sensing and geographic information system techniques. The selected sites are harmless to human life, natural resources and the environment.
Keywords: Landfill, Mafraq, Jordan. Solidwaste
1. Introduction
Human activities (Industrial, domestic, commercial and construction) and animals generate solid waste in many forms. Some of the waste fall out of the commercial use i.e. can not be utilized. Parts of this waste (specially the industrial part) are considered hazardous to the environment and natural resources. With continuous population growth and increase of standard of living, solid waste is increasing in tremendous amounts. This fact enforced a major problem facing the world.
The problem is more serious in third world countries where 80% of the world population live (Pearce and walker, 1996, Jackson, 1996) and due to the lack of financial resources. It is believed that about 10% of each person's production life is lost as a result of waste related diseases (Pearce and Walker, 1996). These facts led to an increasing awareness of solid waste hazards on an international level. Consequently, legislations and laws developed since the mid of the twentieth century (e.g. UN conference in Stockholm, 1972; Earth Summit in Rio de Janeiro, 1992, in Aldiab, 2000). The overall objectives of such measures are to ensure
41
sustainable development and management of waste in sound manner to minimize its effects on human and the environment.
This research deals with the use of remote sensing (RS) and Geographic Information System (GIS) to select the best possible dumping sites for solid waste in Mafraq area, Jordan. The selection of these sites will ensure that ground water resources and the environment will not be affected due to the existence of these sites.
2. Solid waste in Jordan:
The source of solid waste in Jordan can be attributed to the following sources: a. Municipal Residential waste
b. 2-Commercial waste
c. Residual waste from waste water treatment plants d. Industrial waste
e. Institutional waste f. Agricultural waste.
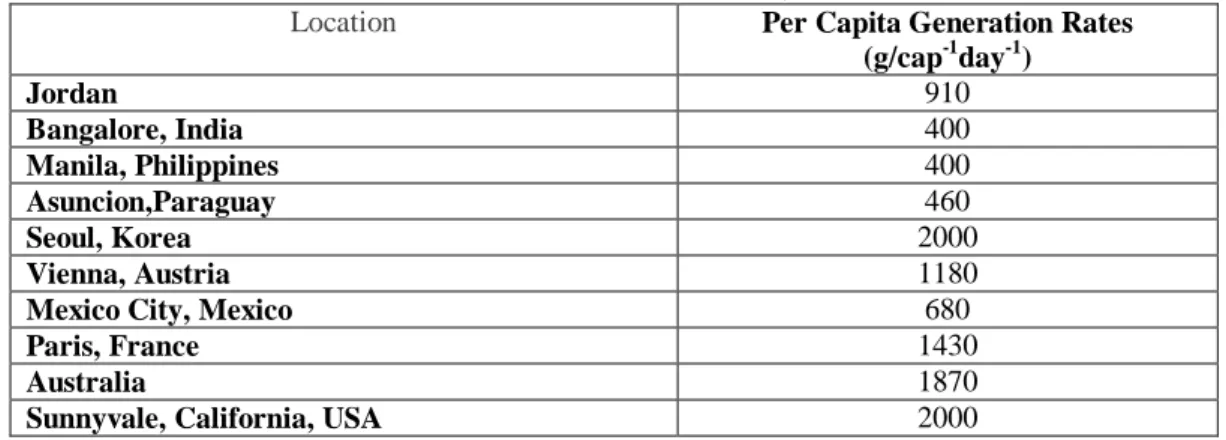
The average waste is in the range of 0.34 to 1.07 kg/Ca/day (average 0.91 kg/Ca/day) as shown in Table 1.
Table 1: Comparison of solid waste generation rates in Jordan with other countries (Chopra et al., 2001)
Location Per Capita Generation Rates (g/cap-1day-1) Jordan 910 Bangalore, India 400 Manila, Philippines 400 Asuncion,Paraguay 460 Seoul, Korea 2000 Vienna, Austria 1180
Mexico City, Mexico 680
Paris, France 1430
Australia 1870
Sunnyvale, California, USA 2000
This figure corresponds to similar figures in developing countries but they are far less than it is in developed countries (Table 1).Furthermore, most of the solid waste (50 – 68%) is of organic nature (Table 2).
Table 2: Comparison of the Jordan Solid Waste contents with other Countries (GCEP, 2001)
The percentage per weight
Waste Kind Jordan Asian Countries UK USA
Organics 50-68 75 3.6 20
Papers 5-10 2 31.2 43
Metals 3-6 0.1 5.3 7
Glass 2-5 0.2 3.8 9
42
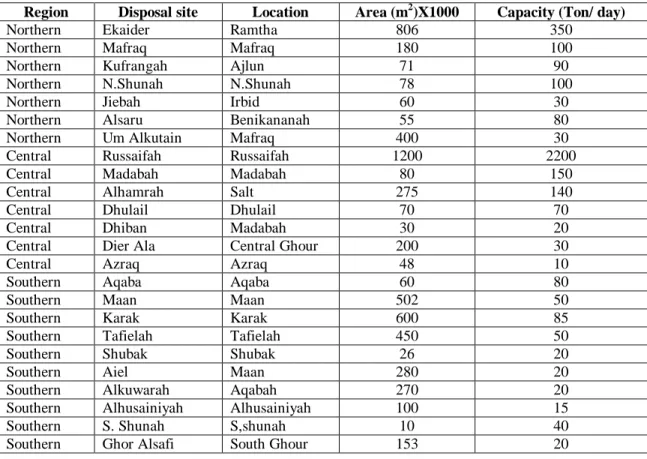
The average daily municipal waste in Jordon is about 3700 ton/ day. All solid waste is dumped in 24 sites. Seven sites (in the northern parts of Jordan) are receiving a daily average waste of about 680 ton/ day. In the central and southern parts of Jordan the daily average waste received is 2620 and 400 ton/ day respectively. These amounts are received by 17 dumping sites (Table 3) in central (7 sites) and southern (10 sites) parts of Jordan.
Table 3: Solid waste disposal sites in Jordan (Chopra et al, 2001)
Region Disposal site Location Area (m2)X1000 Capacity (Ton/ day)
Northern Ekaider Ramtha 806 350
Northern Mafraq Mafraq 180 100
Northern Kufrangah Ajlun 71 90
Northern N.Shunah N.Shunah 78 100
Northern Jiebah Irbid 60 30
Northern Alsaru Benikananah 55 80
Northern Um Alkutain Mafraq 400 30
Central Russaifah Russaifah 1200 2200
Central Madabah Madabah 80 150
Central Alhamrah Salt 275 140
Central Dhulail Dhulail 70 70
Central Dhiban Madabah 30 20
Central Dier Ala Central Ghour 200 30
Central Azraq Azraq 48 10
Southern Aqaba Aqaba 60 80
Southern Maan Maan 502 50
Southern Karak Karak 600 85
Southern Tafielah Tafielah 450 50
Southern Shubak Shubak 26 20
Southern Aiel Maan 280 20
Southern Alkuwarah Aqabah 270 20
Southern Alhusainiyah Alhusainiyah 100 15
Southern S. Shunah S,shunah 10 40
Southern Ghor Alsafi South Ghour 153 20
Site selection criteria in Jordan did not take into account the effect on the environment and natural resources. Examples of such sites are Russaiyfa waste disposal site where it is located on a phosphate mine. This mine in turn is underlain by an important groundwater aquifer. In general all the sites receive untreated medical and industrial waste. In addition, within these sites no liner systems are used. Other sites however, burn the waste in open air
as in Fig.1 or used as open dump as shown in Fig.2 and Fig.3.
Fig.1: Burning waste at a dumping Site (Chopra et al, 2001)
Fig.2: Open dump site for solid waste (Chopra et al, 2001)
43
In view of these conditions the Environment Conservation Organization reported the environmental conditions and possible solutions for the existing problems within these sites (Chopra et al., 2001).
Management practices of solid waste are not performed in a prudent way. Recycling and waste selection for reuse is performed by locals (Fig. 4) before compaction. As an example 98% of glass bottles are returned back to manufactures. Recycling exercise is becoming more
important with time where a number of items are picked and used again in various industries.
Fig.3. View of a solid waste dump site (Chopra et al, 2001
Fig.4. Manual waste selection (Chopra et al, 2001)
Solid waste management and disposal sites in Jordan are poorly operated. These sites are source of potential hazards to the public, natural resources and the environment. Lack of regulations, national waste management policy or guidelines makes the problem worst. In addition, the problem becomes more sever with the lack of financial resources and lack of trained personnel and the absence of any adequate records concerning quality and quantity of solid waste.
3. Solid Waste in Mafraq:
Mafraq city is located in the northern part of Jordan (long 36 7'30 "E lat 32 15- 32 22' 30" N) about72 Km north of Amman as shown in Fig 5.
44
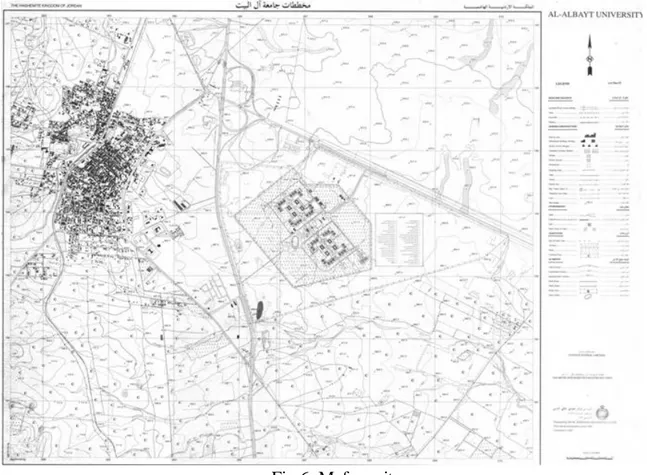
Mafraq Governorate covers an area of 26435 square km while Mafraq city area is about 46 square km (Fig 6) which is characterized by its relatively flat topography (Al-Ansari and Baban, 2001). The total population of the Governorate in the year 2000 is 232300 (Statistics Department, 2000) while 47105 people live within Mafraq city. The rate of population growth reaches 3.93%. About 40% of the area of the city is used as residential purposes while 52% is used for agricultural purposes. The remainder is used for commercial, industrial public buildings etc (Table 4).
Fig.6. Mafraq city
Table 4: Land use in Mafraq City
Type of USE Area m2X1000 %
Residential 9130.6 39.9 Agricultural 11988.3 52.3 Commercial 490.1 2.14 Industrial 471.5 2.1 Gardens 51.2 0.2 Public Buildings 279.2 1.22 Cemetery 66.6 0.29 National parks 43302 1.9 Total 22910.6 100.00
Eight types of solid wastes can be recognized in Mafraq. They are: residential commercial, industrial, agricultural, housing construction, institutional, municipal and waste water treatment plants. Within the city daily waste reaches 44tons, and ordinary residential
45
and commercial waste forms more than 80% of the overall average (Table 5). The daily waste management is done through126 employees using 16 types of vehicles and 400 rubbish containers. The cost of management and disposal for each ton of waste reaches 16.6 JD.
Table 5: Type of waste in Mafraq City
Waste type Daily Rate (ton)
Residential 19
Commercial 17
Institutional 5
Municipal 3
Total 44
4. Mafraq solid waste disposal site:
Mafraq solid waste disposal site was constructed in 1986 covering an area of 180000m2.
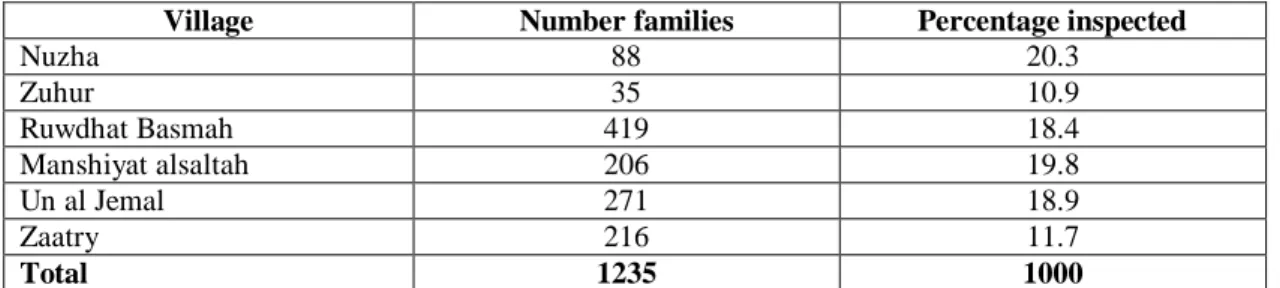
Forty seven persons run this site. The site receives 134 tons of waste daily from 64 villages including Mafraq city. The cost of solid waste treatment reaches 4.3 Jordanian Dinnars(JD) per ton. Selection of individual waste is executed manually and the remainder is dumped and covered by 50 cm layer of soil. Six main villages are situated within the vicinity of the disposal site (Table 6).
Table 6: Villages near Mafraq solid waste disposal site
Village Number families Percentage inspected
Nuzha 88 20.3 Zuhur 35 10.9 Ruwdhat Basmah 419 18.4 Manshiyat alsaltah 206 19.8 Un al Jemal 271 18.9 Zaatry 216 11.7 Total 1235 1000
According to the survey conducted by the authors (Tables 7 and 8), it was noticed that the site enhanced the existence of different types harmful creatures, relative to other areas (Table 7).
Table 7: type of creatures within the vicinity of Mafraq solid waste disposal site
Type Location
Nuzha Zuhur R. Basma M.Alsultah U. Jemmal Zaatri
Insects 33.7% 27.8% 37% 41% 40.9% 47.7
Fly 34% 22.7% 36.1% 34.4% 39.8% 46.3
Mice 10.7% 13.3% 3.8% 8.7% 7.7% -
Worms 18% 2.9% 15.4% 15.9% 11.6% 6.%
All above 3.6% 33.3% 7.7% - - -
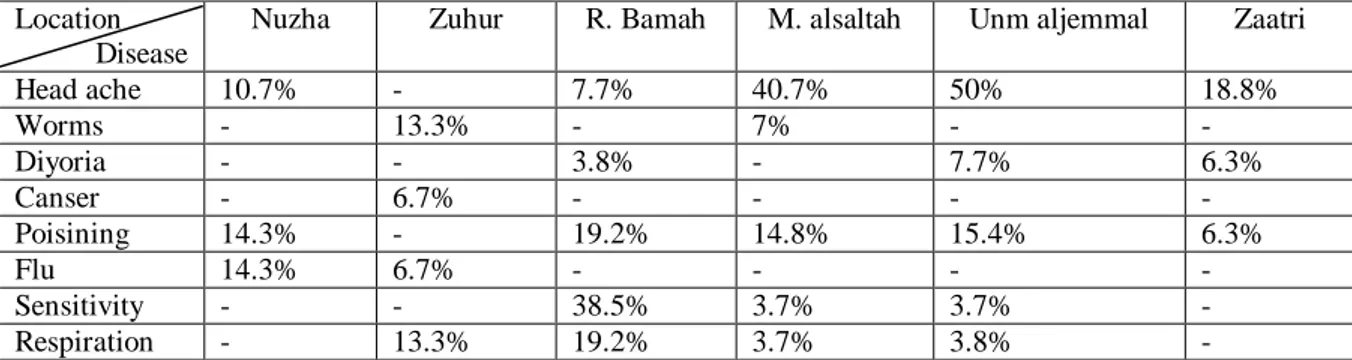
In addition it was found that these communities suffer from different types of disease (Table 8). Places closer to the site was found to be highly effected relative to other places. During summer the negative effects of the site are more pronounced.
46
Table 8: Type of sickness distribution near the solid waste disposal site
Location Disease
Nuzha Zuhur R. Bamah M. alsaltah Unm aljemmal Zaatri
Head ache 10.7% - 7.7% 40.7% 50% 18.8% Worms - 13.3% - 7% - - Diyoria - - 3.8% - 7.7% 6.3% Canser - 6.7% - - - - Poisining 14.3% - 19.2% 14.8% 15.4% 6.3% Flu 14.3% 6.7% - - - - Sensitivity - - 38.5% 3.7% 3.7% - Respiration - 13.3% 19.2% 3.7% 3.8% -
(% represents the answers detained from the questioners)
5. Solid Waste Site Selection Using Remote Sensing (RS) and Geographic Information Systems (GIS)
One of the biggest challenges is the proper site selection for solid waste disposal for its direct effect on the community and the environment (Davis and Cornwell, 1991). For this purpose the United States Environmental Protection Agency set in November, 1993 principle outlines to be considered in this process. These outlines are discussed in details in EPA (1993) and Techobanoglous et al (1993).
Remote sensing and GIS techniques are very useful tools to be used for solid waste dump sites. For this reason these techniques were used to select the best possible dump site within the vicinity of Mafraq city. This was achieved using 18 aerial photographs (scale 1: 10000) taken in the year 2000 to construct the data layers showing roads and extension of Mafraq city as shown in Fig.7 and Fig.8.
Fig.7. Aerial photograph of Mafraq city Fig.8. Compiled Aerial photograph for Mafraq
47
In addition topographic (Royal Geographic Center, 1997, scale 1:50 000), geologic (Natural Resources Authority, 1997, scale 1:50 000) and land use maps (Royal Geographic Center, 1998, scale 1:5 000 and 1:75 000) of various scales were also used. Other data concerning ground water wells, water table depth and meteorological data were obtained from the files of the Ministry of Water and Irrigation. All the maps used were digitized using different software (Auto CAD 14”Autodesk Inc 1982-1997-USA”, Arc/ Info 7.2., and 8, Arc View 3.1, Arc View Spatial Analyst “Environmental Systems Research Institute, Inc, USA, 1998” and Geomedia Professional 4.0 “Intergraph Cooperation, 2000”) and (Figures 9 to 14) show the results of these maps.
Fig.9. Digitized geologic map of Mafraq Fig.10. Digitized topographic map of
Mafraq
Fig.11. Digitized landuse map of Mafraq Fig.12. Digitized static water levels in
48
Fig.13. Digitized DEM model for the static water levels in wells for Mafraq
Fig.14. Rainfall distribution within Mafraq
The data used in the analysis were as follow: a. Topographic contours
b. Water drainage systems c. Roads
d. Geology
e. Type of land use f. Ground water levels
g. Rain intensity and distribution
All the maps were reconstructed in a "Grid" which is Raster Data composed of vertical and horizontal rows. This will enable Arc View 3.1 (Spatial Analyst) software to analyze the data. The conditions set for the analysis were based on the USA and EU regulations taking into consideration the special conditions related to the studied area. These conditions were: a. The distance of the dump site should exceed 500 m to the nearest village.
b. The dump site should be close to roads for easy access.
c. The rocks should be impermeable to ensure protection of ground water resources. d. The dump site should be at least 60m away from faults and joints.
e. Ground water should be deep enough to ensure protection from leaking material.
f. The dump site should be at least 500 meters away from the nearest ground water well to prevent pollution.
g. The area to be used as a dumping site should not fall within the category of agricultural land.
49
h. The site to be used should be at least 200 meters away from the nearest valley or drainage system to ensure that draining water does not transport the waste dumped.
i. The area to be selected should be nearly flat (slope should be less than 4). j. Average rainfall should be low on the selected site.
It is noteworthy to mention that the groundwater level was not taken into consideration. This is due to relatively very deep ground water level and the presence of number of impervious strata within the area preventing infiltrated surface liquids to reach ground water aquifers.
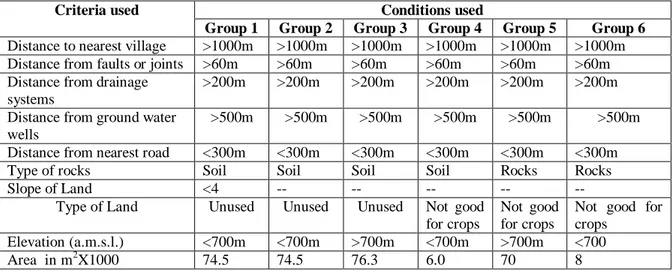
6. Results
Using the Arc View GIS (Spatial Analyst) different solid waste disposal sites (SWDS) were selected according to the conditions given. The first group represents the best site conditions relative to others as shown in Fig.15, where the most restrict conditions were applied as illustrated in Table 8 and Fig.15. Accordingly, ten sites were selected (Fig. 15) with a total area of 74.5000m2. Less restrictions were used for the remainder five groups (Table 9) concerning the elevations and type of rocks (Fig. 15) the overall selected sites
covers an area of about 235 5000m2.
Table 9: Site selection criteria for different groups for soil waste disposal sites
Criteria used Conditions used
Group 1 Group 2 Group 3 Group 4 Group 5 Group 6
Distance to nearest village >1000m >1000m >1000m >1000m >1000m >1000m
Distance from faults or joints >60m >60m >60m >60m >60m >60m
Distance from drainage systems
>200m >200m >200m >200m >200m >200m
Distance from ground water wells
>500m >500m >500m >500m >500m >500m
Distance from nearest road <300m <300m <300m <300m <300m <300m
Type of rocks Soil Soil Soil Soil Rocks Rocks
Slope of Land <4 -- -- -- -- --
Type of Land Unused Unused Unused Not good
for crops
Not good for crops
Not good for crops
Elevation (a.m.s.l.) <700m <700m >700m <700m >700m <700
50
51
7. Conclusion
Solid waste management and disposal in Mafraq city at its present status does not fulfill the required international conditions. Furthermore, high rate of population growth will inevitably makes problems more severs. Despite the fact that disposal sites had been found fulfilling the conditions set by the international community, other conditions concerning the management process should be fulfilled.
References
Al-Ansari, N.A. and Baban, S, (2001), The Climate and Water Resources, in: Baban, S. and Al-Ansari, N.A, (Eds.), Living With Water Scarcity, Water resources in the Jordan Badia Region, The Way Forward, Chapter 3, Al al-Bayt University Publication, Jordan.
Aldiab, S., (2000), The gap between planning and execution of environmental policies in Jordan: A case study of Jordan valley, M.A. thesis, Al al-Bayt University.
Chopra M, Reinhart D and Abu-El-Shaar W ,2001, US-Jordan Municipal Solid Waste Management Collaborative Research, FINAL REPORT
Davis M and Cornwell D (1998), Introduction to Environmental Engineering, WCB/McGraw Hill Series. Third Edition. Editor: George Tchobanoglous, University of California. EPA US-Environmental Protection Agency of United State, 1993, Municipal Solid Waste
Landfill Criteria. Found at: wysiwyg://15/http://www.epa.gov/epao
swer/non-hw/muncpl/landfill techman.
GCEP-General Cooperation for Environmental Protection (2001), Municipal Solid Waste Composition in Jordan.
Jackson, B., 1996, International Institutions, in Baily, R. (Ed), Water and Environmental Management in developing countries.
Natural Resources Authority, 1997, Geologic Map of Mafraq, scale 1:50 000.
Pearce, D. and Walker, Ch., 1996, Sustainable Development, in Baily, R. (ed), Water and Environmental Management in developing countries.
Royal Geographic Center, 1997, Topographic map of Mafraq, scale 1:50 000.
Royal Geographic Center, 1998, Land use maps of Mafraq, scales 1:50 000 and 1:75 000. Statistics Department, 2000, Annual Statistics Book, D.G. of Statistics, Government of
Jordan, Amman.
Tchobanoglous, G., Theisen, H., and Vigil, S.A., 1993, Integrated solid waste management. Mc Graw-Hill, Inc., New York.