1 Örebro University
Örebro University School of Business
Course name: Project Work (IK4002), Second Level, 15 ECTS Supervisor’s name: Åke Grönlund
Examiner’s name: M. Sirajul Islam Semester/date: 2014-06-02
Improvement of Information
Infrastructure for the North Hebron
Directorate of Education
A Study on schools needs of e-Services in the new pedagogical
Information Infrastructure at Directorate of Education in north Hebron, Palestine.
Salem Albadawi 830215 Badawi_saelm@yahoo.com
2
Abstract
e-Services may reduce the cost and time of the manual correspondent system used at the North Hebron Directorate of Education, and improve the Educational process. This paper aims to study the Information Infrastructure in the NHDE and the e-Services needed by the schools. The study is based on a conceptual framework designed by using the Primitive Interrogatives of Zachman framework as a starting point. With the intention to collect data about schools’ readiness and the needed e-Services, two methods of data collection were used in the form of a survey and interviews. The findings show that schools are still not ready for e-Services but there are plans for improvement in the future. The findings also show that there are significant reasons for implementing e-Services. In addition to that, the Information Infrastructure can be improved with several suggestions that are provided by schools, but different problems may affect the implementation of e-Services as mentioned in the study.
Introduction
Pironti (2006) defined the Information Infrastructure “as all of the people, processes, procedures, tools, facilities, and technology which support the creation, use, transport, storage, and destruction of information.” From the e-government prospective e-Service means that citizens or organizations interact with public administration through ICT, (Goldkuhl & Persson, 2006).
There are different widely used e-Learning tools like Blackboard, MetaLinks, DCG, Lotus Learning, MoodIe, etc. some of these tools provide the ability for content sharing and communication between users, these tools have problems with adaptability of the course contents, whereas, others have problems with flexibility of user interactions, (Sultana & Sultana, 2010).
The improvement of Information Infrastructure by providing e-Services is important to take advantage of the benefits offered by the use of e-Services like reduce personal interaction (Meuter et al., 2000), the ability to apply more control over services (Zhu et al.,2002). The e-Services have many other advantages when applied to the public sector. For example, the services are accessible whenever and whatever the individual needs leading to saving time and money and the ability to tailor the delivery of the service (Gilbert et al., 2004). The e-Services in education may have positive impact in the development of education by providing educational materials and teaching aids to students and teachers. The e-Services can also provide online training for teachers without the need to travel to the Directorate.
According to the Department of General Education at the Directorate, the North Hebron Directorate of Education (NHDE) is responsible of 97 public schools and 13 private schools in 11 cities and villages, spread over an area of 400 km2. From the author experience during his work at the Directorate he observed that the current system of correspondence is paper based, the directorate writes a letter with the request of information, send the letter to the school, waits for the response, and sometimes they use phone calls to request information, but the response should be provided in a formal letter. Moreover, for services (like instruction, teacher training, educational materials) provided by the Directorate to the teachers and school
3
administrators wastes time and money since they need to travel to the Directorate, and this leads to losing classes by students.
The Directorate of Education consists of three levels of administration. The first level is the ministry departments, the second is the directorate departments, and the last is the schools’ administrations. The Directorate has 18 departments; each department is linked to a general directorate at the ministry level. For example, the Department of Financial affairs is linked to the Directorate General for Financial affairs at the ministry level. The responsibility of software and hardware development is divided into two levels. The first level is IT department at the directorate which is responsible for technical issues within the directorate -is more technical department than IT department - and the IT department at the ministry of education which is responsible for technical issues within the ministry and the connectivity with the directorates. There is Information Infrastructure to connect the directory with the Ministry of Education and for data processing within the directorate, but this Infrastructure does not provide any services to schools digitally. All services are provided through the Directorate departments manually.
Research Question
The research question is:
What Information Infrastructure improvement is needed by providing e-Services to schools at the NHDE?
In order to answer the research question, it was operationalized in three manageable sub questions:
1. What is the readiness of schools for e-Services? 2. Why do schools need e-Services?
3. What e-Services do they need?
Method
This project aims to study the Information Infrastructure in the NHDE, and the e-Services needed by the schools. Quantitative data was collected by means of a questionnaire and the qualitative data was collected by open questions in the questionnaire as well as by interviews. The study was conducted using inductive approach, with predefined conceptual framework for data collection and analysis. This framework uses the Primitive Interrogatives of Zachman framework as a starting point for open investigation about schools’ needs for e-Services and problems that can be solved using e-Services.
The open investigations usually start with survey based on interviews to collect the primary data that will be tested via the questionnaire like (Chanopas et al., 2006), but due to the limitation of time and number of words this was impossible, as well as, prevented the author from conducting other survey with close questions to collect quantitative data to validate findings from wider prospective. Further researches are recommended using the findings of this investigation as a starting point.
In the following, the paper clarifies the conceptual framework and shows the relationship between the conceptual framework and the research question operationalization. After that, the conceptual framework is shown, and the methods of data collection are described.
4
Conceptual framework
Zachman framework is presented in a table which contains 6 columns and 6 rows with a summation of 36 different cells, which represent elementary composites of any information enterprise architecture. The 6 columns represent the six Primitive Interrogatives (PI) (what, how, where, who, when, why), which will be used in this research as a starting point. The reason why those primitive interrogatives are used is to give a complete and comprehensive knowledge about everything in the field (Zachman, 2014). The six rows represent audience perspectives which are planner, owner, designer, builder, subcontractor and user, which are a set of transformation from Ideas to implementation, (Zachman, 2014). The rows of Zachman framework were not used as the aim of this investigation is to collect ideas about e-Services needed by schools, not to implement those ideas, which is not the purpose of the paper.
“What”, represent the “object, subject, material, resource, information, and thing” (Letsholo et al., 2012). Which is in our case the computers and equipment, in additional to that the Knowledge of using those equipment, technical knowledge is not a part of Zachman definition of “what” but was investigated as part of it by Abdullah and Zainab (2008) as an answer for the question “Why”, the author found that it is more related to material than motivation for technology implementation. That is the reason for investigating it under “what”. “How”, represent “operation, process, function, activity, task and action” (Letsholo et al., 2012). In this case, it represents the services needed by schools. “Where” represents the Logistics or Network, which in this case represents the internet. “Who” represent the stakeholders. “When” represent the plans and time schedule. “Why” represents motivation, (Letsholo et al., 2012).
The PI questions from the framework were used in relation to the research question and its operationalization to develop the conceptual framework of the research (Table1), “What” and “Where” are related to the first sub question which is, “What is the readiness of schools for e-Services?”, in terms of technological knowledge, professional staff, equipment and connectivity. “Why” is related to second sub question which is “Why do schools need e-Services?” which aims to find motivation for the development of the Information Infrastructure, like problems with the current communication system and cost. “How” is related to third sub question which is “What e-Services do they need?” which aims to collect the e-Services needed by schools and discuss the ability of implementation. “When” PI question is not related to the research from the author prospective because this question is related to plans for implementation of schools’ suggestions, but the author tries to illustrate if there are plans for implementation that brighten up within the interview that discuss the suggestions with the IT department. “Who” PI which aims to collect information about stakeholders, the first stakeholders identified by the author are the schools represented by the Schools’ Directors that are responsible for the educational administration and the teaching process. Second stakeholder is the head of IT department that provides the author with information about the ability of implementing schools’ suggestions; stakeholders could be identified in the implementation stage. It is excessive effort to identify them at this stage.
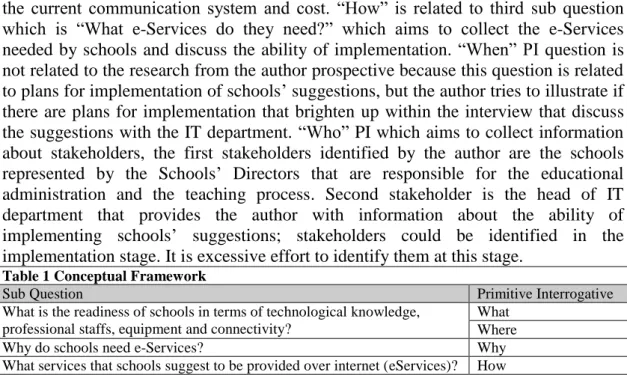
Table 1 Conceptual Framework
Sub Question Primitive Interrogative
What is the readiness of schools in terms of technological knowledge, professional staffs, equipment and connectivity?
What Where
Why do schools need e-Services? Why
5
The four remaining PI questions aim to collect data about schools reediness, current communication system problems and schools’ needs of e-Services and this was done by a survey distributed to schools with questions related to the operationalization of the research questions, this is clarified in the following:
1. “What” PI which aims to collect information about the schools reediness in terms of equipment, professional staff and technological knowledge. The mentioned equipment refers to the availability of computers, printers, and scanners. Number of teachers with a university degree related to computer science at schools is also collected to show the availability of professional staff, the technological knowledge was collected by asking the respondents about the frequency of technology usage, the technology that is mentioned refers to the equipment, some basic application (like text editing applications), websites and online services, (like social media websites, Forums, Blogs and email). Moreover, the respondents were asked to assess their technological knowledge with the intention to find the relation between the availability of the technology and the technology knowledge.
2. “Where” PI aims to collect information about connectivity, and because project aims to investigate the development of Information Infrastructure using e-Services, the main channel of delivering e-Services is the internet as defined by Reynolds (2000), Boyer et al. (2002) and Rowley (2006). Thus the respondents were asked about the availability of internet connection and the type of internet connection at the school. Both “What” and “Where” PIs are related to the requirement of e-Services which are a provider, a receiver and a communication channel, the main communication channel is internet (Rowley, 2006). To use the internet as a channel of communication, the user needs equipment, knowledge and internet connection.
3. “Why” PI aims to collect data about the motivation for Information Infrastructure improvement and providing e-Services. These data were collected by asking the school director about the problems of current communication system, questions were designed based on the benefits that can be obtained from providing e-Services. These benefits are to “avoid personal interaction, the ability to exert more control over services, the ability to receive the service how and when the individual wants to, saving time and money” (Gilbert et al., 2004).
4. “How” PI aims to collect suggestions from the respondents to solve the problems that are mentioned in the previous “Why” question part. Moreover the respondents were asked to suggest the needed e-Services to improve the work and /or improve the educational process in general.
Data Collection
As previously mentioned, two methods of data collection were used the survey and the interview. The survey consisted of open and closed questions in relation to the four PIs (What, Where, Why and How). The respondents of the survey are the school directors because they are responsible for both administrative and teaching work at the school.
After the survey was designed, it was tested with two administrative employees, a school manager, and the head of IT department. Notes were taken in consideration and the final version of the survey was distributed to schools by the formal mail box which is used to receive mail from the directorate (each school has a metal mail box at the directorate which is used to receive formal mail form the
6
directorate). The deadline was after ten days form the distribution, and the schools were asked kindly to send them to the Department of General Education (The department which is responsible for conducting research at the directorate).
After twelve days the survey was brought from the Department of General Education, the number of responses was 72 out of 97 schools. The 25 remaining schools were called by telephone and asked kindly to send the questionnaire in three days period. 15 more questionnaires were received to make the response rate 90%.
The second method of data collection was the interview that can show hidden interrelations between emotions, people, and objects that can be missed in questionnaire, (Weiss, 1994). Three interviews were conducted, the first was with the IT Department to collect information and discuss the schools’ suggestions and readiness. The second was with the IT supervisor to collect information about e-Learning systems and ICT training. The third was with the Training Department to collect information about the cost of teachers’ visits to the Directorate and the ability to implement video conference technology.
Data Analysis
Data collected from the survey was coded and analyzed in relation to the conceptual framework, the quantitative data was collected from the close questions that describe “What” and “Where”. The data from the open questions was also collected, summarized and categorized in two main categories. The first category is problem description which explains “why”. This category contains: 1) problems of visiting the directorate, 2) reasons of visiting the directorate, 3) problems in communication systems, 4) problems with delayed mail. The second category is suggestions to improve the school directors work and improve the education process using ICTs. On the other hand, data collected from the interview was based on the schools’ suggestions, each comment was summarized in relation to the suggestion.
In the result part, the author presents the findings in positivism manner, without interpretation trying to be objective and not biased to the fact that he works at the Directorate. On the other hand, in the analysis part, the author presents his interpretation supported with arguments from the findings.
Results
As we mentioned previously, the aim of the project is to show the schools’ readiness in terms of 1) Technical equipment and staff, 2) Computer and internet knowledge, which answer the first PI question (What). The results of the survey are shown in the following section.
Table 1 Number of Computers and Teachers
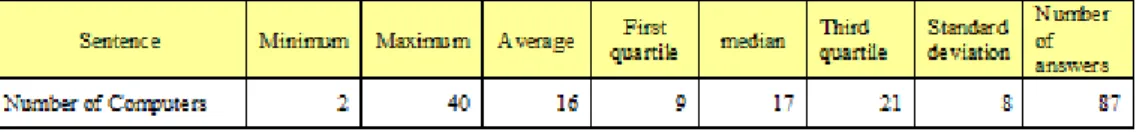
When surveyed, schools showed that the range of the number of computers available was between 2 and 40 with an average of 16 computers per school (Table 2). Schools were divided into four equal quartiles based on the number of computers available. Each quartile represents 25% of the total number of schools. For example, the first quartile consisted of schools which had less than 9 computers. The second quartile had schools which had between 10 and 17 computers. The third quartile
7
consisted of schools that had between 18 and 21 computers. The last quartile represents schools which had more than 21 computers. The median as shown table 2 is 17 computers which means that 50% of the schools have less than 18 computers.
Results show that 72% of the respondents have their own computers and the rest share the computer with other workers. Only one school does not have a printer, and 55% of schools have scanners. The results show that 21% of schools do not have any teachers with a university degree related to computer science (Table 3), and 22% of them have more than two computer teachers.
Table 2: Teachers with university degree related to computer science.
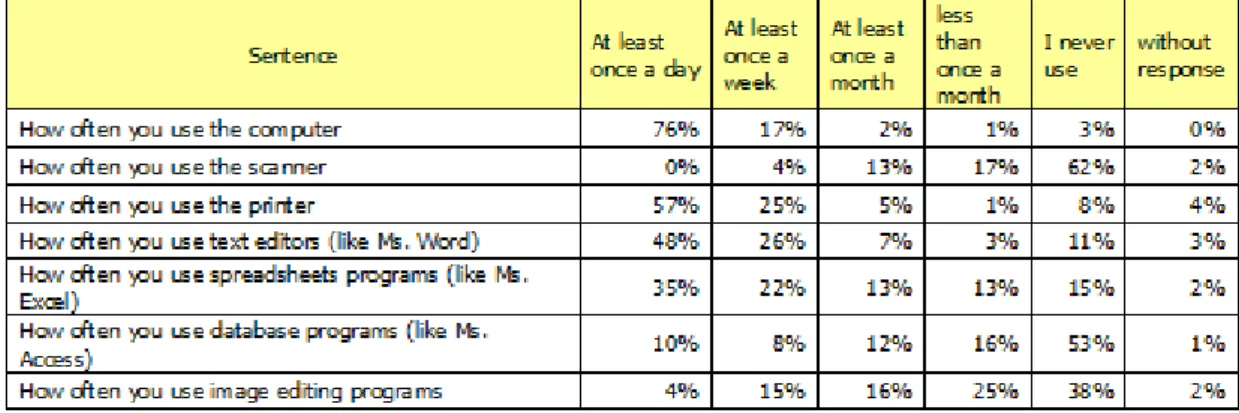
Computer and internet knowledge was measured by asking the respondents about the frequency of technology usage, the results show significant frequency of usage for computers, printers, text editors, and spreadsheets applications (Table 4). More than 50% of the respondents use them at least once a week. The items with low frequency could be a result of not needing to use them in their work or life.
Table 3: Computer Usage.
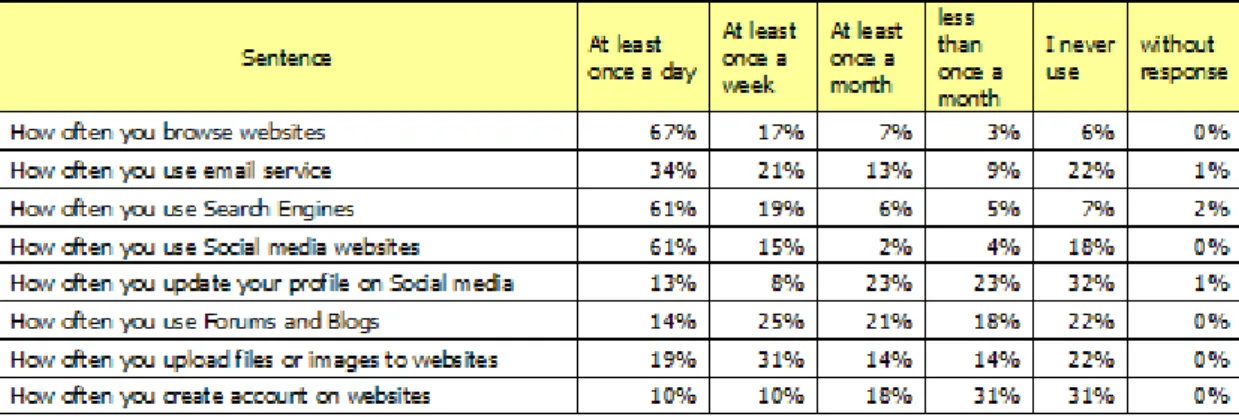
Results of internet usage show that more than 60% of the respondents browse websites, use search engines and social media websites at least once a day. On the other hand, more than 22% of the respondents never used email, uploaded files or images to websites, used Forums and Blogs, updated their profiles on social media. Creating accounts on websites is something that is rarely done but more that 31% of them never did this at all.
8
Table 4: Internet Usage.
The results show that there is no relationship between the availability of computers at home and how the respondents identify their computer knowledge (Table 6). The respondents without computers at home identify themselves with good or very good computer knowledge. On the other hand, there are respondents who own a computer at home but identify themselves with little or basic computer knowledge.
The same comparison between availability of internet connection at home and how the respondents identify their internet knowledge Table 7 shows the same thing. It seems that there is no strong relationship between the availably of computers or internet at home and how the respondents identify their computer or internet knowledge.
Table 5: Availably of computers at home and how the respondents identify their computer knowledge.
Table 6: Availably of internet connection at home and how the respondents identify their internet knowledge.
The responses to the availability of internet connection (Where) show that 67% of the respondents are connected to the internet, but a problem was found in the answers of question number 10, which is about the internet connection type, due to misunderstanding and lack of knowledge. It is found that 6% stated that they don’t know what type of internet connection they have. Others (20%) stated “wired or wireless” and a great number of them (33%) stated “ADSL or DSL”, and a small
9
number of them (8%) avoided the answer, and by asking the IT department, it was found that the internet connection is ADSL 4 Mbps for all the schools that are connected to the internet.
Second part of the survey aims to collect qualitative data about the motivation for Information Infrastructure improvement and e-Services providing (Why). Because of this, the survey was designed with open and close questions that ask schools to state their problems with the communication system in terms of cost, time and effort. The final results show the following:
1. Results show that 37% of respondents find the visit to the directorate problematic or affect their work, where 37% visit the directorate more than 20 times per semester, 9% of them visit it from 16 to 20 times, 15% of the employees visit it 11 to 15 times, 24% of them from 5 to 10 times, and 14% of these employees visit it less than 5 times. The main reasons of the visits are (the listed reasons were stated more than ten times and arranged in descending order by the frequency):
Follow-up the mail delivery and bring them.
Attend meetings
Discuss matters relating to school with the departments of the Directorate, the departments that were stated are, the Department of Supervision Educational Qualifying, Department of Financial affairs, Department of Supplies, Department of Administrative affairs, and Diwan (department responsible for Correspondence).
Auditing
Discuss the formations of the school
The respondents stated several problems that affect the work of the school director because of his visits to the directorate like:
The change of the work plan and the change of daily agenda
Administrative vacuum where things may occur in the school which need the director to be present.
Director absence affect the discipline of the students and their behavior
Director absence leads to delays in work and accumulation
Director absence leads to stagger work
Irregularity of the educational process and affect the discipline of teachers
Missing classes in case the director is a teacher, too.
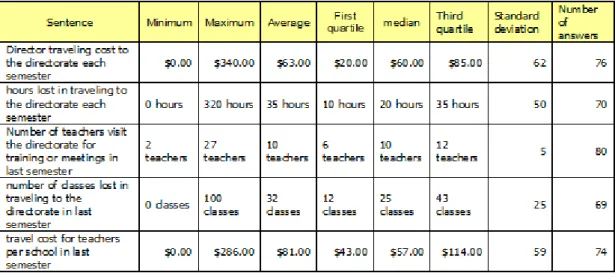
The following table shows the cost of traveling to the directorate in terms of money and time, the answers were in local currency and author used exchange rate of 3.5 for each USD.
10
Table 7: The Traveling Cost.
The Training Department said in the interview that 1,070 teachers visited the directorate in the last semester to attend 66 seminars with the supervisor to discuss and develop the curriculum, and 57 participants attended two courses with duration of 5 days each. These results show the amount of money and time spent on travelling to and from the Directorate which can be avoided by using e-Services to be invested in other educational practices.
2. Results show that 45% of the respondents find problems with the communication system between their schools and the directorate. and stated the problems as :
o The current system leads to delay in receiving mail and this leads to delay in receiving information.
o The difficulty in mail follow-up.
o Difficulty of accessing information and the lack of clarity
o Costly in terms of time, effort and money
o Difficulty with phone calls because of the pressure on the phone lines at the directorate and lack of a phone line in some schools.
o Loss of some correspondence
o Accumulation of mail from more than one department
o Frequent routines.
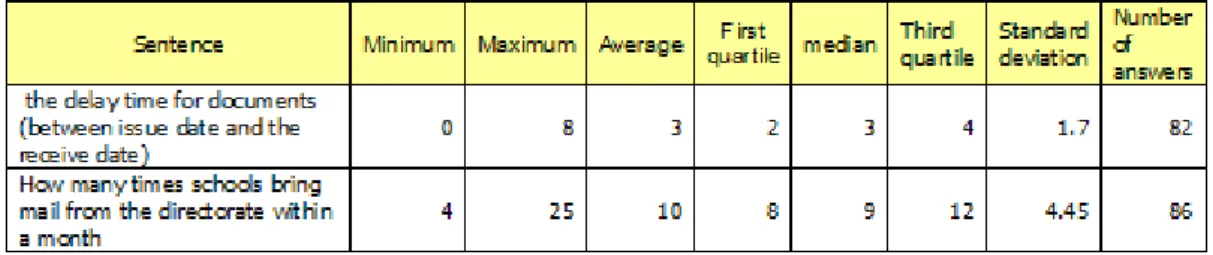
3. The results show that the average delay time is 3 days, and the average of fetching mail is 10 times per month as shown in Table 9. Whereas 76% of the employees find that there are problems which occur as a result of delaying receiving the mail. The respondents state several problems because of delaying receiving mail:
Sometimes they are not able to respond to mail on time, because the response date is so close
Sometimes the mail arrives after the response date
Delayed mail leads to increased pressure at work
Delayed mail leads to the accumulation of work
11
Table 8: Mail Delay
The last part of the survey is to collect respondent’s suggestions to solve communication problems and improve teaching process (How), all the suggestions were collected and summarized and the comments collected via interviews from the IT department and other departments are added to each suggestion. The results show the followings:
1. Setting up e-Learning system, by computerizing the Curriculum, improving the Curriculum using ICT, and Training students on ICT. The head of IT department said that there is e-Learning platform and the responsible for the platform is the IT supervisor, so an interview was conducted with the IT supervisor who said that there is e-Learning portal as a project founded form Belgium, this project is based on a contest among schools and the school that wins in this competition gets computers and equipment. This portal is not open to the public, but it requires a username and a password. Teachers can publish their work in this portal, but they have to wait until their work is approved form the committee at the Ministry. The problem with this portal as the IT supervisor said “there is no scientific committee at the Ministry of Education to evaluate teachers’ work”. The portal was visited and another problem was detected that the students cannot access the materials as they are required to be registered in the portal. A further obstacle for registration is that students are required to have an ID number, which is not available for students under the age of 16.
2. Setting up a portal that allows direct contact between schools and the Directorate of Education, and allows the directorate to publish the information and the new instructions, digitize files and records, and exchange digital data and information using electronic forms. The IT department said in the interview that there is a company that works now on a project called e-School which is a portal that links the directorate with schools, but the IT department does not know what services will be included in this portal at the end of this project, because the agreement was made between the company and the Ministry of Education. All they know about this project is that it improves the communication between schools and the directorate of education.
3. Create online database for schools’ libraries that allow students and teachers to search and find books in all the schools, and to allow students and teachers to borrow books from other schools. The head of the IT department finds this suggestion very useful, that the teachers and students can share books that are not available at their schools but available in other schools that belong to the same directorate.
4. Create website that allows schools to publish their achievements, exchange their experiences with other schools, and communicate with the local society and parents. The head of IT department said that the e-School project allows schools to publish their achievements, exchange their experiences with other
12
schools, and communicate with the local society and parents. Now 23 schools are connected to the project, but this platform is unused because “there is no green light to use the platform because this trial version is under development”.
5. Training of teachers and administrative staff to use the Internet and ICTs. Regarding training individuals at schools on the e-School platform, the head of the IT department said that the company that’s responsible for the development will train them after the project is completed. Other conducted training programs in collaboration with Intel, universities and non-governmental organizations included around 1000 teachers.
6. To use the email for communication between schools and directorate departments. The head of IT department said that almost all schools have email specially schools that are connected to the internet and schools that are involved in e-School project, but this service is not used because “there is no decision from the Senior Director to use it, because the email is not seen as a trusted medium of communication”.
7. To use video conference technology. The training department was interviewed and said that video conference is useless due to high cost, availability and speed of internet connection to all schools. Moreover there is no intention to use this technology. They said “Trainers and trainees will prefer meetings instead of sitting in front of the computer and typing”.
8. To improve the performance of computers, provide more computers, and provide internet connection to all schools. The IT department said “the performance is good and meets school’s needs”. Regarding providing more computers, they said that there is a plan to increase the number of computers in schools, but it depends on the budget. They added that in 2015, all schools will be provided with internet connection.
9. To use SMS to notify schools with new information. The IT department said “this service was active a couple of years ago but they stopped this service due to cost”. The IT supervisor illustrated that there are mobile phone calls service with low cost charge for communication between schools’ directors, but this service is useless as he said “to be useful it should be between the directorate and schools’ directors”.
10. To use social media for communication between the directorate and schools. The IT department said that this suggestion is really applied. There are two pages on Facebook. One of them is administrated by the IT department and the other is administrated by the Public Relations Department. They added that this idea is very useful in reaching their audience.
Analysis
As mentioned previously (Table 2) shows that the average number of computers at schools are 16, by comparing the number of computers with the size of schools represented by the number of teachers, a rareness of computers is found, only 27% of schools have the number of computers either equal or more than the number of teachers. Moreover, analysis shows rareness of teachers with a university degree related to Computer Science at the school, whereas 21% of schools do not have any teachers with a university degree related to Computer Science. This may mean that
13
class related to computer is given to unqualified staff. Moreover this may affect the maintenance of Computer Labs badly.
Other findings show 55% of schools have scanners, but 65% of schools that have scanners never used them at all. This shows that technology might be more useful when available and needed with the suitable knowledge on how to use it rather than providing it without a prior suitable training.
Through the analysis of the interviews’ results and schools’ suggestions, they featured many of the problems related to Information Infrastructure at the Directorate:
1. Problems in understanding the requirements of schools, the accessibility and usability of the services. This can be touched in e-Learning portal which is not open to the public and cannot be accessed by students as mentioned previously. Moreover, the mobile phone calls service with low cost charge didn’t accomplish the mission of connecting schools with the Directorate of Education.
2. Problem in communicating new plans and strategies. This is evident through the fact that most of the interviewed respondents didn’t even know what e-Schools project means. Moreover, they didn’t know the schools that are connected to the internet. Furthermore, the head of the IT department does not know what services would be included in e-Schools project.
3. Decision-making responsibility. This is evident through the fact that no one wants to take the responsibility of decision to try the new system. The Directorate of Education does not want to try the new e-School platform without a decision from the Ministry of Education.
4. Problems with the intention to use technology, performance expectation, and technology trust. This is featured in the intention to use email and video conference services and their performance expectations. In other words, the superiors in the Directorate of Education might be afraid of trying the new technologies as a result of lacking appropriate knowledge.
5. Low budget. This can be touched in the fact that the Directorate of Education stopped SMS service because of the low budget. Moreover, this low budget prevents improving computers performance and providing more computers.
Conclusion
The North Hebron Directorate of Education (NHDE) uses paper-based system for correspondence and communication with schools and people involved in the educational process. The implementation of e-Services may save time and money in information distribution, transaction and service delivery,( Lu, Bai & Zhang,2009). This project aims to study the Information Infrastructure in the NHDE, and the e-Services needed by the schools. In order to achieve this goal, a conceptual framework was designed based on Primitive Interrogatives of Zachman framework as a starting point. Conceptual framework was designed with the intention to collect data about schools’ readiness for e-Services and reasons why schools need e-Services and the type of e-Services that they need. Two methods of data collection were used; A survey to collect data from schools and interviews to discuss survey findings with the Directorate of Education’s Departments, findings show:
1. Deficiency of schools readiness illustrated by, rareness of qualified staff, computers and internet connection. But there are plans to improve schools readiness in the future.
14
2. There are significant reasons for implementing e-Services that address problems related to actual communication system, as well as the visit to the Directorate and the delay of mail.
3. Several suggestions were presented by schools to improve the Information Infrastructure like: e-Learning portal, communication portal, online database for schools’ libraries, to use the email and the video conference services, and others.
4. Different problems affect the implementation of e-Services like: a. Problems in recognizing the requirements, and the accessibility and usability.
b. Problems in communicating new plans and strategies. c. Problems in decision making
d. Problems with the intention to use technology, performance expectation, and technology trust.
e. Low budget.
This project provides a general view about e-Services needed by schools and the obstacles in implementing those services, which can be used as a base for further investigations in this domain in the future.
References
Abdullah, A., & Zainab, A. N. (2008). The digital library as an enterprise: The Zachman approach. The Electronic Library, 26(4), 446-467.
doi:10.1108/02640470810893729
Boyer, K.K., Hallowell, R. and Roth, A.V. (2002), E-services: operations strategy - a case study and a method for analyzing operational benefits, Journal of
Operations Management, Vol. 20 No. 2, 175-88
Chanopas, A., Krairit, D., & Khang, D. B. (2006). Managing information technology infrastructure: A new flexibility framework. Management Research News, 29(10), 632-651. doi:10.1108/01409170610712335
Gilbert, D., Balestrini, P., & Littleboy, D. (2004). Barriers and benefits in the
adoption of e-government. International Journal of Public Sector Management, 17(4), 286-301. doi:10.1108/09513550410539794
Goldkuhl, G. & Persson, A. (2006). From e-ladder to e-diamond - re-conceptualising models for public e-services. In J. Ljungberg & M. Andersson (eds.), ECIS 584-595.
Gustafsson, K., Fiedler, M., (2004). E-government: Services, needs and user satisfaction, Blekinge Institute of Technology, School of Engineering. Letsholo, K., Chioasca, E., & Zhao, L. (2012). An integration framework for
multi-perspective business process modeling. Paper presented at the 33-40. doi:10.1109/SCC.2012.29 Telecommunication Systems
Lu, J., Bai, C., & Zhang, G. (2009). Cost-benefit factor analysis in e-services using bayesian networks. Expert Systems with Applications, 36(3), 4617-4625. doi:10.1016/j.eswa.2008.05.018
Meuter, M.L., Ostrom, A.L., Roundtree, R.I. and Bitner, M.J. (2000), Self-service technologies: understanding customer satisfaction with technology-based service encounters, Journal of Marketing, Vol. 64 No. 3, pp. 50-64.
15
Pironti, J. P. (2006). "Key Elements of a Threat and Vulnerability Management Program". INFORMATION SYSTEMS AUDIT AND CONTROL ASSOCIATION 3: pp. 52–56.
Reynolds, J. (2000), The Complete E-Commerce Book: Design, Build and Maintain a Successful Web-Based Business, CMP Books, New York, NY.
Rowley, J. (2000), Loyalty kiosks: making loyalty cards work, British Food Journal, Vol. 102 No 5/6, 390-7.
Rowley, J. (2006). An analysis of the e-service literature: towards a research agenda. Internet Research, 16 (3), 339-359
Sultana, A., & Sultana, I. (2010). E-school: A web-service oriented resource based e-learning system. Paper presented at the 415-419.
doi:10.1109/ICNIT.2010.5508481
Weiss, R. S. (1994). Learning from strangers, the art and method of qualitative interview studies, New York, NY: Free Pr.
Zachman, J., (1987). A Framework for Information Systems Architecture. In: IBM Systems Journal, vol 26, no 3. IBM Publication G321-5298.
Zachman, J., (1997). Concepts of the Framework for Enterprise Architecture:
Background, Description and Utility. Zachman International. Accessed 19 Jan 2009
Zachman, J., (2011). The Zachman Framework for Enterprise Architecture- The Ontology.
Zachman, (2014). (2014, May 14). 2014 INTERVIEW WITH JOHN ZACHMAN. Retrieved from http://www.zachman.com/ea-videos/2014-interview-with-john-zachman.
Zhu, F.X., Wymer, W. and Chen, I. (2002), IT-based services and service quality in consurmer banking, International Journal of Service Industry Management, Vol. 13 No. 1, pp. 69-90.
16