Journal for Person-Oriented Research
2017, 3(1), 1-10Published by the Scandinavian Society for Person-Oriented Research Freely available at http://www.person-research.org
DOI: 10.17505/jpor.2017.01
1
Personalized Feedback on Symptom Dynamics of
Psychopathology: A Proof-of-Principle Study
Renske Kroeze
a,b,c,†, Date C. van der Veen
b,c, †, *, Michelle N. Servaas
b,c,d, Jojanneke A.
Bastiaansen
b,d, Richard C. Oude Voshaar
b, Denny Borsboom
a, Henricus G. Ruhe
b,c,
Robert A. Schoevers
b,c, & Harriëtte Riese
ba Department of Psychology, University of Amsterdam, PO Box 15906, 1001 NK Amsterdam, The Netherlands
b University of Groningen, University Medical Center Groningen, Department of Psychiatry, Interdisciplinary Center for Psychopathology and Emotion regulation, PO Box 30.001 (CC72), 9700 RB Groningen, the Netherlands
c University Center for Psychiatry, University of Groningen, University Medical Center Groningen, Groningen, Mood and Anxiety disorders, PO Box 30.001 (CC10), 9700 RB Groningen, The Netherlands
d University of Groningen, University Medical Center Groningen, Neuroimaging Center, PO Box 196, 9700 AD, Groningen, The Netherlands
† Theseauthors contributed equally to the manuscript. * Corresponding author.
Email address:
d.c.van.der.veen@umcg.nlTo cite this article:
Kroeze, R., van der Veen, D. C., Servaas, M. N., Bastiaansen, J. A., Voshaar, R. C. O., Borsboom, D., Ruhe, H. G., Schoevers, R. A., & Riese, H. (2017). Personalized feedback on symptom dynamics of psychopathology: A proof-of-principle study. Journal for Person-Oriented Research, 3(1), 1-10. DOI: 10.17505/jpor.2017.01.
Abstract:
Background and Objectives. In the proposed symptom network approach to psychopathology, psychiatric disorders are assumed to result from the (causal) interplay between symptoms. By implementing this approach we explored whether in-dividual feedback on symptom dynamics complements current categorical classification and treatment. The aim of this proof-of-principle case-study was to explore the feasibility, acceptability and usability of this transdiagnostic approach. Methods. A female patient, aged 67, suffering from treatment resistant anxious and depressive symptoms was treated in our tertiary outpatient clinic for old age psychiatry. She participated in ecological momentary assessments (EMA), which in-volved intensive repeated measurements of mood and context-related items during two weeks. Visualizations of the interplay between the items were provided by network graphs and were discussed with the patient. Results. Network graphs were discussed with the patient. For example, it was hypothesized and discussed with the patient that feeling relaxed increased physical activity, causing physical discomfort in the following hours. Physical discomfort caused stress as its symptoms resembled her feared somatic anxiety symptoms. This increased the patient’s insight that stress, expressed as somatic symptoms, played a central role in her panic disorder. This started a dialogue on how to cope with stress caused by somatic (anxiety) symptoms and provided a rationale for the patient to start an interoceptive exposure intervention she had repeatedly refused before. Limitations. The observed symptom dynamics may not be generalizable to any other random two weeks. Conclusions. Personalized diagnosis of psychopathology incorporating complex symptom dynamics is feasible and a promising addition to current categorical diagnostic systems and could guide intervention selection. This merits further exploration.
Keywords:
Anxious Depression; Ecological Momentary Assessment; Elderly; Network Analysis; Personalized Medicine; Psychopathology2 Pathology of individual patients is often not adequately captured by the diagnostic categories of the Diagnostic and Statistical Manual of Mental Disorders-5 (American Psy-chiatric Association, 2013) as there is high comorbidity of mental disorders (Widiger & Samuel, 2005) and high heterogeneity within mental disorder classifications (War-denaar & De Jonge, 2013). This heterogeneity increases with age (Fiske, Wetherell, & Gatz, 2009; Wolitzky-Taylor, Castriotta, Lenze, Stanley, & Craske, 2010). For instance, it is assumed that late-life depression, compared to depression in younger patients, is more often accompanied by severe anxiety symptoms, psychotic symptoms, somatic mor-bidity, apathy and neurocognitive decline (Fiske et al., 2009; Hegeman, Kok, van der Mast, & Giltay, 2012; Wolitzky- Taylor et al., 2010). Increased diagnostic heterogeneity could explain the lower treatment effectiveness of affective disorders in geriatric patients (Calati et al., 2013; Gould, Coulson, & Howard, 2012a; Gould, Coulson, & Howard, 2012b), as different subtypes may need different treatment strategies (Calati et al., 2013). Personalized diagnostic pro-cedures are thus especially relevant for geriatric patients with affective disorders.
To obtain a better understanding of the complex symptom dynamics in a geriatric patient, we investigated the useful-ness and feasibility of a new and innovative transdiagnostic approach. The ecological momentary assessment (EMA) method was combined with the network approach to psychopathology in generating personalized feedback of complex symptom dynamics. With the EMA method, an individual is asked to fill out questions about their thoughts, feelings, and appraisal of their context multiple times a day during normal daily life (Myin-Germeys et al., 2009). De-spite concerns about patient burden, this method has already shown promising first results concerning feasibility and usefulness in aging research (Cain, Depp, & Jeste, 2009), although it has not been implemented as a personalized clinical tool yet. These data can be used to gain insight into the interplay between cognitions, emotions, behavior, and environment in the daily life of individuals by the network approach. The network approach to psychopathology assumes that complex interactions between symptoms pro-duce a disordered state of the ‘system’ that can be labeled as for example, depressed, anxious or psychotic (Borsboom & Cramer, 2013). This line of reasoning is in contrast to the classic disease approach in which a latent construct (psychiatric disorder) is assumed to produce a specific set of symptoms (Fried et al., in press).
Recently, the EMA method and the network approach have been combined into a new idiographic approach to diagnosis, which is based on daily-life fluctuations in affec-tive, cogniaffec-tive, and physical symptoms and environmental factors (Van Os, 2013; van Os, Delespaul, Wigman, Myin-Germeys, & Wichers, 2013). These individual net-work diagnoses entail a visual display of (causal) relation-ships between symptoms and environment and could be used as personalized feedback as well as guidance to personalized interventions (Wigman et al., 2013). To our
knowledge, only one study has implemented EMA-derived personalized feedback in addition to pharmacological in-terventions for adult patients with a major depressive dis-order (Kramer et al., 2014). This addition of person-tailored daily life information to existing approaches seemed feasible and usable and showed promising enhancements to standard treatment. However, the possibilities of adding the network approach to the descriptive information of EMA-derived personalized feedback are not explored yet.
The primary aim of this study was therefore to explore the added value of this new approach in a geriatric patient with complex symptom dynamics. The network approach of psychopathology was added to the care as usual for the patient in our clinic. The specific aims were to test the fea-sibility, acceptability and usability of personalized symptom network feedback generated out of symptom data assessed during real-life.
Methods
Participant
A 67-year-old female patient was referred to our ter-tiary outpatient clinic for old age psychiatry in 2011. She suffered from treatment-resistant mixed symptoms of anxiety and depression since 2008. She was initially diagnosed with a panic disorder with agoraphobia, complicated by a comorbid major depressive disorder with melancholic features.
Additional cognitive screening revealed a maximum Mini Mental State Examination (MMSE) (Cockrell & Folstein, 1988) score of 30 indicating the absence of cognitive deficits. At the time of referral, she used Lorazepram 3 mg and Mirtazapine 30 mg per day. From 2011 onwards, she was treated for her depressive and anxiety symptoms according to a guideline-based pharmacological treatment algorithm as well as with individual cognitive behavioral therapy focus-ing on the panic disorder. The first intervention of choice in cognitive behavioral therapy for panic disorders, interocep-tive exposure (triggering symptoms of somatic arousal through e.g. hyperventilation provocation) was repeatedly suggested and refused by the patient. Exposure in vivo (e.g. entering a place that is associated with arousal and a previ-ous panic attack) was acceptable for her and applied. Nev-ertheless, the treatment was only partly successful. She remained anxious of symptoms of somatic arousal. Her insight into symptoms and behavior remained poor; she strongly believed that her symptoms would initiate a panic attack and she continued to cope with this anxiety through avoidance behavior or safety behavior (e.g., staying in the company of her husband). In May 2014, the residual com-plaints were high levels of fear for somatic stress symptoms (anxiety sensitivity) and depression combined with feelings of derealization and depersonalization upon early morning wakening. Most symptoms generally resolved around mid-afternoon. The core symptoms that bothered her most and which she wanted to resolve first were symptoms of
Journal for Person-Oriented Research, 2017, 3(1), 1-10
3 physical discomfort experienced such as heart pondering, sweating and trembling.
Procedure
The protocol was submitted to the ethical review board of the University Medical Center Groningen, who confirmed that formal assessment was not required. Prior to participa-tion, the patient was fully informed about the study after which she gave written informed consent. Moreover, the patient and her partner received an extensive briefing plus written user instructions for the EMA measurements. A research assistant was available by phone one day to answer questions regarding the functionality of the electronic diary. Patient’s data were gathered with our secured server sys-tem (RoQua) (Sysys-tema & Van der Krieke, 2013). With this system, text messages with links to online questionnaires were sent to the patient’s smartphone. Measurements were scheduled five times a day every three hours from 10 a.m. onwards for two weeks and took three to five minutes to complete. The timing of the measurements was adjusted to her daily rhythm with the last measurement timed 30 minutes before going to bed. The patient was instructed to fill out the questionnaires as soon as possible after receiving the text message (beep), but preferably within 15 minutes. The patient received a reminder after 30 minutes, and after 60 minutes the link was closed. Of a maximum of 70 pos-sible assessments, only 4 (5.71%) were missed and deleted pairwise. After the two week measurement period, the pa-tient was prompted to fill out a questionnaire to evaluate the EMA procedure.
Results on mood fluctuations, somatic status, physical activity level, social context, and the relationships between these variables were drafted in a personalized feedback report and extensively discussed with the patient and her husband by both the researcher and her therapist. Finally, the patient and therapist’s view on the guidance of the research team, the feasibility and impact of the daily measurements on the patient and the feedback reports were assessed and evaluated with semi-structured interviews.
Ecological momentary assessments
A pilot version of an EMA protocol of an ongoing pro-spective cohort study, The Netherlands Study of Depression and Anxiety (www.nwsda.nl; the full list of items is availa-ble upon request) was used. In short, to assess daily fluctu-ations, items address current mood, energy level, physical activity level, social context, and daily experiences. Prior to statistical analysis, the researchers, in close collaboration with the patient’s therapist, selected 21 items (shown in table 1) based on relevance for this particular individual patient, as well as variability in items and feasibility of interpretation of the network.
Momentary mood
Mood was assessed at each beep with 12 affect items. Examples of items are: ‘I feel down” or “I feel enthusiastic”. All items could be answered on a 7-point Likert scale var-ying from ‘1=not at all’ to ‘7=very much’. In order to im-prove on interpretability of the planned network graphs, affect items were aggregated into mood variables following the affect grid (Russell et al., 1989). This grid (Figure 1) consists of two axes, valence and arousal, which are con-sidered to be the fundamental building blocks of affect. Where valence indicates the pleasantness of an affect, arousal indicates the degree of psychological activation. When affective states are rated in a valence-arousal two-dimensional space or grid (Russell, 1980; Russell, Weiss, & Mendelsohn, 1989) four quadrants are created: stress, excitement, depression and relaxation. Within each quadrant, data from three items were used to specify its state. In Figure 1, the three words in each quadrant indicate the items used to assess affect in the current study. These items were developed recently in the Uncovering the Positive Potential of Emotional Reactivity (UPPER) study (Bennik, 2015).
Physical sensation and activity
To assess experienced momentary physical sensation, after each beep the patient filled out the item “I experience physical discomfort”. For our patient, her somatic anxiety symptoms (heart pondering, sweating, and trembling) were reflected in this physical discomfort item. Energy level was measured with the item “I feel tired”. Physical activity was measured with the item: “How physically active have you been since the last measurement?” These items were scored on a 7-point Likert scale varying from ‘1=not at all’ to ‘7=very much’.
Momentary social context and daily experiences Ratings of momentary social context were assessed with items on whether the patient was alone or with others and, if she was not alone, how pleasant she experienced the com-pany of others. Both were rated on a 7-point Likert scale varying from ‘1=not at all’ to ‘7=very much’. The calculated compound variable ‘pleasant company’ was derived from these ratings of appreciation, and used in network modeling. The definition of daily (un)pleasant experiences was ex-tensively explained to the patient and assessed by the item “Think of the most pleasant experience since the previous beep”. The patient was then asked to rate the degree of pleasantness and how important this experience was for her, both on a 7-point Likert scale varying from ‘1=not at all’ to
4
Table 1. The 21 selected items from the ecological monitoring assessments (EMA) and the 10 numbered nodes (bold face) based on these items (see the method section for further details).
N Mean (SD)
1 Excited (high arousal high pleasure)
I feel enthusiastic 66 1.65 (1.03)
I feel energetic 66 2.55 (1.28)
I feel cheerful 66 2.03 (1.12)
2 Relaxed (low arousal high pleasure)
I feel satisfied 66 2.94 (1.33)
I feel relaxed 66 2.79 (1.32)
I feel calm 66 3.24 (1.30)
3 Stressed (high arousal low pleasure)
I feel nervous 66 3.97 (1.24)
I feel irritated 66 1.58 (0.95)
I feel upset 66 2.73 (1.58)
4 Depressed (low arousal low pleasure)
I feel bored 66 1.02 (0.12) I feel down 66 3.68 (1.30) I feel listless/apathic 66 3.45 (1.24) 5 I feel tired 66 4.00 (1.16) 6 Physical discomfort 66 3.03 (1.70) 7 Physical activity 66 3.89 (0.88) 8 Pleasant company
I would have preferred to be in company 7 2.57 (0.53)
I experienced the company as pleasant 59 6.20 (0.74)
9 Pleasant experience 66 3.40 (1.57)
How pleasant was the experience? 66 1.96 (1.75)
How important was the experience? 66 4.85 (2.01)
10 Unpleasant experience 66 5.24 (1.86)
How unpleasant was the experience? 66 5.74 (1.50)
How important was the experience? 66 4.73 (2.53)
‘7=very much’. Next the patient was asked which experi-ence she had in mind and to type her answer in the elec-tronic diary. These notes were taken into account when discussing her personalized feedback report. Daily un-pleasant experiences were assessed in an analogous way. A daily (un)pleasant-experience-variable was computed by taking the mean of the degree of (un)pleasure and of im-portance of the experience, and used in network modeling. Visualization of the networks
To improve on the readability of the network graphs we summarized variables in 10 aggregated variables (see Table 1), which were visualized in differently colored ‘nodes’ in the networks according to three main categories: i) orange for mood (I feel excited, stressed, relaxed, depressed), ii) yellow for physical sensation and activity (I feel tired, I experienced physical discomfort, I have been physically
active), and iii) blue for social context and daily experiences (pleasant company, pleasant experiences, unpleasant expe-riences). The colors of the lines represent either a positive (green) or negative (red) connection between nodes. The thickness of the lines represents the weight of the connection: the thicker the line, the stronger the association.
Statistical analysis
With EMA the patient was assessed repeatedly within short time intervals (i.e. three hour time windows) during daily life to obtain time series data of the variables of interest. For descriptive purposes the daily fluctuations of EMA items were plotted in line graphs. In these graphs all indi-vidual ratings as well as mean ratings per time point ag-gregated over a single day were depicted. Two network graphs were obtained: an undirected contemporaneous and a temporal network. In these networks the variables are rep-resented by nodes. In the contemporaneous network, the
Journal for Person-Oriented Research, 2017, 3(1), 1-10
5
Figure 1. The Affect Grid adapted after Russell et al. (1989) and Bennik (2015). The affective states are rated along the valence (unpleasant, pleasant) and arousal (low, high) axis, in capital letters, in Russell’s two axes circumplex model (Russell, 1980). The two axes combined result in four quadrants in Russell’s affect grid (Russell et al., 1989) to assess what an indi-vidual feels right now: stress, excitement, depression, or relaxation
associations (depicted as lines) between two nodes indicate the correlation between the variables measured at the same time point. Next, a lag-1 correlation matrix was calculated for visualization of the temporal (or lagged) directed net-work. In this network each variable is, again, represented as a node. When one variable predicts the value of another variable three hours later, the association is drawn with an arrowhead pointing from one node to the other. Moreover, a variable at a certain time point can predict itself at the next time point. This autocorrelation effect is drawn as an ar-rowhead pointing from a node to that same node.
Contemporaneous and temporal networks were con-structed by calculating (lagged) correlations between varia-bles and visualizing the resulting matrices by using the R-package qgraph (Epskamp, Cramer, Waldorp, Schmittermann, & Borsboom, 2012). The Fruchterman- Reingold algorithm, which places nodes with the highest connectivity to all other nodes centrally, was used for the layout of the networks. Only correlations above r = 0.25
were visualized (Epskamp et al., 2012). The resulting net-works were then visually inspected on: i. the clustering of variables (Borsboom & Cramer, 2013); ii. the centrality, as an indicator of which variable is most connected to all other variables (Opsahl, Agneessens, & Skvoretz, 2010) and, therefore, asserts most influence; iii. external variables (such as social context or pleasant experiences) influencing mood variables. These properties were used as a starting point in drafting the personalized feedback report by describing those properties in an accessible way and propose possible implications.
Results
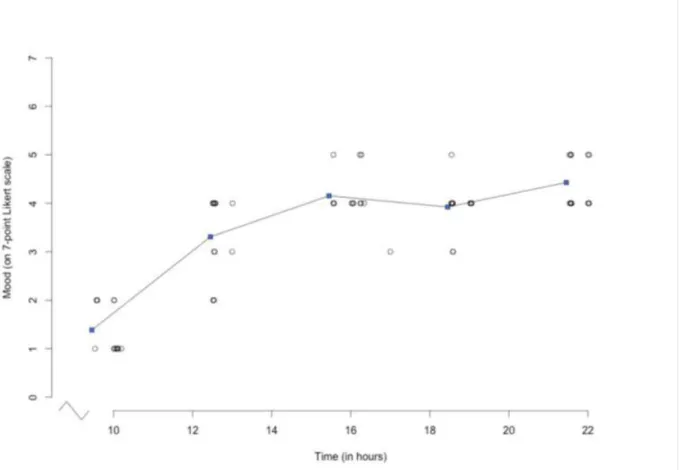
In a detailed personalized feedback report, the ratings on the different items and the network plots were presented to the patient and discussed with her and her husband by the therapist and the researcher. The ratings on, for example, the
6 item “I feel good” were depicted over the course of one day, which confirmed the earlier reported circadian pattern of the patient’s complaints (Figure 2). This figure was discussed with the patient to show that her initial low mood at the beginning of the day generally improves, which helped to undermine her belief ‘that things would never get better’. Other data were discussed as well. One example is that the patient had indicated that during the two weeks of moni-toring she had been alone for only 25% of the time and with others for 75% of the time, although she reported a slightly better mood when being alone. Moreover, relevant details of the described daily (un)pleasant experiences were discussed, as for example how her daughter in law reacted distant during dinner in a restaurant. Or eating fries in front of the television and receiving a loving text message from her daughter.
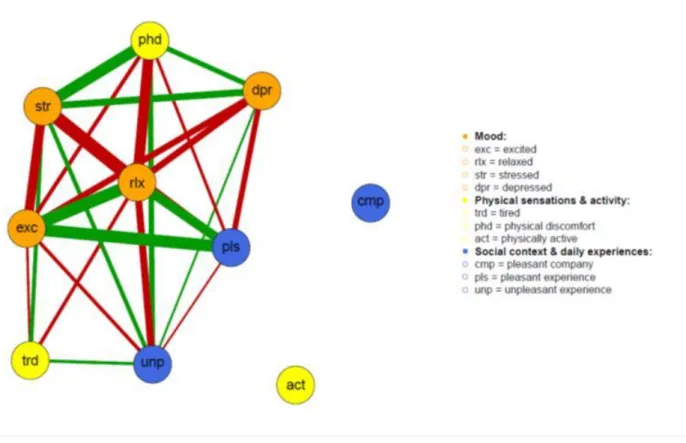
Contemporaneous network
Visualized correlations resulted in an undirected con-temporaneous network (Figure 3). The concon-temporaneous network clearly depicts two clusters of nodes that are cor-related with each other. The first cluster is a positive affect cluster formed by connections between the nodes of feeling relaxed, feeling excited, and having pleasant daily experi-ences. This co-occurring of daily experiences was recog-nized by the patient. When she, for example, performed her exposure in vivo exercises (e.g., a family visit), this resulted in excitement about having achieved a goal and resulted in a pleasant experience.
The other cluster concerns correlations of negative affect nodes and is formed by connections between the nodes of feeling stressed, relaxed (negative correlation) and physical discomfort, and to a lesser extent feeling depressed and having unpleasant daily experiences. This co-occurring of daily symptoms was also recognized by the patient and her husband. For example, when her mood was low in the (early) morning she also experienced more symptoms of stress, caused by the unpleasant physical experience of dereali-zation. Finally, the nodes ‘physical activity’ and ‘pleasant company’ were not meaningfully associated with nodes of the positive affect cluster.
Temporal network
Visualized lag-1 correlations resulted in a directed net-work, given in Figure 4, which depicts the temporal associ-ations between the variables. This means that an arrow from one node to another should be interpreted as the effect of fluctuations in one node over a three-hour time lag on the fluctuations of the other node to which the head of the arrow is pointing. The emerging arrow pointing to the same node, shown for example at the node ‘excited’, indicates that this node has a large autocorrelation effect and means that if the patient reported to feel excited she most likely would feel even more excited three hours later as well. Feeling excited
related to more pleasant experiences and becoming more tired three hours later.
The other cluster includes the ‘physical discomfort’ node, which was the core symptom of the patient. It was hypoth-esized and discussed with the patient that feeling relaxed seemed to relate to increased physical activity, followed by more physical discomfort (heart pondering, sweating, and trembling) and more stress about these somatic symptoms in the next three hours. These stress feelings were explained by the patient as caused by her fear for the somatic anxiety symptoms. Moreover, subsequent negative feedback loops to counter these effects were described and recognized. For instance, experiencing more physical discomfort and feeling stressed decreased physical activity in the next three hours, and being less physically active decreased feeling relaxed in the next three hours. This chain of events related to more depressed feelings, and rating of her company (social con-text) as more pleasant. This latter relationship was hypoth-esized as an expression of safety behavior: being in com-pany decreased her fear for symptoms of physical discom-fort, through the assumption that when something is wrong, people will help her.
Effects of feedback
The patient and her husband recognized the shown graphical associations. This initiated a dialogue in which the patient and her husband began to reason in terms of causal and dynamic processes. They formulated the hypothesis that tension, expressed as (feared) somatic anxiety symptoms, played a central role. Together with the ‘physical discom-fort’-node being the node in the network with the most in-fluential causal arrows (Figure 4), this opened up a dialogue on how to cope with stress related to the physical discomfort itself.
As mentioned earlier, up until that point, the patient had been reluctant to do interoceptive exposure (inducing physical discomfort through e.g. hyperventilation provoca-tion), the first intervention of choice in cognitive behavioral therapy for panic disorders. Discussing the patterns found in the networks motivated her to try this intervention for the first time.
Evaluation of feedback
Information from the semi-structured interview con-ducted with the therapist and patient separately indicated that the EMA measurements were found to be both feasible and acceptable. The network graphs provided new insights in symptom dynamics and a change in treatment direction. Both patient and therapist therefore evaluated the process positively. Moreover, not only did the feedback bring about new insights and treatment directions, but the approach was also evaluated as compatible with and an addition to outpa-tient treatment.
Kroeze et al.: Personalized Feedback on Symptom Dynamics of Psychopathology
7
Figure 2. Descriptive graph from personalized feedback report. Daily fluctuations of the ratings of the item “I feel good” over the course of one day showing all the 14 individual measurements (gray dots) and the mean ratings (blue dots) at each time point connected by a line.
Discussion
We explored the implementation of the symptom network approach to psychopathology in an individual patient in addition to care-as-usual. We found that EMA assessments were feasible for, and well accepted by, our geriatric patient. The personalized feedback based on EMA data and network graphs were evaluated as useful by the patient and the therapist as it initiated a dialogue about the causes and consequences of symptoms in our treatment resistant patient. The dialogue resulted in increased insight in the patient’s symptom dynamics beyond descriptive diagnosis as well as motivation for a new direction in treatment.
Although this proof-of-principle was successful, the following limitations need to be discussed. First, not all potentially relevant variables (e.g., medication use) may have been assessed using the standardized questionnaire. However, selection of the items used for the network analyses was done in close collaboration with the
thera-pist. Moreover, the patient and her husband recognized the items included in the feedback report as highly rele-vant ones. Second, in this proof-of-principle study we used the currently available statistical tools. The statisti-cal methods for analyzing intensive time-series data are currently evolving rapidly. Further studies are needed to examine whether other techniques, such as Vector Auto-regressive modeling, and sparser network estimation based on partial correlations and LASSO methods (Costantini et al., 2015) will generate different networks. Simulation studies are needed to establish the stability of networks with increasing numbers of missing values in the time series. Finally, the patient was monitored inten-sively during two weeks to obtain ecologically valid data on current mood states. Although these data may be more representative compared to a single retrospective questionnaire assessment, it remains unclear whether the observed symptom dynamics will be generalizable to
any other random two weeks in the patient’s life. Earlier or later monitoring might result in different network graphs due to changes in the symptom dynamics, which needs to be investigated.
8
Figure 3. Network graphs from personalized feedback report, depicting contemporaneous associations of nodes (i.e. across three-hour time lags). The color of the nodes represents variable categories: orange for affect (exc: excited, rlx: relaxed, str: stressed, dpr: depressed), yellow for somatic (trd: tired, phd: physical discomfort, act: physically active), and blue for con-text (cmp: pleasant company, pls: pleasant experience, unp: unpleasant experience). The colors of the lines represent either a positive (green) or negative (red) connection between two nodes. The thickness of the lines represents the weight of the connection: the thicker the line, the stronger the association.
Indeed, there is still work to be done before EMA and network based personalized feedback can be routinely im-plemented in clinical practice. However, our results showed that personalized diagnosis of psychopathology incorporat-ing complex symptom dynamics is feasible and desirable. Our personalized feedback approach gave insight in the dynamic interplay between affect and context variables in an individual geriatric patient with complex and persistent symptomatology. It facilitated the process of jointly gener-ating hypotheses and selecting interventions. In particular in such patients our approach may reduce certain limita-tions of current diagnostic classification systems (Rapoport, 2014). We therefore conclude that the network approach to psychopathology is a promising addition to the current di-agnostic systems that definitely merits further exploration.
Authors contributions
1) Substantial contributions to conception and design (RK, DvdV, MNS, JAB, RCOV, DB, HGR, RAS, HR), acquisi-tion of data (RK, MS), analysis and interpretaacquisi-tion of data (RK, DvdV, MNS, JAB, RCOV, DB, HGR, RAS, HR). 2) Drafting the article (RK, DvdV, RCVO, HR), revising it critically for important intellectual content (MNS, JAB, DB, HGR, RAS).
3) Final approval of the version to be published (RK, DvdV, MNS, JAB, RCOV, DB, HGR, RAS, HR).
Journal for Person-Oriented Research, 2017, 3(1), 1-10
9
Figure 4. Network graphs from personalized feedback report, depicting temporal associations of nodes (i.e. across three-hour time lags). The color of the nodes represents variable categories: orange for affect (exc: excited, rlx: relaxed, str: stressed, dpr: depressed), yellow for somatic (trd: tired, phd: physical discomfort, act: physically active), and blue for con-text (cmp: pleasant company, pls: pleasant experience, unp: unpleasant experience). The colors of the lines represent either a positive (green) or negative (red) connection between two nodes. The thickness of the lines represents the weight of the connection: the thicker the line, the stronger the association.
References
American Psychiatric Association. (2013). Diagnostic and statistical manual of mental disorders (5th ed.). Arlington: American Psychiatric Publishing. Bennik, E. (2015). Every dark cloud has a colored
lining. the relation between positive and negative affect and reactivity to positive and negative events. Groningen: PhD thesis.
Borsboom, D., & Cramer, A. O. (2013). Network analysis: An integrative approach to the structure of psychopathology. Annual Review of Clinical Psy-chology, 9, 91-121. doi:10.1146/annurev-clinpsy- 050212-185608
Cain, A. E., Depp, C. A., & Jeste, D. V. (2009). Eco-logical momentary assessment in aging research: A critical review. Journal of Psychiatric Research, 43(11), 987-996. doi:http://dx.doi.org/10.1016/ j.jpsychires.2009.01.014
Calati, R., Salvina Signorelli, M., Balestri, M., Marsano, A., De Ronchi, D., Aguglia, E., & Serretti, A. (2013). Antidepressants in elderly: Metaregres-sion of double-blind, randomized clinical trials.
Journal of Affective Disorders, 147(1–3), 1-8. doi:http://dx.doi.org/10.1016/j.jad.2012. 11.053 Cockrell, J. R., & Folstein, M. F. (1988). Mini-mental
state examination (MMSE). Psychopharmacol Bul-letin, 24, 689-692.
Costantini, G., Epskamp, S., Borsboom, D., Perugini, M., Mõttus, R., Waldorp, L. J., & Cramer, A. O. J. (2015). State of the aRt personality research: A tu-torial on network analysis of personality data in R. Journal of Research in Personality, 54, 13-29. doi:http://dx.doi.org/ 10.1016/j.jrp.2014.07.003 Epskamp, S., Cramer, A. O. J., Waldorp, L. J.,
Schmittermann, V. D., & Borsboom, D. (2012). Qgraph; network visualizations of relationships in psychometric data. Journal of Statistical Software, 48, 1-18.
Fiske, A., Wetherell, J. L., & Gatz, M. (2009). De-pression in older adults. Annual Review of Clinical Psychology, 5, 363-389.
Fried, E. I., Van Borkulo, C. D., Cramer, A. O., Boschloo, L., Schoevers, R. A., & Borsboom, D. (2017). Mental disorders as networks of problems: A review of recent insights. The Social Psychiatry
10 and Psychiatric Epidemiology, 52(1), 1-10. doi:10.1007/s00127-016-1319-z
Gould, R. L., Coulson, M. C., & Howard, R. J. (2012a). Cognitive behavioral therapy for depres-sion in older people: A meta-analysis and me-ta-regression of randomized controlled trials. Jour-nal of the American Geriatrics Society, 60(10), 1817-1830. doi:10.1111/j.1532-5415. 2012.04166.x Gould, R. L., Coulson, M. C., & Howard, R. J.
(2012b). Efficacy of cognitive behavioral therapy for anxiety disorders in older people: A me-ta-analysis and meta-regression of randomized con-trolled trials. Journal of the American Geriatrics Society, 60(2), 218-229. doi:10.1111/j.1532-5415. 2011.03824.x
Hegeman, J. M., Kok, R. M., van der Mast, R. C., & Giltay, E. J. (2012). Phenomenology of depression in older compared with younger adults: Me-ta-analysis. The British Journal of Psychiatry: The Journal of Mental Science, 200(4), 275-281. doi:10.1192/bjp.bp.111.095950
Kramer, I., Simons, C. J., Hartmann, J. A., Men-ne-Lothmann, C., Viechtbauer, W., Peeters, F., . . . Wichers, M. (2014). A therapeutic application of the experience sampling method in the treatment of depression: A randomized controlled trial. World Psychiatry : Official Journal of the World Psychiat-ric Association (WPA), 13(1), 68-77. doi:10.1002/ wps.20090
Myin-Germeys, I., Oorschot, M., Collip, D., Lataster, J., Delespaul, P., & van Os, J. (2009). Experience sampling research in psychopathology: Opening the black box of daily life. Psychological Medicine,
39(9), 1533-1547. doi:10.1017/
S0033291708004947
Opsahl, T., Agneessens, F., & Skvoretz, J. (2010). Node centrality in weighted networks: Generalizing degree and shortest paths. Social Networks, 32(3), 245-251.
doi:http://dx.doi.org/10.1016/j.socnet.2010.03.006 Rapoport, M. J. (2014). Geriatric psychiatry: What’s
in a name, and five concerns about DSM-5. Cana-dian Geriatrics Journal, 17, 115-117. doi:10.5770/ cgj.17.117
Russell, J. A. (1980). A circumplex model of affect. Journal of Personality and Social Psychology, 39(6), 1161-1178. doi:10.1037/h0077714
Russell, J. A., Weiss, A., & Mendelsohn, G. A. (1989). Affect grid: A single-item scale of pleasure and arousal. Journal of Personality and Social Psy-chology, 57(3), 493-502.
Sytema, S., & Van der Krieke, L. (2013). Routine outcome monitoring: A tool to improve the quality of mental health care? In G. Thornicroft, M.
Rug-geri & D. Goldberg (Eds.), Improving mental health care: The global challenge (1st ed., pp. 246-263). Chichester: John Wiley & Sons.
Van Os, J. (2013). Psychiatry beyond labels: Intro-ducing contextual precision diagnosis across stages of psychopathology. Psychological Medicine, 43(7), 1563-1567. doi:10.1017/S0033291713000937 van Os, J., Delespaul, P., Wigman, J., Myin-Germeys,
I., & Wichers, M. (2013). Beyond DSM and ICD: Introducing "precision diagnosis" for psychiatry using momentary assessment technology. World Psychiatry : Official Journal of the World Psychiat-ric Association (WPA), 12(2), 113-117. doi:10.1002/wps.20046
Wardenaar, K. J., & De Jonge, P. (2013). Diagnostic heterogeneity in psychiatry: Towards an empirical solution. BMC Medicine, 12, 201. doi:10.1186/ 1741- 7015-11-201
Widiger, T. A., & Samuel, D. B. (2005). Diagnostic categories or dimensions? A question for the diag-nostic and statistical manual of mental disorders, fifth edition. Journal of Abnormal Psychology, 114, 494-504. doi:10.1037/ 0021-843X.114.4.494 Wigman, J. T., van Os, J., Thiery, E., Derom, C.,
Col-lip, D., Jacobs, N., & Wichers, M. (2013). Psychiat-ric diagnosis revisited: Towards a system of staging and profiling combining nomothetic and idiograph-ic parameters of momentary mental states. PloS One, 8(3), e59559. doi:10.1371/journal.pone. 0059559
Wolitzky-Taylor, K. B., Castriotta, N., Lenze, E. J., Stanley, M. A., & Craske, M. G. (2010). Anxiety disorders in older adults: A comprehensive review. Depression and Anxiety, 27(2), 190-211. doi:10.1002/da.20653