VTIraijt"
302 A
1.986
A comparison of some daylight
mo torcycle visibility treatments
Sven Dahlstedt, Firma Humanteknologi,
Sturefors
'
m
Vag- 00/)
Statens vé'g- och trafikinstitut (VTI) - 58 1 0 1 Linkb'ping
VTIrart
302 A
1.986
A comparison of some daylight
matarcycle visibility treatments
Sven Dahlstedt, Firma Humanteknologi,
Sturefors
a»
Vag- 00/7
Statens ve'g- och trafikinstitut (VTl) - 581 0 1 Linkb'ping
ABBREVIATIONS
In the Figures, Tables and also in some places in the text, the experimental sessions and conditions are only indicated with brief notations. These
abbreviations, and some others, are explained in the list below. Letters
enclosed in brackets "( )" are found in some places in the report, where the
space has permitted longer abbreviations.
(Forkortningar - I figurer, tabeller och pa nagra stéillen i texten har forsoksbetingelserna angetts med forkortningar enligt listan nedan. Bokstaver inom klammer () forekommer pa vissa stallen dar utrymmet
medgett nagot langre forkortningar.)
B(ig)
-Bl Fl Gr He Hi -L(it) Lo MC Med Mod P(l) R(id) s(m) SEV Si Ti w _ Y _Big fairing (Stor kapa) Black (Svart)
Fluorescent greenish yellow (Fluorescerande gronaktigt gul)
Grey (Gra)
Headlamp (Stralkastare)
High intensity lights (Hog ljusstyrka) Steady lighting (Fast belysningsniva) Low intensity lights (Lag ljusstyrka) Motorcycle (Motorcykel)
Medium intensity lights (Medelljusstyrka)
Modulated headlight (Modulerat strélkastarljus)
Plain motorcycle ("Naken" motorcykel)
Rider (Forare)
small fairing (liten ké tpa)
Subjective estimated visibility, the measure of visibility which has been used in this study (Skattad synbarhetzdet relativa synbarhetsmatt som anva'nts i denna undersokning)
Sidelights (Sidoljus, varselljus) Turn indicator (Korriktningsvisare)
White (vitt)
Yellow (Gult)
PREFACE
I have written a number of research reports since my first reports about the Swedish adaptation from left to right hand traffic in 1967. In all these reports I have only enclosed a preface on two occasions. But now I feel the need again, in order to be able to express some of the feelings that you cannot put into the main text of a strict research report.
This motorcycle study had to be made during a season when there is no motorcycle climate in Sweden, which meant that if it should be done as a
field study, the research had to be done somewhere abroad, somewhere far,
far away. This, in turn, meant that everything needed had to be collected in advance and then brought/sent to the site (which turned out to be Melbourne). As an indication of how this worked out it can be mentioned that the last piece of equipment arrived one hour before take-off from
Sweden, and the two crates that had been sent in advance were two weeks
delayed when they finally arrived in Australia. And then nothing fitted as it had fitted at home... and the computer wasn't compatible with the printer (or vice versa) and when finally most things worked the sun wouldn't show up when the subjects did and vice versa.
But in spite of these nuisances some useful data were collected which - as you might judge for yourself hopefully will be of some value for motorcycle safety. However, this work could not have been accomplished without a lot of help and support from all around, and now I want to use a few lines to express my gratitude to:
ARRB for their hospitality when I dropped in from the other side of the
world,
John, Peter and Steve who took turns at nursing me, and gave me a lot of the moral and practical support I needed,
Jeff and Phil, who rode the bikes more than 3000 laps,
all the anonymous subjects who did (what seems to be) a great job at an extremely boring task,
all the other people, in Sweden and Australia, who helped me with everything but who cannot be listed on this small page.
A final, formal point; If you find any opinions in the text of the report, you
can assume that those opinions were mine at least at the time of writing but you cannot assume that they are valid for the Swedish Road Safety Office (TSV), the Swedish Road and Traffic Research Institute (VTI)nor the
Australian Road Research Board (ARRB).
SD
CONTENTS LIST OF ABBREVIATIONS PREFACE TABLE OF CONTENTS SUMMARY SVENSK SAMMANFATTNING SVENSKA FIGURTEXTER ) -l -) -i W N r N m m um uL n L n -o wvi vi vm r uh L ~D KJ IK JI KJ IK JI \1 1 «P W N H 0\ wk )». {a lr bi of r i INTRODUCTION Looking wihtout seeing
Motorcycle safety and visibility Motorcycle safety in Sweden
PURPOSE AND SCOPE OF THIS STUDY METHODOLOGY
The measurement of visibility
The need for a definition Visibility versus conspicuity The chosen method
Procedure Realization Instructions Experimental design Subjects Environmental factors Experimental conditions Non experimental conditions Steady lights
Modulated lights
Motorcycle size and colour Rider colour Statistical analysis RELIABILITY RESULTS Lighting Modulation
Motorcycle size and colour Rider colour
SOME CONCLUDING COMMENTS REFERENCES
APPENDIXl Light intensities
2 - Modulation characteristics 3 Individual reliability coefficients 4 Overall rankingof results
VTI REPORT 302A
Page III \ n N i * ON 26 26 29 29 32
34
38 r -) -D I-A comparison of some daylight motorcycle visibility treatments by Sven Dahlstedt
Swedish Road and Traffic Research Institute (VTI)
5-581 01 LINKCPING SWEDEN
SUMMARY
After a review of the literature concerning motorcycle visibility and safety
and also the effects of visibility enhancing devices, it seemed that much of
the literature was inconclusive and contradictory. To get a better basis for both the short- and longterm work on increased motorcycle safety, the Swedish Road Safety Office therefore commissioned a systematic study of motorcycle visibility.
The study was carried out as an estimation experiment in an outdoor situation during summerlike daylight conditions. The factors treated in the study were of four different kinds: steady light, modulated light, motorcycle size and colour and colour of the rider. In all, more than a hundred conditions were studied. The results give an overview of advantages, as well as disadvantages, of a wide range of visibility devices for motorcycles.
An overall listing of the results is found in Appendix 4, where all the conditions have been ordered according to visibility rank. Besides the comprehensive ranking a few of the main results of the four substudies could be pointed out:
Steady light (Fig 5) has negligible effect when the motorcycle is seen in
a 30° attitude; but visibility increases with increased light intensity ata 50 attitude; minor differences between white and yellow light; a marked positive effect of the number of light sources (Fig 6).
- Modulated light (Fig 7) seems to give the same visibility as steady light
of comparable intensity,
II
Size and colour of the motorcycle (Fig 8) seem to affect visibility in several ways; a big fairing increased the visibility for all the studied colours; a fairing combined with headlight improved the visibility irrespective of the colour of the fairing; a fluorescent colourincreased visibility markedly compared to other colours,
The colour of the rider (Fig 9) seems to work similarly to the colour of
the motorcycle but a "good" colour seems to have a somewhat better effect 'if placed on the rider, and a high visibility of the rider can be
notably reduced if concealed by e.g. parts of the motorcycle.
III
En jamforelse av nagra anordningar for motorcyklars synbarhet i dagsljus av Sven Dahlstedt
Statens vag- och trafikinstitut 581 01 LINKGPING
SAMMANFATTNING
Vid en oversikt av litteraturen rorande motorcyklars synbarhet och trafiks'akerhet samt effekten av synbarhetsbefr'amjande atgarder forefoll mycket av den tillgangliga litteraturen mots'agelsefull och inte helt tillforlitlig. For att ge trafiksakerhetsverket ett battre underlag for saval det lang- som kortsiktiga arbetet med motorcyklars synbarhet genomfor des en systematisk undersokning av hur ett antal faktorer paverkar motorcyklars synbarhet.
Undersokningen genomfordes som ett bedomningsexperiment utomhus under sommaraktiga dagsljusbetingelser. De faktorer som studerades i undersokningen kunde h'anforas till fyra olika huvudtyper: fast belysning, modulerad belysning, storiek och farg pa motorcykeln och forarens farg. Sammanlagt studerades mer an ett hundratai kombinationer av motor cykel, forare och observationsforhallanden. Resultaten ger sammantagna en oversikt over for och nackdelar hos olika synbarhetsanordningar for motorcyklar.
Resultaten for samtliga betingelser har sammanst'allts i bilaga 4 dar de redovisas som medelvarden med 95% konfidensintervall. Forutom denna totalredovisning kan huvuddragen i resultaten fran de fyra deistudierna mycket kort sammanfattas saiunda:
Fast belysning - (fig 5) ger mycket liten effekt nar motorcykelns riktning
avviker 30° frc m observationsriktningen; i 50 vinkel ger successivt okad
ljusstyrka en okad synbarhet; sma skillnader mellan guit och vitt ljus;
tydligt positiv effekt av antalet ljusk'allor (fig 6).
Modulerat ljus - (fig 7) forefaller oka synbarheten marginellt i jamforelse med fast belysning med motsvarande ljusstyrka.
Motorcykelns storlek och f'arg - (fig 8) storre kapa ger b'attre synbarhet for alla fa'rger; belysning tillsam mans med kapa okar synbarheten oavsett farg; fluorescerande farg okar synbarheten markant jamfort med andra farger.
IV
Fdrarens féirg (fig 9) fdrhéllandet mellan olika férger likartat med nér
féirgerna presenteras p51 motorcykelképor; en f eirg med god synbarhet verkar ge battre effekt placerad p21 feraren 25in p23 motorcykeln; men en god synbarhet hos feraren kan reduceras av skymmande delar p31 motorcykeln.
SVENSKA FIGURTEXTER Figur l Figur 2 Figur 3 Figur 4 Figur 5 Figur 6 Figur 7 Figur 8 Figur 9
Skiss over forsokssituationen (Ej skalenlig)
"Average .... ..cycle"=medelavstand mellan observator och mc "Observation range":observationsomrade
"Four alternative..."=fyra alternativa korriktningar for
motor-cyklarna
"Line of sight":observationsriktning
Motorcykel j'amsides med referensbilen, passerande med 300 vinkel till v'anstra observationsriktningen.
Relativ mangd av tre belysningskategorier for olika proportioner
av (del )sessioner
(x-axelzprocent av varje belysningskategori)
(y-axelzprocent av (del-)sessioner)
Skiss pa "naken" motorcykel (med belysningsanordningar) och motorcykel med liten och stor kapa, dels i 50 attityden (ovre
raden), dels i 300 attityden (undre raden).
Resultat for delforsoket "Fast belysning" for motorcykelatti
tyden 5O (overst) och 300 (underst). Stapelns hojdzaritmetiskt
medelvarde; Lilla strecket mitt i varje stapel=95% konfidens intervall.
(For beteckningar i figuren hanvisas till forkortningslistan i borjan av rapporten.)
Bedomd synbarhet som funktion av ljusstyrka och antal ljuskallor; = ensam stralkastare, Dzdubbla sidolyktor, (X): stralkastare + sidolyktor.
Resultat av delforsoket "Modulerad belysning" for 50 resp 300 (underst) attityden. Stapelns ho'jd = aritmetiskt medelvarde; det tunna strecket mitt i stapeln = 95% konfidensintervall.
Resultaten har delats upp beroende pa moduleringsfrekvens (2/3, 4/3 och 2 Hz, dvs 40, 80 resp 120 moduleringar/min) och
fordelningen av hog/lag ljusstyrka inom en moduleringscykel (t ex
8/2 = 80% hog och 20% lag ljusstyrka).
Resultat for delfo'rsoket "Motorcykelns storlek och f'arg". Medelv'arden och 95% konfidensintervall for 50 och 30O (underst)
attityden. '
(For beteckningar h'anvisas till listan i borjan av rapporten.) Resultat fran delforsoket "Forarens farg . Medelvarden och 95% konfidensintervall for 50 resp 30O attityden.
(For beteckningar hanvisas till listan i borjan av rapporten.)
1 INTRODUCTION
1.1 Looking without seeing
The phenomenon of looking without seeing is probably a very common experience to most people. The feeling of knowing that you have been looking somewhere and still not being able to tell what you saw is often just annoying or perhaps embarrassing, but mostly nothing more. But in many situations this overlooking of something that you could/should have seen
can Cause more SEFlOUS consequences.
Such situations are found everywhere, but in this connection road traffic is taken as an example of a field where such overlookings arevery common, and where the consequences can range from speeding tickets to fatal accidents. The reason(s) why people do not see signs, signals and their fellow road users is outside the scope of this report and in this context suffice is to say that people seem to miss a lot of what they should be able to see in and along streets and roads.
The particular traffic research area where these aspects of human imperfection has been very well illustrated is perception of traffic signs.
Ever since Johansson and collaborators (Johansson and Backlund, 1968;
Johansson and Rumar, 1966; First presented in Swedish in 1960 and 1961) first showed the limitations of Swedish drivers' sign reading capacity, others have made similar studies and have got similar results, e.g. Hakkinen (1965) in Finland and Undeutsch (1963) in Germany. And still, already at that time traffic engineers had made a lot to make road signs highly visible. It seems that visibility is a sufficient condition for something to be seen as long as people search for it or expect to see it. But to make people see e.g. road signs in which they are not interested, or not expect to see, it takes a stronger kind of visibility. Forbes, in 1939, was probably the first to study
this "suprathreshold" visibility in traffic settings (Forbes, 1972). He
discussed "attention value" of road signs, and although he did not go into the details of the concept of attention, at least he pointed out that something more than just plain visibility was important for seeing road signs. This attention-getting quality has later been labelled conspicuity or sometimes noticeability, and it is still being studied in order to increase the
effectiveness of traffic signs. See e.g.Hughes (1983) for a fairly recent account of research on the conspicuity of traffic signs.
However, lately a lot of the emphasis in conspicuity research in road traffic has been changed from traffic control devices to motorcycles.
1.2 Motorcycle safety and visibility
Compared to the interest and effort that have been directed towards the traffic safety of cars and car drivers it seems that motorcycles and motorcyclists were neglected for a long time. This relative noninterest in motorcycle safety might have been a result of the general downward trend in motorcycle accidents which primarily was caused by a general decrease in motorcycle usage. Another reason might have been that the absolute numbers of motorcycle accidents were relatively small. But from the end of the 1960's the general as well as specific problems in motorcycle safety have been discussed many times all over the world.
In 1969 the US National Highway Safety Bureau published a large-scale accident analysis, covering about 6000 collisions between motorcycles and
other vehicles (NHSB, 1969). In 1970 appeared another (symptomatic?)
article with the title "The motorcycle syndrome" (Nicholi, 1970) which was aimed more at the psychological factors behind the accidents. In Sweden, one statistical analysis showed that the number of fatalities per 10 000 motorcycles had increased from about 3.5 in 1962 to about 13 in 1970(TSV, 1972). And in an analysis of Swedish and international accident statistics
(Widén, 1973) it was found that the accident risk, equated for mileage, was
about 10 times higher for motorcycle riders than for car drivers in Sweden, about 5 times higher in USA and about 8 times higher in England.
From that time on numerous studies of motorcycle safety appeared, mostly concluding that poor visibility/conspicuity seemed to be one of the major contributing factors to many motorcycle accidents and that the use of headlights during daytime seemed to increase motorcycle safety. (This literature will not be summarized here, since it has been reviewed many times' before. The interested reader is recommended to see e g Williams (Sc Hoffman, 1979; Thomson, 1980 or Muller, 1984.)
There also appeared an equivalent number of studies aiming at not only a statistical description of the problem, but at a remedy for it, i.e. the development and testing of visibility enhancing devices for motorcycles
and/or motorcyclists . (Some of these studies will be briefly discussed, but
for more comprehensive reviews the reader is referred to e.g. Williams (Sc
Hoffman, 1977; Sator, 1981; Thomson, 1982 or to the preceedings of the
International Motorcycle Safety Conference (MSF, 1980), particularly vol III, sect VIII.)
However, unfortunately it seems that some of this research is of very
limited value. First, Williams and Hoffman (1977) pointed out some
limitations and deficiences in earlier work, and then Muller (1984), in the
most thorough statistical analysis in this field so far, did not find any support for the effects of headlights. Furthermore, the studies of visibility
enhancing devices was reviewed by Thomson (1982) from a methodological
point of view and with special emphasis on the conspicuity concept. His conclusions are that most studies have beenlacking in experimental control and/or that the measures have an uncertain validity. The only method he seems to accept is a recall technique which has been used and reported by
Fulton, Kirkby and Stroud (1980).
Although Thomson does not comment on it, unfortunately it seems that this method gives some inconsistencies, which raises some doubts about the validity of this method too. These inconsistencies are even more pronounced in a later report (Donne and Fulton, 1985) where something that could be a "negative conspicuity" is found for e.g. flashing low beam headlight. If that is a true effect it could have many theoretical as well as
practical implications, but, regrettably, this finding is not discussed by the
authors.
Besides the criticisms that have been raised by various authors it seems that still a few more could be mentioned. The first is related to the
accident statistical studies and concerns the reliability of accident data.
As long as only fatalities are counted it seems reasonably safe to assume
that the available statistics come fairly close to the "truth". But when
other accident statistics are used to describe e.g. traffic safety, then such a description can be highly misleading depending on an unknown numberof errors and biases in the statistical data. This unreliability in (traffic)
accident statistics was shown by Roosmark and Fraki (1968) in Sweden, and
by Bull and Roberts (1973) in an English follow-up and later by e.g. Willis,
Turner and Colson (1983) in USA, but still these aspects seem seldom, or
ever, to be recognised or discussed.
What makes this a point of particular interest to motorcycle safety research is a suspicion that this unreliablility might be even greater for motorcycle statistics than for traffic accident statistics in general. Winn
(1980) in a survey of US motorcycle statistics reports e.g. that one state
used to collapse trailers and motorcycles into the same statistical category. In Sweden Engstrom (1983) has claimed that the "real" number of motorcycle accidents is between four and ten times the official figures and also that there is a systematic bias in the records of accident type.
The second point of criticism concerns the applicability of the applied research on visibility devices. Disregarding the methodological and conceptual issues which Thomson (1982) discussed, most of the reports nevertheless have such shortcomings in the experimental design or in the not too-detailed accounts of the studies as to make the validity and usefulness very limited.
For example: In reporting a visibility experiment it should be natural to
include at least a minimum statement of the visibility conditions, but it
seems to be a rule rather than exception not even to mention illumination levels in the dichotomy sunny/cloudy. It is possible that the inconsisten-cies in the Donne and Fulton report (1985) could have been explained by illumination changes, but now you cannot tell because you have not got the
data.
Furthermore, if you test visibility devices you ought to report at least some of the visible characteristics that might be influencing your results. But again; in too many cases luminances, reflectances or contrasts between
devices and background are very vaguely reported (If at alll). And
intensities of lighting devices are often reported as electrical effect
(watt), a unit that does not tell very much about what a lamp looks like to an
observing eye.
Such shortcomings in experimental control and/or reporting procedures also makes it very difficult to compare and summarize all the available
data on the visibility of various motorcycle safety devices.
To summarize this section: There seems to be a general agreement that motorcyclists are a high-risk group in road traffic and that many accidents are associated with poor visibility of the motorcycle. Otherwise, it is recommended to interpret studies based on other accident data than fatal acCidents with a certain cautiousness, and to be particularly careful in cross-national comparisons or applications. Regarding the effects of visibility enchancing devices many authors have recommended the use of lighting devices or high-visibility clothing but both the statistical and experimental evidence for these conclusions seems inconclusive and/or contradictory.
1.3 Motorcycle safety in Sweden
The number of motorcycle accidents in Sweden has been slowly increasing until 1983, when it reached a peak at 1428 killed or severely injured people (TSV, 1984). These accidents were distributed about 60/40 on built up versus non-built-up areas and about 25/75 on single versus multivehicle accidents. In 1984 a committee, appointed by the Ministry of Transporta-tion, presented its report including a number of proposals for increased bicycle and motorcycle safety. The same year the Road and Traffic
Research Institute (VTI) started an accident investigation team that made
on-site investigations and follow up studies of all motor cycle accidents in one region of Sweden. Among the results of the team, there is one observation which is very similar to many earlier reports: In one half of the collision type accidents (60% of the total, 40% were single accidents) the car drivers were reported "not to have seen" the motorcycle in time to avoid the crash (VTI, 1986).
In this connection it could also be mentioned that in 1976 Andersson,
Nilsson and Salusjarvi (I976) presented an analysis that indicates a very
strong positive effect of daytime headlights upon collision-type accidents, and that, from 1977, daytime use of running lights or low-beam headlights has been compulsory in Sweden.
The accident figures of 1983, together with the committee proposals and the results of the accident investigation team put a pressure on the Swedish Road Safety Office to review the rules that affected motorcycle safety in
general, and motorcycle visibility in particular. However, this task was not
too easy because besides considering all the results and recommendation hinted at in section 1.3, it was also necessary to take the fairly recent introduced modulated headlights (See e. g. Jenkins and Wigan, 1985) into
account.
The typical function of a headlight modulator (there are several commercially available models) is that the light output varies between a high and low level, where the low level still should be well above any threshold level. This could be achieved e.g. by using the dipped beam as the base level and then periodically superimpose the high beam, or by constantly using the high beam but with a varying effect. Such devices have been tested and seem to have been favourably received (Tratner, 1980). But the experimental evidence is sparse (Olson, Halstead Nussloch and Sivak, 1981), and not without objections (Thomson, 1982; Wigan and Jenkins, 1982).
So instead of making more or less educated guesses with the available literature as a starting point, the Road Safety Office commissioned still another study of motorcycle visibility.
2 PURPOSE AND SCOPE OF THE PRESENT STUDY
With the immediate as well as long term interests of the Road Safety Office as a starting-point the study was aimed at a description of the visibility of a wide range of motorcycle appearances, equipment and devices. As far as possible the obtained visibility measures should be expressed as effects of (or relations to) general physically measurable
variables rather than as results for various brands, models etc.
3 METHODOLOGY
3.1 The measurement of visibility 3.1.1 The need for a definition
The concept visibility (and/or the closely related conspicuity) seems to
take many shapes. From the studies mentioned in the previous section it seems that visibility could be something that is remembered at a roadside interview, or something in the gap acceptance situation at intersections or maybe something that makes a person respond a plain "Yes/No" when asked if he saw something.
But really, visibility is the sum of all the characteristics of an object that makes it possible for an observer to see it against a background of other objects, shapes, surfaces, shadows, colours etc. The emphasis here must be on the observer, since visibility is a purely perceptual concept and not a physical variable like luminance or contrast. This means that in order to
measure visibility you - more or less literally have to go into, or behind,
the eyes of the observer. It also implies that visibility measures will always be relative, because they must always be related to e.g. the particular observer and everything else that he could possibly have looked at.
Of course, for a researcher who is not also a skilled neurosurgeon, it could be tempting to try e.g. a behavioural measure as an index of visibility. From neither a scientific nor an applied standpoint any major objections could be raised against such a strategy, provided that the relation between this
index and the "true visibility" can be stated (or at least assumed) with some
certainty. Ideally such a relation should be linear, or, as a minimum requirement, follow some monotonic function. Unfortunately, it seems
that the indices used in the Olson et al study (1981) and Fulton et al study (1980), although having high face validity, seem to show remarkably
non-linear relationships to a more common concept of visibility (or
conspicuity).
Paranthetically it could be mentioned that in colour science the need for observers to look at perceptual phenomena was recognized a long time ago, and consequently an "ideal observer" has been defined. The relativity of
perceptual observations hasalso been recognized and minimized through the formulation of a set of procedures and conditions. For a comprehensive
review of colour science see e.g. Wyszecki and Stiles (1982).
3.1.2 Visibility versus conspicuity
Since there does not seem to exist any universally agreed upon definition of
these concepts it seems fair to explain one's own personal semantics in this respect:
Visibility is the overall concept which means that something, somehow can be seen, i.e. be recorded by the (human) eye. Within the full visibility range there are regions that can be labelled e.g. detectability, noticeability and
conspicuity, where conspicuity covers the levels ofhighest visibility. Most
authors on this subject seem to include some kind of "attention getting"
qualities in the conspicuity concept (Hughes, 1983). But to me, these
attentional factors do not put visibility and conspicuity on separate dimensions the attraction of attention should merely be the result of very high visibility levels.
It should also be noted that there are exceptions to the attention advocates.
In the traffic research area e.g. Cole and Jenkins (1980) have proposed a
definition of conspicuity which is explicitly lacking all references to any concept of attention.
But where on the vast visibility continuum should motorcycles be found? They ought to be more than just detectable, but is "fair" visibility enough or should they have such a visibility as to be conspicuous? An answer would have been easier regarding e.g. ambulances, but still it was necessary to choose because of the many implications for the contents, method and validity of the study.
For several reasons it was decided not to treat motorcycles as ambulances
but to aim the study at a general visibility concept without any particular
treatment of attention attraction.
3.1.3 The chosen method
After considering both theoretical and practical aspects it was decided to use the estimation technique which is known as magnitude estimation. The characteristic of this method is that the observers are asked to give numerical ratings to their subjective experiences. Sometimes a reference
is supplied, sometimes not (Stevens, 1957); in this case a car was used as a reference stimulus and its visibility "score" was set at 100, and the
observers were told to make all their estimations and ratings with this car and its visibility as the reference.
The simplicity of the method means several advantages at the same time as it generally generates some scepticism. However, with careful instructions to the estimating subjects this method seems to have given valid and reliable results in a number of most dissimilar settings e.g. studies of severity of international conflicts and seriousness of criminal offences
(Stevens, 1975) as well as studies of physical exertion (Borg, 1978) besides
the more "typical" studies of pure sensory phenomena (Stevens, 1957, 1971). The method has also been validated in a traffic setting in an earlier
study of pedestrian visibility (Dahlstedt, 1973).
FOUR ALTERNATIVE MOTORCYCLE DIRECTIONS OBSERVERS 130. I
LEE
ng; - -- 5""
@C : : \ HALE b : mI
7
i7!
55 mAVERAGE DISTANCE OBSERVERS/MOTORCYCLE
OBSERVATION RANGE
Figure 1. Outline of the experimental setup (Not to scale)
10
3.2 Procedure
3.2.1 Realization
In Figure l the layout of the experiment is indicated and Figure 2 gives an example of an experimental situation. The study was run on a flat, even part of a drive-in movie (By the courtesy of the owner, Australian Telecom). On one side of this area the subjects were seated facing the car as seen in Figure 2. Every subject was wearing a helmet on which a translucent visor was fitted. The visor could be moved up and down by two small electric motors which were remotely controlled. In its lowered position the visor did not permit any recognition of visual shapes within +/-600 from a straight-ahead direction and 300 down from a horisontal direction. It provided only a contourfree screen with a luminance equal to that of the experimental surroundings.
presenting the 300 left attitude. Note the running lights under the bumper of the car.
At the beginning of each experimental run the experimenter, supervising behind the subjects, called out an alert like "Here comes the bike". Then,
11
when the motorcycle was approaching the car, he said "Ready", and when the motorcycle was just beside the car the visor was raised for one second, permitting an unobstructed view. After this one second interval the visor was lowered again without any warning and the subjects recorded their visibility estimates. Due to computer troubles this was usually done by means of paper and pencil, but during some sessions the subjects keyed their responses straight into a computer.
3.2.2 Instructions
The study was run as group experiments with four to six subjects in each group. When each group gathered they were first engaged in a brief discussion with the experimenter concerning habits, safety and politics in Swedish versus Australian traffic. This was meant as a general introduction with a purpose of giving the experimental task some meaning to the subjects. In retrospect it seems to have worked as a very powerful
motivator.
- Another motivating factor might have been the fact that the subjects were promised a fee of S 60 (about 330 SEK). However, this fee was not conditional upon their performance in any way.
-The experimenter ended the discussion by telling about the present tasks and defined the concept of visilility as "the qualities of an object, which makes it easy or difficu1t to see in comparison to all other objects around". The range and relativity of visibility was further explained with some metaphors about weight lifting. Then the concept of standard was introduced and the role of the car as a visibility reference was explained. During this part of the introduction the visor helmets were also shown, explained and fitted.
After that followed the practice; first with stationary vehicles and raised visor, then with moving visor gradually decreasing the exposure time to one second and with moving motorcycle. During the first presentations the subjects were told only to judge which was the most visible, then to
estimate if the visibility difference was great or small and finally to translate this difference into a numerical estimate of the visibility of the
12
motorcycle. This estimate should be expressed as a ratio to the visibility of
the reference car, which was set at "100".
The practice trials were also used to give the subjects a sample of the full range of motorcycle appearances. At the same time they were also cautioned that visibility is not just a headlight or a bright colour but the total of their visual impressions. In order to minimize the need for comparisons and communications among the subjects it was also emphasized that there was nothing "right" or "wrong" in this study and that
any personal estimate was as good as any other.
3.2.3 Experimental design
In the first discussions of this study it was hypothetically calculated that to study the effects upon motorcycle visibility of some of the major influencing variables in a single factorial design, it would take a ten-factor design with 97200 conditions. Reality stopped that hypothetical thinking
quite soon, but at least it gave an indication of some of the problems you
encounter when you try to squeeze a real-life problem into a scientifically
controlled situation.
After some consideration the number of variables, and the number of levels
within each variable, were reduced a little. The remaining variables were then grouped into four main categories; motorcycle appearance, rider appearance, devices emitting a steady light and modulated light. Each category was to be treated in an experiment in order to give at least an
indication of the effects of its variables.
After the first pilot tests it was necessary to decrease the number of conditions a little more but the extent of the experiment was still almost six hours. The final arrangement was to split the two most time consuming subsessions, motorcycles and riders, into two halves and then carry out the six subsessions distributed over two days. Thus, each session started at l p.m. and was opened with the introduction. Then followed three experimental subsessions until around 4 p.m. The following day (weather permitting!) the three remaining subsessions were run between 9 and
11.30 a.m. Over four consecutive sessions the order of subsessions was
l3
balanced between and within the afternoon and morning halves. Within each subsession the order of the experimental conditions was independently
randomized.
3.3 Subjects
The subjects were recruited from three sources, an employment agency, a nearby university and the fire brigade - about one third from each. The employment agency provided mainly women in a rather wide agerange. From the university came both male and female students in the age range 20-25 and the off-duty firemen were all male in the ages between 30 and 50. Complete sets of data were obtained from 53 subjects. A few more had participated but could not be included, either because the session was interrupted (by rain or other trouble) and could not be resumed or because the subject disappeared after the first session and thus did not render a complete set of individual data.
Thus, although the sample of subjects cannot be said to be statistically representative, at least it seems to provide a reasonable distribution of ages, sexes, interests and traffic experiences. During the introduction the experimenter tried to get some indications about the attitudes towards motorcycles and motorcycle safety. It was clearly evident that the opinions differed between the subjects, but as far as the experimenter could decide there were no extreme prejudices or idiosyncrasies neither pro, nor con,
motorcycles.
No visual tests were made. Colour vision was of a certain interest in the study, but the probability of finding a subject with an anomaly for yellow
(the main colour in the experiment) was considered extremely small.
Differences in visual acuity might of course influence the results - but the same effects are also found in real traffic - so this variable was considered a source of "true" variability and therefore not controlled in the experiment. The only minor control in this respect was that the subjects, who reported wearing glassed during driving, were told to use the same glasses during the experiment. No sunglasses were permitted during the
l4
experiment with the exception of two subjects who had photochromatic lenses in their glasses.
3.4 Environmental factors
The immediate environment which provided the background for the car and the motorcycle can be seen in Figure 2. Outside the picture the drive in ground extended about 150 m in one direction, and about 300 m in the other and about 200 m behind the building in the picture. All this area was covered with a fairly uniform bitumen-gravel mixture providing a very homogenous visual field with a greyish colour. The only exceptions, besides
the building, car and motorcycle, were some trees in the distance, which
could be seen on either side of the building. As a biological curiosity of some interest it is worth noting that the foliage of native Australian trees has a pronounced greyish tint compared to European trees.
Already at the planning stages it had been decided to study visibility under sunny conditions. That decision was based on the fact that all visibility devices work by increasing the brightness of the motorcycle, or some part of it. So to arrange a decisive test sunny conditions with high illumination
and luminance levels was ordered. However, the Melbourne weather in
November 1985 offered very few days with uninterrupted sunshine which, in the end, made it necessary to run experiments also during fairly cloudy
conditions.
(According to a local saying Melbourne has four seasons - each day! Unfortunately the experimenter was not told this until half way through
the series of experiments.)
Although the preferred sunny conditions had to be partly given up some minimum requirements were still adhered to. These requirements were: dry surfaces, no precipitation and a minimum illumination of 25000 lux. During all but a few of the first subsessions the experimenter then kept a log of the illumination level. These records were then tabulated in three categories: "low" (<50 000 lux), "medium" (50000-100000 lux) and "high" (>lOOOOO lux), in order to permit comparisons between the illumination conditions and the visibility results.
15
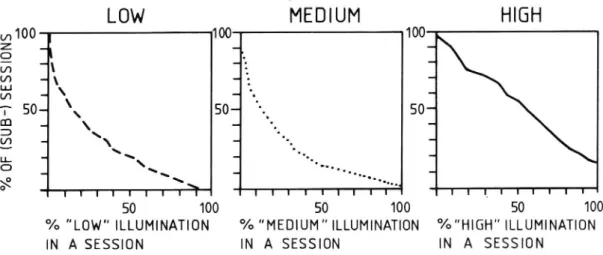
From these records it was possible to calculate the amounts of high, medium and low illumination under various proportions of subsessions, which is presented in Figure 3. From the Figure it can be seen that 100% "High", i.e. all sunny, occurred in about 15% of the sessions. Arithmetic means were also calculated and from these an "average" session can be described as consisting of 54% high, 24% medium and 22% low illumination.
LOW
MEDIUM
HIGH
m IOO 100 100 Z q. q, -I
a «I
-
a
(f) -\ .. 1a: _ \
-
+
T 50
\
50~
50+
CD _. \ _, _I332
\\
-\\ _. _.( 5
I
\\
°\° -I \\ ... _ I I I I I I I I I I I I I I I I I I I I I_ I I I I I l 50 100 50 100 50 100 °/o "LOW" ILLUMINATION % "MEDIUM" ILLUMINATION °/o"H|GH" ILLUMINATION IN A SESSION IN A SESSION IN A SESSIONFigure 3. Relative amount of three categories of ambient illumination for various proportions of (sub-)sessions. LOW: <50 000 lux, 50 000 < MEDIUM < 100 000 lux, HIGH: > 100 000 lux.
3.5 Experimental conditions 3.5.1 Non-experimental conditions
The expression "non-experimental conditions" is used in order to emphasize
that, of course, a number of factors besides the true experimental
treatments (to be discussed below) had an effect on the results of the
experiment. Some of these factors varied without any control, e.g. the subjects, thus increasing the variance in the experiment. Other factors fluctuated with some degree of control, e.g. the illumination, the effects of which could possibly be compensated for by statistical methods. Still other factors were explicitly held constant.
Two more factors of the first, "uncontrolled" kindought to be mentioned, and they are both related to the illumination situation. The line of sight
16
from the observers to the car was almost straight east west. Since a
complete experimental session ranged from 9.00 (a.m.) until 16.00 (4 p.m.)
it means that the illumination angles varied all around from front to back of the motorcycles (and consequently from back to front of the observer). The second factor of some importance is the direction of the motorcycle. With reference to Figure 1 the illumination was always coming from somewhere below the bottom half of the Figure, so when the motorycle was driven in a direction for the left line of sight, it always presented its sunny side. But when the motorcycle was seen along the right line of sight it always presented its shaded side. These two factors together had a noticeable influence on the appearance of the motorcycles, but theeffects have been collapsed into the total visibility scores, thus hopefully increasing the general validity of the results.
Among the factors that were held constant at least the following ought to be mentioned in order to specify the experimental set up:
background against which the motorcycle was seen: a fairly uniform greyish surface with an average reflectance of 11%, calculated for various spots and illuminations, and a somewhat darker (reflectance about 8%) stone wall. The luminance of the wall differed considerably between morning and afternoon because of shadows, but the effect of this variation should be neutralized by the balancing procedures in the experimental design
reference car: a Mazda 323 with a bluish grey metallic colour. The diffuse reflectance was not calculated because the luminance of the car was mainly dependent on specular reflections in the glossy surfaces. The car was fitted with two yellow 6x13 cm running lights under the front bumper, each running light emitting 275 cd towards the observers. The car was stationary in the same position during all the sessions
observation distance, i.e. between the observers and the car or between
observers and "average" position of the motorcycle: 55 meters
- lateral distance, i.e. the distance between the car and the average
position of the motorcycle: 3 meters (30) motorcycle speed: 50 km/h.
17
3.5.2 Steady lights
In one of the four substudies the interest was focused on the effects of various configurations of steady lighting. Nine of the conditions are combined in the following table, in which light intensities for the 50 attitude also are presented.
Intensity Headlight Double Headlight + sidelights sidelights Low #25 2x150 425 and 2x150 cd Medium 1375 2x425 1375 and 2x425 cd High 5000 2x1250 5000 and 2x1250 cd Moreover, three conditions with yellow light were studied. The conditions were the same as low headlight, medium sidelights and high head-sidelights in the table above except that the light was yellow and 20% less intense due
to losses in the filter.
In four conditions, corresponding to headlights+sidelights of medium or high intensity, mixtures of white headlight and yellow sidelights (and vice versa) were tested. Another condition included steady lighting from the turn indicatorstogether with medium intensity headlight. In a final "base level" condition a plain grey motorcycle was presented.
In the 300 attitude the light intensity towards the observers dropped to very low levels (e.g. 170 cd from high intensity headlight) so after a few pilot
trials most of the low and medium intensity treatments were deleted from
the 300 presentation since the visual impression of these conditions were the same as for the plain motorcycle. A complete listing of all light intensities is found in Appendix 1.
The headlight of the motorcycles in all the substudies were 6.5 inch Stanley headlamps with symmetric light distribution. The high beam filament was used in all conditions and to obtain the low light intensities without changing the colour temperature the light output was reduced by putting grey wire mesh filters in a frame in front of the headlight. When the light was yellow a Cinemoid filter No 50 was also put into the same frame.
18
The sidelights were 10x10 cm Bosch back-up lights that had been given a certain "tuning" by Robo AB, Linkoping, to fit the requirements of this experiment. Originally, they were mounted #5 cm below the headlamp center and 45 cm apart, thus making the corners of an almost equilateral triangle. However, after a few turnovers with the motorcycle the symmetric configuration was somewhat changed, as might be seen i Figure 4, but at least the alignment of the lights could be maintained. Changes in colour and intensity were made with filters in the same way as for the headlamp. When the sidelights were not used, i.e. when the bike appeared with headlight only or as completely "plain", they were hidden in neutral grey covers.
The rider was wearing a grey overall and an integral helmet with a grey cover on - the grey cloths having a reflectance of about 9%, Le. a medium to dark grey. The painted parts of the motorcycle were also grey.
3.5.3 Modulated light
The modulated light was emitted from the headlamp only. The same motorcycle and headlamp as in the subsession on steady light was used. The maximum light intensity at 50 towards the observers was set at 5000 cd by
means of filters as before, but all other variations were accomplished by a
small electronic box. The electronics permitted a variation of both frequency and duty cycle (Duty cyclezproportion of high vs low, or on vs
off, in a cycle), and it also enabled the setting of the steady state low level.
l9
Figure 4. Sketch of the plain motorcycle with the lighting arrangements and the motorcycle with thesmall and the big fairing. Top row
shows 50 attitude and bottom row 300 attitude
20
In the experiment the low level was set at 1100 cd, i.e. a ratio of about #.5:
1 between high and low. The duty cycles were set at 80/20, 50/50 and 20/80,
nominally. The frequencies were 2/3 Hz, 4/3 Hz and 6/3 Hz (or 40, 80 and 120 cycles/minute). The frequencies and duty cycles were combined factorially to give nineseparate experimental conditions.
The light source was an ordinary 12 V/45 W tungsten filamentbulb which, in these circumstances, has a noteworthy "inertia". Therefore, the actual modulation characteristics were measured and the results are found in Appendix 2. The "true" output was not exactly similar to the nominal values but the differences were not greater than to make it seem permissible to keep the original denominations.
After a few tests two of the nine combinations were deleted from the experiment. These were the two faster frequencies combined with the duty cycle 80/20 which gave an impression of a steady light. To make comparisons with other substudies possible three reference conditions were also included, viz plain bike, medium headlight and high intensity headlight. These conditions were identical to those in the steady light substudy. The grey rider and grey motorcycle were also identical to those in the steady light substudy.
3.5.4 Motorcycle size and colour
The appearance of the motorcycle was varied in two ways, partly by
changing the frontal area by means of a small or a big fairing (see Figure 4), partly by changing the colour of the fairing. A third dimension was also studied because all size/colour combinations were also presented together
with high intensity (5000 cd) headlight.
The small fairing gave a projected area of 1250 cm2 in the 50 attitude and 1100 cm2 in the 300 attitude. The big fairing gave 2800 cm2 in the more
frontal view and 3100 cm2 in the 300 side view.
Two separate motorcycles were used in this substudy, one equipped with the small fairing, the other with the large fairing. To change colour of
21
fairing a snugly fitting cloth cover was exchanged for another of another colour. The headlights of the two motorcycles are also of some interest. They were of the same make and model but still they did not give exactly the same output as can be seen in the light intensity table in Appendix 1. However, the measured differences cannot be considered to be of any perceptual or practical significance.
The four tested colours were white, black, greenish yellow and fluorescent
greenish yellow. The white was plain white with a reflectance of 85% and the black was a black with a reflectance of 1%. The fluorescent yellow had a "reflectance" of 100% and it could possibly be described in NCS coordinates as ( 10) 100 G85Y (SIS, 1979). These numbers mean that the colour was outside the lightness range, it had maximum chromaticity and that it was quite close to a pure yellow. The nonfluorescent yellow was, as
the manufacturer said, "as close as you can get" (i.e. without using
fluorescent pigment). The hue of this colour looked rather similar to the fluorescent one, but the lightness was of quite another magnitude. The NCS designation should be around 0080-G85Y and the reflectance was 72%.
Three reference conditions were included also in this substudy. They were the same as before, i.e. plain grey bike, medium intensity headlight
(1375 cd) and high intensity headlight (5000 cd).
The rider was wearing the same neutral grey (9%) outfit as mentioned
before.
3.5.5 Rider colour
The heading "rider colour" might be a little misleading, because there was really only one chromatic colour, the same fluorescent as for motorcycle
colour, and three achromatic colours, white, grey and black. All four were
the same as previously defined, but in this substudy the colours were found
on the outfits on the riders, i.e. on overall and helmet.
These outfits were factorially combined with four of the motorcycle variations that have been presented in the previous sections, viz. plain
22
motorcycle, plain+medium intensity headlights, big white fairing and small fluorescent fairing. Various parts of the rider were naturally hidden by the fairings and their dark tinted screens so a number of calculations were made to assess the "effective" area of the rider in various positions (compare Fig 4). The arithmetic means of these calculations of "effective
rider area" were (cmz):
Attitude No fairing Small fairing Big fairing
50 2900 1800 1250
300 3100 2200 2300
3.6 Statistical analysis
Since the purpose of the study was primarily descriptive, and also because some of the experimental treatments were chosen so as to make tests of significance practically and/or theoretically pointless, only a very rudimentary summing up was undertaken. This means that, after a scale transformation, only arithmetic means and 95% confidence intervals were calculated for every experimental treatment.
Besides the calculation of the averages a few correlational analyses were made, primarily to study some of the reliability issues.
4 RELIABILITY
As an introduction to the presentation of the results first a few
"metaresults" could be discussed.
Already at the very first preliminary inspections of the data it became evident that although the overall trends seemed reliable, still the results of individual subjects differed widely. As an example: two subjects had almost identical rankings of their visibility estimates but one of them had expressed it as ratings between 75 and 150, the other with ratings between
35 and 750. Such differences were not assumed to be caused by different
visual sensitivities among the observers, but rather by the application of
23
various private and unorthodox arithmetic procedures at the calculation of visibility "ratios".
In order to compensate for these large range effects all individual data were standardized before any further calculations were made. The standardization means that for each subject every observation is expressed as standard deviation units from the individual grand mean. This means that according to the Gaussian normal curve 95% of the observations should fall within 1.96 standard deviations. But to make the numbers somewhat more manageable the standard deviation units were multiplied by 50 and rounded to the nearest integer to give the arbitrary unit SEV. SEV can be taken as an acronym for Subjective Estimated Visibility or perhaps Surprisingly
Enduring Vigilance (i.e. by the subjectsl).
Unfortunately this transformation also changed the meaning of the number
"0" (zero). By definition "0" should have meant no visibility at all, but after
the transformation "0" is just the grand mean of each subject and does not
have any definite relation to any predefined visibility level.
For each experimental treatment the subjects had made two pairs of visibility estimations, for 50 left and right, and for 300 left and right. Although the appearance of the motorcycle was far from identical in the left and right attitude, still the similarity of conditions within each pair was considered sufficient to use as a basis for relability calculations. The reliability coefficients were calculated as product-moment correla-tions for every subject within the four substudies and also as grand totals over all subjects. The grand totals are shown in the first column of table 1, and about the individual coefficients (presented in appendix 3) it seems reasonable to conclude that the subjects mostly made very stable judgements.
24
Table 1. Total reliability coefficients and average between-subject correlations for the four substudies
Within Between subject subject Lights . 83 . 86 Modulation . 81 . 78 Motorcycle . 79 . 77 Rider . 84 . 84
The figures in the second column can be taken as an overall index of how well the subjects agreed on the visibility concept and as a very tentative interpretation, it seems as if their "visibilities" at least have some
characteristics in common.
But to get an impression of possible systematic effects among the "deviates", i.e. those subjects with one or another correlation less than .70, another tabulation was made of the subject correlations within each substudy. This time each subject was categorized according to both within-subject correlation (> or < .70) and average correlation with all other
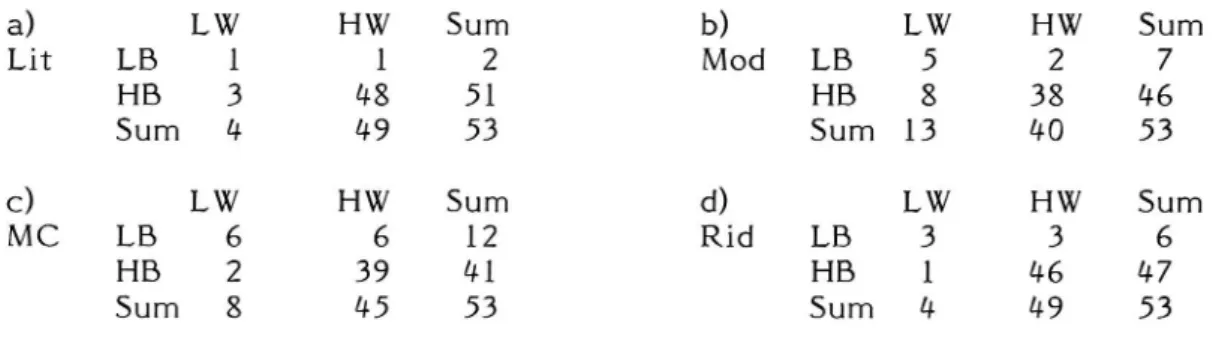
subjects (Between; also > or <.70). The results are presented in Table 2 a-d. Table 2. Number of subjects with high (HW) or low (LW) withinsubject correlations and high (HB) or low (LB) betweensubjects
correla-tions for the four substudies
a) LW HW Sum b) LW HW Sum Lit LB 1 1 2 Mod LB 5 2 7 HB 3 48 51 HB 8 38 46 Sum 4 1+9 53 Sum 13 4O 53 c) LW HW Sum d) LW HW Sum MC LB 6 6 12 Rid LB 3 3 6 HB 2 39 41 HB 1 46 47 Sum 8 45 53 Sum 4 #9 53
As can be seen in the LB/HW cells there was always some subject who had a reliable deviant opinion. But, as can be seen, the total number of such "deviates" is fairly small. It must also be noted that no subject appears more than once in any of th four LB/HW cells. To use theexpression "deviate" can also be misleading because in most cases the difference from .70 is quite small, and in no case did a subject show such a personal opinion as to give a negative correlation.
25
Another cell of some interest is the LW/HB, which contains those subjects with low reliabilities but with a high degree of agreement with the other subjects. The only subject, who appears outside the I-IW/HB cell in all the four substudies, has ended up in this cell in three cases. In the fourth substudy - motorcycles - this subject was put in the low/low cell.
50, considering the non optimal conditions for attaining perfect reliabili-ties it seems that the presented results indicate a general subject performance that was far from random.
The reliability coefficients have also been used to assess the effects of the illumination changes which was caused by the unwanted cloudiness. As a general comment, judging from the fairly high overall reliability, it seemed that the illumination changes cannot have had any vital influence on the visibility estimates. But in order to test this assumption a small analysis
was undertaken.
From the experimenter's weather records it was possible to pick out six experimental sessions when the weather had been steady five with sunshine, one with consistent light clouds. These sessions were matched, for the same groups of subjects, with the session that seemed to have offered the most and/or greatest illumination changes. The assumption was that if the illumination changes had any marked influence on the visibility of the motorcycles, then it would show up as higher reliability coefficients for the steady weather sessions (i.e. less uncontrolled variation in the visibility estimates because of less uncontrolled variation of illumination).
But, on the contrary, in four cases there were no differences at all, and in
the other two cases the reliabilities were actually somewhat higher for the sessions with greater variability. So it seems that the meteorological factors neither managed to stop the experiment nor overthrow the results. Another matter of reliability are the results for the reference conditions which were included in order to facilitate comparisons between the four substudies. The results of these particular conditions can be found and compared in the presentation of results in Figures 5, 7 9. They can also be
found in the overall summary of results in Appendix 4, where they are
marked "REF" in the left side column. As can be seen, there is a notable
26
stability in the results. This can be taken as a further indication of the reliability of the visibility estimates, and it also implies that the interested reader should be able to make any comparisons that he pleases among all
the results.
But before you set out hunting for significant differences, here is a word of caution: A confidence interval is an indication of where you (with a certain probability) could find the "true" mean of the population from which your data have been sampled. Thus, it is not a test statistic meant to be used to produce *-, **- or ***-significances. Furthermore, an uncontrolled testing of all the possible differences between a hundred means might have unsuspected and unpredictible consequences for the levels of significance you think you are working with (unless you are a qualified statistician). So,
as Hays (1974) put it, don't go "datajuggling" with a "shotgun" approach, but
be careful with your comparisions and treat the confidence limits more as an index of reliability of each specific result.
5 RESULTS
(As was noted above the transformation of the original visibility estimates changed the meaning of "0". It also changed the meaning of "100", i.e. the standard visibility of the car. To compare the results to be presented below with the visibility of the car, please note that the "transformed standard
visibility" of the car was -5 (minus five) SEV.)
5.1 Lighting
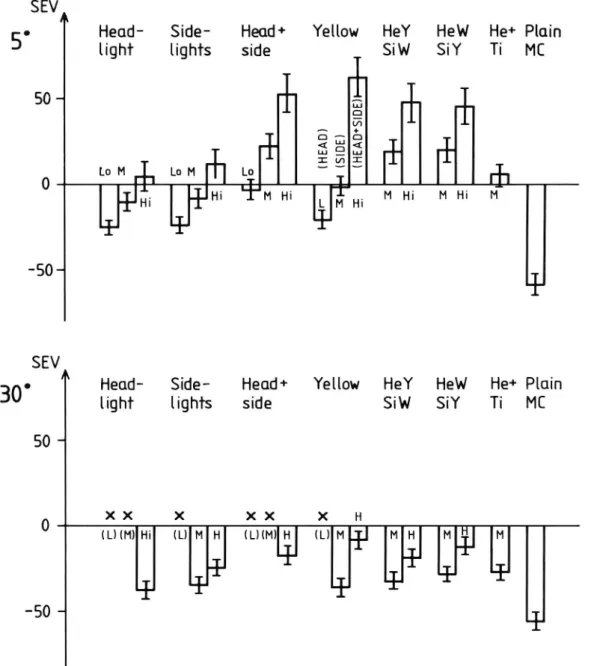
The substudy which was focused on various arrangements of steady lights included 18 treatments with the motorcycle in the 50 attitude and 12 treatments in the 300 attitude (see section 3.5.2). The results are presented as bar graphs, indicating arithmetic means and 95% confidence intervals, in
Figure 5. Each result is based on (53 subjects) x (2 replicates) = 106
observations.
27
SEVA
5- Head- Side- Heud+ Yellow HeY HeW He+ Plain light lights side SiW SiY Ti ME
SO " % a
0 Lo M A; Lo M HLI Lo 5 f E Eh
LP]; UPHi TM Hi
L M Hi M H.
'M 7H:
M:
-50- {J
SEVA
30- Head- Side- Heod+ Yellow HeY Hew He+ Plain light lights side Siw SiY Ti MC 50 a
0 x x x x x x H 7 7
(HM) Hi (DIM HI (dimly lull Ty IMIHI Eli] El
-50 - _Ij
Figure 5. Results from the "Lighting" substudy for the 50 attitude (top)
and 300 attitude. (The bars indicate arithmetic means and the
thin line through the top of each bar indicates 95% confidence intervals. All abbreviations are explained in the list in the
beginning of the report)
28
There are many details in the results, which could be elaborated upon, but only a few more general comments will be offered here. Note for instance the drastic decrease from 5 to 300. But even in 300 the least effective of the tested lighting arrangements seem to increase visibility compared to the plain bike. Mixtures of white and yellow light seem to decrease rather than increase visibility, while all yellow seems to improve visibility (although being 20% less intense than corresponding arrangements with
white light).
A final point to note are the results for one, two and three lights, respectively, i.e. for single headlight, double sidelights and headlights together with sidelights. In Figure 6 the results for these conditions in the 50 attitude are enlarged and plotted against light intensity converted to the corresponding illumination levels at the eyes of the observers at a distance
of 50 metres. From the Figure it can be seen that (at least within this range)
the number of lamps seems just as important as the amount of light.
SEVA
50
,A
O
J.
l
v/l
,t
l
l
>
0.1
0.2/®;/' 0.5/ 1.0
2.0
5.0 Illumination
-10 -
,A
at the eyes
, I /
of the
obser-_
(A,
/
vers ( ux)
l
Figure 6. Subjective estimated visibility as a function of illumination at the eyes of the observers (at 50 m) and number of lights
A: single headlight, D: double sidelights,
(X): headlight + sidelights
29
If e.g. you have a single lamp on a motorcycle giving an illumination of 0.5 lux, it seems that the visibility would increase more if the same amount of light was emitted from two (and even more from three) lamps than it would be if the single lamp output was doubled to give 1.0 lux.
5.2 Modulation
The results of the substudy on modulated headlight are presented in Figure 7. Some bars are missing from the graphs and have been exchanged for x-marks. These deletions were the results of a rationalisation when it was found that some of the modulated lights were not perceived as modulating
at all.
Besides the great differences between the 50 and 300 conditions, which also was noted for steady lights in section 5.1, all other differences are too small to interpret. Thus, the tempting stepwise pattern for the 2/3 Hz conditions should not be interpreted as a pattern but rather as a coincidence, which possibly might be further investigated in another study. Another comment could be made regarding the overall visibility levels of the modulated light. With reference to other experiences (see section 1.3) much higher visibility ratings could have been expected. Why the results differ from the expectations is hard to say, but it may be that the expectations were too high, because at leaSt there seems to be a noticeable
difference between modulated light and no light at all (at 5°).
5.3 Motorcycle size and colour
The results formotorcycle appearance are found in Figure 8. As before the results are presented as bar graphs representing the arithmetic means and 95% confidence intervals of 2 replicates from each of 53 subjects. The results are clustered for black, white, yellow and fluorescent yellow (and the reference conditions). Within each colour the results are further
subdivided depending on size of the fairing (small/big) and whether the high
intensity headlight was on or off.
3O
SEV
so A
2/3 Hz
4/3 Hz
2H2
Plain MC
50
25
-8/2 5/52/8
- 5/52/8
- 5/52/8
X Xi T
W
1F
-25 _
-SO -
.P
OFFMedHiSEVA
30'
2/3 Hz
4/3 Hz
2H2
Plain MC
50
25
O
8/2 5/5 2/8
5/5 2/8
5/5 2/8
X X -25 _._w_
¥¥y
i?
¥+
¥¥
OFF Med HiFigure 7 Results from the substudy of "Modulated headlight" for the 50
(top) and 300 (bottom) attitudes. The height of each bar
indicated the arithmetic mean and the thin line indicates 95% confidence interval.
The results are arranged according to frequency of modulation
(2/3, 4/3 and 2 Hz) and duty cycle, i.e. amout of high/low light intensity (cf Appendix 2)
3i
SEV
5' A Black
White
Yellow
Fluoresc
Plain
COLOUR
$858 $358 $858 $858 SIZE
100-50
0 1-H] m Tff!" III %
I'lli
'1
{J
-50...
OFF HI OFF Hi OFF Hi OFF Hi OFFMedHi LIGHT
SEV .
30. ll Black White Yellow Fluoresc Plain COLOUR
$858 $858 $858 $858 SIZE
50-liIT i'T LP 1"
-50 T .1
OFF Hi OFF Hi OFF Hi OFF Hi OFFMedHi LIGHT
Figure 8 Results for "Motorcycle colour and size" (means and 95%
confidence intervals) for 50 (top) and 300 (bottom) motorcycle
attitudes.
Abbreviations are explained in the list in the beginning of the
report.
32
From all the details in the Figure it seems possible to pick out some consistent trends; e.g. the larger size seems to increase visibility somewhat irrespective of colour and headlight, and the use of headlight also seems to increase visibility irrespective of colour (except maybe for
the big white fairing at 300).
The rank order between the four colours can probably be characterized as "expected" with black getting rather low visibility estimates, white and yellow getting medium ratings and the fluorescent yellow getting rather high ratings, even without headlight.
It should, however, be pointed out that the low visibility of the black coloured fairings might be somewhat too low because of an experimental artefact. Ordinary black motorcycles or black fairings usually have a rather (sometimes, very) glossy surface which might influence visibility.
The tested fairings, in contrast, had very matte surfaces.
5.# Rider colour
Four rider colours (black, grey, white and fluorescent yellow) were tested in various combinations with four motorcycles of varying visibility. The motorcycles were: the plain reference bike, plain with medium intensity headlight, big white fairing and small fluorescent yellow fairing. The results, clustered according to colour and subdivided according to motorcycle, are presented in Figure 9. In this substudy no special reference
conditions were included since two of the ordinary three references were
already included as "experimental" conditions. Those two were the grey rider on the plain bike, with and without headlight.
In the Figure it might be interesting to note that this is the substudy that seems to give the least differences between the 50 and 300 attitudes. Concerning the rider colours it seems as if black and grey riders have got the low visibility they are supposed to have. The low visibility ratings seem
possible to improve with headlight (except at 300) or with a bright fairing.
An all white rider seems fairly visible on a plain bike. But nevertheless, also
33
SEV
Fluoresc
.
l
l
5
100
Black
Grey
White
'}'
50-
1-0
T
L
L
f[T sFl
Bw
{Jaw
- sFl
P L BWsFl
P L BWsFl
L
L
-50- -l-
p
{-p
SEVA
Fluoresc
30'
r}
100-Block
Grey
White
SO-0
_
J11 e
P L BWsFl
P L BWSH
-so-
-P}
iJ-P
P L BWsFl
P L BWsFl
Figure 9 Results from the substudy on "Rider colour" (means and 95%
confidence intervals) for 50 and 300 (bottom) motorcycle
attitudes.
Abbreviations are explained in the list in the beginning of the report.