ACTA UNIVERSITATIS
UPSALIENSIS
Digital Comprehensive Summaries of Uppsala Dissertations
from the Faculty of Medicine 1045
Towards High-Throughput
Phenotypic and Systemic Profiling
of in vitro Growing Cell Populations
using Label-Free Microscopy and
Spectroscopy
Applications in Cancer Pharmacology
OBAID AFTAB
ISSN 1651-6206 ISBN 978-91-554-9082-9
Dissertation presented at Uppsala University to be publicly examined in Robergsalen, entrance 40, 4th floor, Akademiska Sjukhuset, Uppsala, Tuesday, 25 November 2014 at 09:30 for the degree of Doctor of Philosophy (Faculty of Medicine). The examination will be conducted in English. Faculty examiner: Neil Carragher.
Abstract
Aftab, O. 2014. Towards High-Throughput Phenotypic and Systemic Profiling of in vitro Growing Cell Populations using Label-Free Microscopy and Spectroscopy. Applications in Cancer Pharmacology. Digital Comprehensive Summaries of Uppsala Dissertations from the Faculty of Medicine 1045. 50 pp. Uppsala: Acta Universitatis Upsaliensis. ISBN 978-91-554-9082-9.
Modern techniques like automated microscopy and spectroscopy now make it possible to study quantitatively, across multiple phenotypic and molecular parameters, how cell populations are affected by different treatments and/or environmental disturbances. As the technology development at the instrument level often is ahead of the data analytical tools and the scientific questions, there is a large and growing need for computational algorithms enabling desired data analysis. These algorithms must have capacity to extract and process quantitative dynamic information about how the cell population is affected by different stimuli with the final goal to transform this information into development of new powerful therapeutic strategies. In particular, there is a great need for automated systems that can facilitate the analysis of massive data streams for label-free methods such as phase contrast microscopy (PCM) imaging and spectroscopy (NMR). Therefore, in this thesis, algorithms for quantitative high-throughput phenotypic and systemic profiling of in vitro growing cell populations via label-free microscopy and spectroscopy are developed and evaluated. First a two-dimensional filter approach for high-throughput screening for drugs inducing autophagy and apoptosis from phase contrast time-lapse microscopy images is studied. Then new methods and applications are presented for label-free extraction and comparison of time-evolving morphological features in phase-contrast time-lapse microscopy images recorded from in vitro growing cell populations. Finally, the use of dynamic morphology and NMR/MS spectra for implementation of a reference database of drug induced changes, analogous to the outstanding mRNA gene expression based Connectivity Map database, is explored. In conclusion, relatively simple computational methods are useful for extraction of very valuable biological and pharmacological information from time-lapse microscopy images and NMR spectroscopy data offering great potential for biomedical applications in general and cancer pharmacology in particular.
Keywords: label free vesicle detector, high-throughput, phase contrast microscopy, Library of Pharmacologically Active Compounds, High Content Screening, fluorometric microculture cytotoxicity assay, nuclear magnetic resonance, mass spectrometry
Obaid Aftab, Department of Medical Sciences, Cancer Pharmacology and Computational Medicine, Akademiska sjukhuset, Uppsala University, SE-75185 Uppsala, Sweden. © Obaid Aftab 2014
ISSN 1651-6206 ISBN 978-91-554-9082-9
List of Papers
This thesis is based on the following papers, which are referred to in the text by their Roman numerals.
I Obaid Aftab, Mårten Fryknäs, Xiaonan Zhang, Angelo De
Milito, Ulf Hammerling, Stig Linder, Rolf Larsson, Mats G Gustafsson. Label-free detection and dynamic monitoring of drug-induced intracellular vesicle formation enabled using a two-dimensional matched filter. Autophagy, 2013; 10(1):57-69. II Obaid Aftab, Madiha Nazir, Mårten Fryknäs, Ulf Hammerling,
Rolf Larsson, Mats G Gustafsson. Label free high throughput screening for apoptosis inducing chemicals using time-lapse microscopy signal processing. Apoptosis, 2014; 19(9):1411-8. III Obaid Aftab, Mårten Fryknäs, Ulf Hammerling, Rolf Larsson,
Mats G Gustafsson. Detection of cell aggregation and altered cell viability by automated label-free video microscopy: A promising alternative to endpoint viability assays in high throughput screening. Manuscript, to be resubmitted to Journal
of Biomolecular Screening, October 2014.
IV Obaid Aftab, Mårten Fryknäs, Saadia Hassan, Peter Nygren,
Rolf Larsson, Ulf Hammerling, Mats G Gustafsson. Label free quantification of time evolving morphologies using time-lapse video microscopy enables identity control of cell lines and dis-covery of chemically induced differential activity in iso-genic cell line pairs. Manuscript, to be resubmitted to Chemometrics
and Intelligent Laboratory Systems, October 2014.
V Obaid Aftab, Mikael K. R. Engskog, Jakob Haglöf, Albert
Elmsjö, Torbjörn Arvidsson, Curt Pettersson, Ulf Hammerling, Mats G Gustafsson. NMR spectroscopy based metabolic profil-ing of drug induced changes in vitro can discriminate between pharmacological classes. Manuscript, accepted for publication in Journal of Chemical information and Modeling, October 2014.
Reprints were made with permission from the respective publishers.
Author contributions: The author of the thesis has been the main responsible for all papers, working on all aspects of the research ranging from practical lab work related to cell growth and drug exposure, image data collection, and bioinformatics data analysis. The only main experimental part not formed by the author was the actual NMR spectroscopy measurements per-formed for the last paper but the candidate did all the previous experimental steps and the subsequent data analysis. A few experimental techniques (eg western blots and flow cytometry) for specific validations of screening hits (asked for by the anonymous reviewers in the article submission process) were also performed externally.
Contents
Introduction ... 11
1.1 Phenotypic screening in cancer pharmacology ... 11
1.2 Microscopy imaging for in vitro monitoring of growing cell populations ... 12
1.3 In vitro NMR spectroscopy based metabolomics ... 13
1.4 Conclusions and a brief overview of the project ... 13
2 Aims ... 15
3 Materials and methods ... 16
3.1 Cell line models ... 16
3.2 Drug libraries and screening formats ... 16
3.3. High throughput cell viability (survival index) using FMCA ... 17
3.4 Time-lapse microscopy using IncuCyte and reporter cell lines/kits ... 17
3.5 Flourescent microscopy using ArrayScan ... 18
3.6 The linear 2D matched filter ... 18
3.7 CellProfiler ... 19
3.8 Standard molecular biotechniques used: ... 20
3.8.1 Assay for quantification of Apoptosis specific Caspase activity ... 20
3.8.2 Assay for Labeling Acidic Organelles ... 20
3.8.3 Assay for quantification of LC3-II protein ... 20
3.8.4 Western blot ... 20
3.8.5 Flow cytometry ... 21
3.9 NMR-profiling and metabolite extraction ... 21
3.10 UPPMAX for storage and computational speed ... 22
3.11 Programming environments: ... 22
3.12 Detection Threshold ... 22
3.13 Image features used ... 23
3.14 Principal Component Analysis ... 23
3.15 Multidimensional scaling ... 24
3.16 Supervised learning and cross validation of random forests for classification ... 24
3.17 Hierarchical clustering ... 25
4 Results and discussion ... 27
4.1 Identification of compounds modulating autophagy pathway (Paper I) ... 27
4.1.1 Image Based Screening for Detection of Autophagy ... 28
4.1.2 The LFVD Algorithm for Autophagy Detection ... 29
4.2 Label free detection and dynamic monitoring of drug-induced apoptosis (Paper II) ... 30
4.2.1 Image Based Screening for Detection of Apoptosis ... 31
4.3 Automated detection of differentially time-evolving morphology: A promising alternative to viability assays in high-throughput drug screening (Paper III) ... 33
4.3.1 Evaluation of three algorithms for image feature extraction and comparison ... 34
4.3.2 Compounds inducing morphological changes ... 34
4.4 Identity control of cell lines and discovery of chemically induced differential activity in iso-genic cell line pairs. (Paper IV) ... 35
4.4.1 Quality control of cell lines ... 36
4.4.2 Comparing unperturbed iso-genic cell line pairs ... 38
4.5 NMR spectroscopy based metabolic profiling of drug induced changes in vitro can discriminate between pharmacological classes ... 39
5 Conclusion and future work ... 42
6 Acknowledgements ... 44
Abbreviations
LFVD label free vesicle detector
HT high-throughput PCM phase contrast microscopy
LOPAC1280 Library of Pharmacologically Active
Compounds
HCS High Content Screening
FMCA fluorometric microculture cytotoxici-ty assay
NMR nuclear magnetic resonance
MS mass spectrometry
TEM time evolving morphology
AQDTEM automated detection of differentially time evolving morphologies
PHHC pixel histogram hierarchy compari-son
MDS multi dimensional scaling PCA principal component analysis
Introduction
Automated microscopy and spectroscopy now make it possible to study, in a high throughput format, how in vitro growing cell populations are affected by different treatments and/or environmental disturbances. Since the tech-nology development at the instrument level often has been ahead of the data analytical tools and the scientific questions, in biomedical sciences there is a large and growing need for algorithms for desired computational analyses. These algorithms should extract and process quantitative dynamic informa-tion about how the cell populainforma-tion is affected by different environments and by different stimuli with the final goal to transform this information into development of new powerful therapeutic strategies. In particular, in the area of cancer pharmacology there is a great need for automated systems that can facilitate the analysis of massive biological data for label-free methods like phase contrast microscopy (PCM) imaging and NMR spectroscopy.
1.1 Phenotypic screening in cancer pharmacology
Today drug discovery and development in cancer pharmacology is often based on targeted model based approaches where the goal is to find and/or refine drug candidates targeting a particular protein or biological mechanism associated with the cancer of interest. A less commonly applied approach is to perform some form of phenotypic screening in order to detect drug candi-dates that are active in different in vitro model systems developed. Although less common, this approach to drug discovery has been surprisingly competi-tive and is still a large player when it comes to drug candidates actually reaching the clinic. In the context of cancer pharmacology, the drug activity is usually measured in terms of simple single readouts like cell viability after 72h of treatment. However, in recent years the new possibility to collect more information rich readouts in terms of microscopy images that can be used to compare and quantify morphological changes has emerged. More-over mRNA gene expression arrays and different spectroscopic techniques have opened for even more detailed and comprehensive (system wide) read-outs. Considering the already quire successful phenotypic screening ap-proach for drug discovery and development, there seems to be an out-standing potential associated with the used of automated microscopy and
spectroscopy with ability to significantly improve the quality and frequency of drug candidates discovered.
1.2 Microscopy imaging for in vitro monitoring of
growing cell populations
Analyzing microscopic images and videos to extract useful information is becoming an increasingly important activity in many biomedical laboratories [1-3]. Time-lapse microscopy imaging is broadly applied to record living cells over an extended period ranging from days to weeks. Recent advances in this field have made it possible to study different cell processes including apoptosis, cell division and cell migration [4-5]. This technique provides an insight into the dynamic nature of cellular functions that can be helpful in research areas like drug discovery, stem cell research, genomics and pro-teomics [6-9]. However, with the rapid increase in amount of data generated, our ability to interpret this information remains limited. Manual analysis of these massive data files takes weeks of tedious work, with the possibility of losing vital information stored in these images. Therefore, there is a great need for an automated and quantitative cell population monitoring system that facilitates the analysis of massive biological data, in particular for label-free methods, such as phase contrast microscopy (PCM) imaging. For this one has tried to develop new image analysis algorithms for basic tasks such as cell segmentation and cell tracking but these tasks are very challenging when using unlabelled techniques, especially in later stages of a cell growth experiment when the cells are no longer isolated entities but are forming confluent islands.
Time-lapse microscopy imaging based on various molecular labeling techniques has revolutionized the study of dynamic events taking place in-side living cells [10, 11]. However, many standard procedures are often too costly and time consuming for high throughput (HT) analyses. One reason for this is high expenses for antibodies or other molecular labeling reagents, another reason is that multiple samples are required because these proce-dures require samples to be harvested for each time point measurement. Moreover, the introduction of labeling reagents can lead to false positive or false negative events because the staining conditions are well defined for each reagent and any deviation can impose a risk for spurious experimental results. Thus, there is an apparent need for label-free alternatives that can offer cost-efficient and fast monitoring and quantification of sub-cellular events over time.
1.3 In vitro NMR spectroscopy based metabolomics
Metabolomics refers to the study of metabolites in a sample, whereas the term metabolome represents the total repertoire of small molecules, present in biological fluids, tissues and cells. There are many applications of me-tabolomics in diagnostic biomarker discovery, toxicology testing and drug discovery and development [12-13]. Thus, metabolomics has arisen as a very competitive methodological orientation, not least because metabolites are of high biological relevance [14]. Actually, a range of (provisional) metabolite signatures have been identified for several disease states, including psychiat-ric disorders, hypertension and cardiovascular diseases as well as types 1 and 2 diabetes [15, 16].
Nuclear Magnetic Resonance (NMR) spectroscopy, a quantitative and non destructive technique, is the main analytical platform in metabolomics. It is robust and reliable with outstanding repeatability and reproducibility [17]. It can provide detailed information regarding the structural transforma-tion of a compound as a consequence of metabolism [18]. NMR-based spec-troscopic profiling of metabolites in biological samples can be categorized into 1D- and 2-D analysis, the former still being predominant but the latter clearly gaining popularity.
However the use of NMR spectroscopy to study systemic effects on growing cell populations being exposed to different chemical treatments is still poorly developed. In particular the possibility to characterize and com-pare chemical compounds with respect to the systemic change they induce at the metabolite level after a certain time period from the treatment started is very promising area still is largely unexplored. Consequently the possibility to use NMR spectroscopy to monitor how the changes are developing as a function of time is another largely unexplored area which would be a natural extension or complement to the live cell morphology profiling offered by unlabelled time-lapse microscopy as discussed above. Today there are no molecular profiling techniques that offer systemic (system wide) profiling fast and cheap enough to enable an average biomedical research laboratory to perform large-scale temporal analyses of the kind offered by time-lapse microscopy.
1.4 Conclusions and a brief overview of the project
In order to meet the challenges and possibilities discussed above, this thesis is presenting and evaluating new methods for label free extraction and com-parison of time-evolving morphological features in microscopy images. In addition it provides a proof-of-concept study showing the potential of NMR based systemic profiling when it comes to classification of unknown chemi-cal substances into different mechanistic classes. More specifichemi-cally, in Paper
I the first label-free method reported to successfully detect and quantify vesicle formation by using an image processing algorithm applied to PCM images is presented. The results demonstrate that this computational ap-proach can be successfully used for detection and monitoring of drug in-duced vesicle formation in human cells. In Paper II a computationally fast method for automatic detection of apoptotic cells in label free phase contrast images is designed and evaluated. Based on characteristic features of apop-totic cells a two-dimensional linear matched filter was designed to detect objects from phase-contrast images. Compared with other methods the cur-rent approach of linear filters has several advantages. In papers III and IV, morphological features extracted were employed for a broad range of appli-cations such as replacing conventional cell viability profiling, detection of cell aggregation, identity control of cell lines and discovery of chemically induced differential activity in closely related (iso-genic) cell line pairs. Fi-nally, in paper V the potential of replacing relatively expensive, slow and laborious mRNA array profiling by NMR spectroscopy based metabolite profiling for discrimination between chemical compounds belonging to dif-ferent mechanistic groups was demonstrated. In general the methods and results presented should be regarded as proof-of-concept studies rather than representing the final ultimate solutions to the problems addressed.
2 Aims
The overarching goal of the project reported in this thesis was to develop implement and validate high-throughput drug screening methods based on image processing algorithms and algorithms for processing of NMR spectra that are able to extract information rich features of growing cell populations that can be used to quantify drug effects. The specific aims of the studies were:
• Develop two-dimensional linear matched filters for computationally fast and label free detection of characteristic round objects in phase-contrast time-lapse microscopy images related to intracellular vesi-cles and apoptosis (programmed cell death).
• Confirming the potential of using classical two-dimensional linear filters to achieve successful high-throughput screening (HTS) for drugs inducing autophagy and apoptosis, respectively.
• Develop and compare computational tools for label free extraction and comparison of time-evolving morphological features in phase-contrast time-lapse microscopy images recorded from growing cell populations.
• Confirming the potential of the computational tools developed for dynamic morphology analyses for various tasks such as
High-throughput screening for morphology modulating drugs (as an alternative to viability assays)
cell line (and drug) quality control
• Exploring the potential of a relatively fast and cheap morphology and spectroscopy based "Connectivity Map" (a methodological ap-proach from Broad Institute) suitable for compound mechanism pre-diction and drug repurposing.
3 Materials and methods
3.1 Cell line models
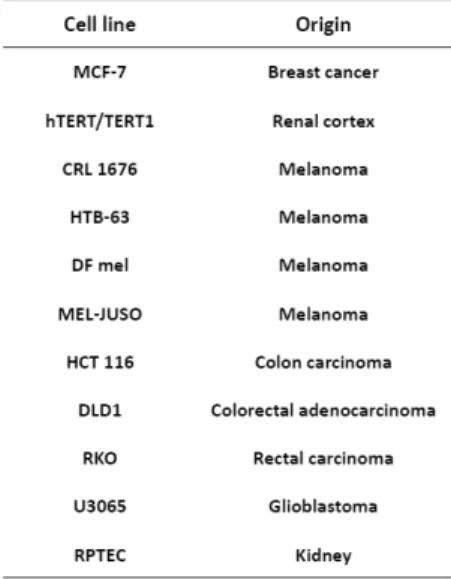
Three pairs of iso-genic cell lines together with authentication were obtained from Horizon Discovery Ltd, United Kingdom. The pairs employed are hu-man colon carcinoma cell line HCT116 and its variant HCT116KRASwt/- with KRAS allele knocked out, human colorectal adenocarcinoma cell line DLD-1 and its variant DLD-1KRASwt/- with KRAS allele knocked out and human rectal carcinoma cell line RKO and its variant RKOBRAFwt/- with BRAF V600E allele knocked out. The cell lines used in the quality control study (Paper IV) were obtained from American Type Culture collection, ATCC, Rockville, MD, USA are listed in table 1.
Table 1. Cell lines used in the study of quality control.
3.2 Drug libraries and screening formats
Compounds available in two libraries were used in the different projects, in some case only a subset of them. The Pharmakon 1600 library encompasses 1600 compounds that all have been tried in humans was obtained from
Mi-crosource Discovery Systems (Gaylordsville, CT, USA) and the LOPAC1280 library from Sigma-Aldrich (Stockholm, Sweden) contains 1266 annotated compounds distributed over 56 pharmacological classes. The compounds were dissolved in dimethyl sulphoxide (DMSO) and were further diluted with phosphate buffered saline, transferred to 384-well microtiter plates us-ing our Biomek 2000 pipettus-ing station (Beckman Coulter Inc, Fullerton, CA, USA) and screened at a final concentration of 10 µM. The plates were stored at 70°C until further use. All cell culture reagents were purchased from Sigma Aldrich, unless stated otherwise.
3.3. High throughput cell viability (survival index)
using FMCA
Cell survival was measured using fluorometric microculture cytotoxicity assay (FMCA) [19, 20]. The FMCA measures the cell survival by measuring the fluorescence generated from the hydrolysis of fluorescein diacetate to fluorescein by cells that have plasma membranes intact. The number of liv-ing cells is proportional to emitted fluorescence. Cell survival of each ex-perimental well is calculated as the survival index, it is fluorescence meas-ured in experimental wells as a percentage of fluorescence measmeas-ured in con-trol wells while fluorescence values of blank wells were already subtracted. More formally the survival index S is calculated as
blank control blank sample
f
f
f
f
S
−
−
=
where fsample denotes the fluorescence signal from the well of the sample, fblank
denotes the fluorescence signal from the well of the blanks (average) and
fcontrol denotes the fluorescence signal from the control wells (average).
3.4 Time-lapse microscopy using IncuCyte and reporter
cell lines/kits
Time lapse microscopy images were obtained from a live cell imaging sys-tem IncuCyte (Essen BioScience Inc., Ann Arbor, MI, USA) that provides non-invasive live-cell image for both phase and fluorescence. It’s an incuba-tor equipped with a fully automated microscope. The microscope has a 4X, 10X and a 20X objective with the ability of imaging high definition and high quality phase contrast images (1024 * 1280 pixels) that provide morphologi-cal information not found with fluorescent-only imaging. HD imaging is
insensitive to focus and illumination aberrations caused by fluid meniscus. It is useful for a range of both labelled and non-labelled application. The sys-tem is designed to provide non-perturbing kinetic growth curves using a built-in confluence algorithm and follow live-cell fluorescent reporters in time. The IncuCyte can accommodate up to 6 plates concurrently. For a 384 well plate only one field per well can be imaged and this field of view is fixed for the remaining time points to keep track of the cells. Ignoring con-trol (column 12, 13 and 24) and blanks (column 1), one can run 320 com-pounds per plate and thus 1920 comcom-pounds in parallel. Imaging one such batch every second hour results in approximately 23000 compounds every 24h and thus approximately 1 million compounds every 6th week. Making a
time-lapse movie of 36 consecutive time points per batch, instead of taking only one single image per drug, reduces the throughput 36-fold to approxi-mately 27000 compounds every 6th week. However the number of
com-pounds being screened can be increased by using an automation ready incu-bator where plates can be added or removed from the IncuCyte using a ro-botic arm.
3.5 Flourescent microscopy using ArrayScan
Fluorescence microscopy is used to study properties of organic or inorganic substances using the phenomena of fluorescence and phosphorescence [21]. The basic function of a fluorescence microscopy is to illuminate the speci-men that is labelled with a fluorescence dye with a specific band of wave-lengths, and then to separate the much weaker emitted fluorescence from the excitation light. As a result part of specimen marked with fluorescent dye will light up against the dark background [22].
Fluorescently labelled cells were read in Arrayscan® High Content Screening reader (Cellomics). It is an automated fluorescent microscopic imaging system designed for high content screening and analysis of either fixed or live cells. Images were acquired using a 20x objective in the Hoechst 3342 and the fluorescence channels. The spot detector algorithm was used to identify the nuclei, apply a cytoplasmic mask and quantify the fluorescence spots in the fluorescence channel.
3.6 The linear 2D matched filter
3.6 The linear 2D matched filter
Paper I and II are based on a two-dimensional linear matched filter corre-sponding to a sliding image region of size M x M pixels and thus M2 filter coefficients. Expressed in terms of an one local image patch, here denoted by the M2 x 1 dimensional column vector x, the matched filter is calculating
the optimal test statistic for discrimination between the hypothesis H1: x=s+n of interest from the alternative null hypothesis H0: x=n. Here s
de-notes the signal prototype to be detected and n dede-notes additive normally distributed background noise. Thus, for pixel i the standard matched filter calculates the scalar product y(i)=wTx(i) where w is a M2x1 dimensional
filter coefficient vector and x(i) is the M2x1 dimensional vector representing
the M2xM2 square of pixels centred around pixel i. The size of the square
depends on the size of the object to be detected and ranges in our current applications between 25 pixels (M=5, 5x5 pixels) and 900 pixels (M=30, 30x30 pixels). The matched filters used in this work are either based on as-suming that covariance matrix corresponding to the noise vector n is propor-tional to the unity matrix or based on empirical estimation of the covariance matrix using a set of subimages. When trying to detect isolated objects there is no reason to assume anything but independent and identically distributed noise for all pixels which corresponds to a covariance matrix being propor-tional to the identity matrix. However, when trying to make detections of objects embedded in a growing cell culture, there should be a statistical structure associated with the particular morphology present which could be quantified and employed. In this case estimation of the covariance matrix is performed based on a set of representative subimages collected. This makes it possible to take the surrounding statistical structure into account when trying to make the detection of the object (signal s) of interest.
3.7 CellProfiler
CellProfiler (http://www.cellprofiler.org/) is automated open-source image analysis software that can analyze thousands of images obtained through image acquisition instruments. The software contains already developed methods that are applicable to diverse assays [23]. It produces rapid, quanti-tative, and accurate results. Since the software is open-source it allows re-searchers to design and contribute new methods and improve the existing ones. CellProfiler contains published and tested algorithms for object identi-fication [24-28]. For each identified cell it can measure a large number of features including size, shape, intensity, texture and location. These meas-urements can be viewed either by CellProfiler’s built in viewing and plotting data tools or they can be exported directly to excel or database (MySql or Oracle) to be analyzed through CellProfiler Analyst.
3.8 Standard molecular biotechniques used:
3.8.1 Assay for quantification of Apoptosis specific Caspase
activity
Caspase-3/7 reagent was used at a final concentration of 5 µm according to manufacturer instructions (Essen BioScience, CellPlayer™ 96-Well Kinetic Caspase-3/7 Reagent, 4440). Caspase-3 substrate consists of a highly nega-tively charged DEVD peptide that is attached to a DNA-binding dye to make the dye unable to bind to DNA and thus unable to produce fluorescence in the presence of DNA. The substrate rapidly crosses cell membrane to enter the cell cytoplasm, where it is cleaved by caspase-3 to release the high-affinity DNA dye. The released DNA dye migrates to the cell nucleus to stain the nucleus brightly green.
3.8.2 Assay for Labeling Acidic Organelles
Top hits from the LFVD screen were labelled using LysoTracker® Red DND-99 dye (Invitrogen, L-7528) according to manufacturer instructions. Hoechst 33342 was added to label the nuclei of the cells. Plates were read in ArrayScan® HCS reader (Cellomics). Images were acquired using a 20x objective in the Hoechst 3342 and the fluorescence channels.
3.8.3 Assay for quantification of LC3-II protein
Top hits from the LFVD screen were added at different concentrations and incubated for 48 h at 37 °C. Subsequent to removal of culture medium cells were fixed and stained according to manufacturer instructions (Cellomics® LC3B and Poly-Ubiquitin Detection Kits, 8407801). Plates were read in ArrayScan® High Content Screening reader (Cellomics). Images were ac-quired using a 20x objective in the Hoechst 3342 and the fluorescence chan-nels. The spot detector algorithm was used to identify the nuclei, apply a cytoplasmic mask and quantify the fluorescence spots in the fluorescence channel.
3.8.4 Western blot
In Paper I Western blot was used to detect endogenous LC3 levels. HCT116 cells were washed in PBS on ice and collected by scraping. Cells were lysed in RIPA buffer (150 mM NaCl, 50 mM Tris pH 7.4, 1% Nonidet P-40, 0.1% SDS and 0.5% sodium deoxycholate) containing protease and phosphatase inhibitors. The protein concentration was determined by Biorad Protein As-say (Biorad Laboratories, Hercules, CA) and equal amount of proteins was
loaded on pre-casted acrylamide gels (4-12% SDS-PAGE). Membranes were blocked in 5% dry milk in TBS with 0.1% Tween (TBS-T) for 1 hour at room temperature and incubated with anti-LC3 MAb (Cell signaling Tech-nology, 2775) diluted 1:1000 in 5% BSA in TBS-T overnight at 4°C. The next day membranes were washed and incubated for 1 hour at room tem-perature with the appropriate HRP-conjugated secondary antibody and the binding was detected by the ECL system. Densitometric analysis of the LC3-II signal was normalized to actin by using Adobe Photoshop.
3.8.5 Flow cytometry
In Paper I GFP-LC3-HOS cells are used to quantify autophagic flux since saponin extraction of cytosolic EGFP-LC3-I allows quantification of autophagosomes-associated EGFP-LC3-II by flow cytometry [29]. These cells are stably transfected with EGFP-LC3-expressing vector. One-hundred thousand cells/dish were plated into 20 cm2 dishes and the next day cells
were treated with the indicated compounds for 24 hours. CQ (50 M) was added during the last 4 hours incubation to block autophagic flux. Cells were trypsinized, washed in PBS and treated with 0.05% saponin in PBS for 10 minutes at RT. After wash in excess PBS the cells were collected and ana-lysed by a FACSCalibur instrument (Becton Dickinson, Mountain View, CA) using Cellquest software (Becton Dickinson). GFP fluorescence was collected on at least 10,000 cells/sample.
3.9 NMR-profiling and metabolite extraction
In paper V, the human colon carcinoma cell-line HTC 116 (Horizon Discov-ery Ltd) was used. Briefly, the cells were cultured in an incubator at 37°C under 5% CO₂, grown in 21.5 cm2 culture dishes from Thermo Fisher
Scien-tific (Denmark) and supplemented with McCoy’s 5A medium supplemented with 10% heat inactivated fetal calf serum, 2 Mm glutamine, 100 µg/ml streptomycin and 100 U/ml penicillin until reaching a final cell count of five million cells. The cell culture medium was removed and cells were quickly washed three times with ice cold phosphate buffered saline (PBS, pH 7.4) to remove extracellular metabolites. Cells were then quenched using 2 ml methanol The cells were detached from the culture dish using a rubber tipped cell scraper from Cell Scraper TPP®, Midsci (Switzerland), trans-ferred to an extraction tube and frozen at -80 °C until extraction.
3.10 UPPMAX for storage and computational speed
Data storage and computations were performed on resources provided through Uppsala Multidisciplinary Centre for Advanced Computational Sci-ence (www.uppmax.uu.se). The analysis was performed on a computing cluster, multiple cores were used in parallel to do the computation. In Paper I a single-filter setting needed approximately 0.47 seconds to process each image (3 minutes per 384 wells) using Quad-core Intel® Xeon 5520 (Neha-lem 2.26 GHz, 8MB cache) processor and 3GB RAM.
3.11 Programming environments
Algorithms for image processing and NMR data analysis were written in Matlab and R. In addition to the designed algorithms Matlab Image process-ing Toolbox™ and Statistics Toolbox ™ were also used.
3.12 Detection Threshold
In this work a time-lapse movie is converted into a feature matrix F where each column corresponds to one time point and each row corresponds to one morphological feature extracted from the images. Denoting the matrix ob-tained using treatment as Ftreated and the corresponding average matrix
ob-tained for the control wells as Favgctrl, then the resulting difference Ftreated - Favgctrl is called the differentially time evolving morphologies (DTEMs) ma-trix. In papers I-IV a detection threshold level corresponding to 5 % false alarms was determined to select top hits using a general principal as illus-trated below for one special case. An agent was assigned to be a hit if its DTEM matrix F = Ftreated - Favgctrl had a matrix Frobenius norm ||F|| (which
is equal to the Euclidean distance between Ftreated and Favctrl when the
matri-ces are viewed as vectors) larger than a pre-defined 5% false alarm thresh-old. This 5% detection threshold was determined by only running all the wells corresponding to untreated controls and then selecting the detection level that resulted in 5% detections (false positives or false alarms). This 5% detection threshold was determined in two steps. In the first step, a leave one out procedure was used to determine the DTEM matrices Fi = F(i)= F leftout-control(i) -Favgcremain(i) where Fleftoutcontrol(i) is the feature matrix of control well
i and Favgctrremain(i) is the corresponding average feature matrix based on the
remaining controls on the same plate. This leave-one-out process was re-peated for all controls. In the second step the magnitudes (Frobenious norm) for all of them were pooled together to create a statistical distribution of “null magnitudes” and a detection threshold corresponding to (approxi-mately) 5% false alarm was determined based on this distribution.
3.13 Image features used
In this thesis only two different sets of image features have been used which have been extracted to quantify statistical properties in the images. In addi-tion to only extracting the confluence (the area of the image covered by growing cells), the two feature sets used were histograms collected at differ-ent resolutions, (papers III and IV) and a simple Fourier transform based feature vector where each feature is intended to reflect the energy in a par-ticular spatial frequency band (independently of orientation). The histogram hierarchy was used to evaluate the potential of using histograms which are reflecting different levels of resolution/scale in the image. More advanced alternatives that may offer various types of rotation/scaling/translation in-variances such as the classical invariant moments known under names like Hu and Zernike [30, 31] were not considered. Similarly, more advanced Fourier transform based methods recently proposed [32-35] were beyond the scope of this work. Such methods should be considered in future studies but for the proof-of-principle studies performed here to demonstrate the potential of this type of image processing, the simple ones employed were sufficient.
3.14 Principal Component Analysis
Standard principal component analysis (PCA) was used for data compression [36]. Given a set of d-dimensional vectors with sample mean vector m, this is achieved by calculating the d x d dimensional sample covariance matrix C and then determining its eigenvalues
λ
k and corresponding egenvectors pkthus satisfying the equation Cpk =
λ
k pk, k=1,2,…,d. Using a subset consistingof K<<d of these eigenvectors corresponding to the largest eigenvalues as basis vectors in a new coordinate system, any d-dimensional vector x can be approximated as x = m+Pt where m is the sample mean vector, P is a K x d dimensional matrix with the K eigenvectors as columns, and t is a K-dimensional vector containing the coordinates of x in the new coordinate system defined by the columns in P. Since the eigenvectors are orthogonal (ensured because C is symmetric) the coordinate vector t may easily be de-termined as t=PT(x-m). PCA may be interpreted as the solution to the
prob-lem of compressing a set of d-dimensional vector into a space of lower di-mensionality in such a way that if the compressed vectors are used for recon-struction of the original ones, the reconrecon-struction error is minimized (in a least squares sense).
3.15 Multidimensional scaling
Multidimensional scaling (MDS) was used for visualization of multidimen-sional data [36]. Similar to PCA, MDS may be interpreted as a method de-signed to represent high-dimensional observations (vectors) in a space of lower dimensionality. However in this case the goal is not to have a low-dimensional representation that is optimal for reconstruction of the original vectors like for PCA. Instead the goal is to find a representation such that the mutual distances between all the compressed vectors are preserved as well as possible this preserving as much information as possible about relative dif-ferences.
3.16 Supervised learning and cross validation of
Random Forests for classification
In paper IV cell line classification is performed using conventional super-vised learning of a Random Forest classifiers [37]. In supersuper-vised machine learning for classification the goal is to find a prediction function f(x) which for a new d-dimensional example x predicts predicts which class it belongs to among at least two alternatives. The function y=f(x) is derived (learned) by means of a set of N training examples, each consisting of a pair (xn, yn)
where xn is a d-dimensional vector and yn denotes the class membership of
this vector. There is an enormous body of different families of candidate prediction models and associated learning algorithms suggested that are able to sift out the most promising candidate in a particular model family [36]. One classical example is the family of k-nearest neighbour classifiers which simply assign a new example to the same class as the one in majority among the k-nearest neighbours among the set of training examples { xn }. Here the
algorithm has to determine the best value for k as well as the best distance measure to use. In this thesis the framework used is the Random Forest clas-sifier in which each predictor consists of a set (forest) of individual decision trees. A decision tree classifier looks at one feature at a time iteratively until it comes to a final decision about the class membership. Such individual decision trees are designed/trained using the training examples (xn, yn)
avail-able using different algorithms. In the Random Forest classifier a particular design/training algorithm is used to build many different focused on differ-ent subsets and differdiffer-ent feature subsets of the training data. Then all the decision trees are allowed to make a vote when a new unlabelled example should be classified.
In order to estimate the average prediction (classification) performance of a supervised learning framework for a particular problem one often uses K-fold cross-validation. Using this method, the examples are first split into K blocks and then K different classifiers are built, each using a unique set of
K-1 of the blocks. Then each classifier is tested using the examples remaining in the block not used for training of that particular classifier. Thus this re-sults in K different estimates of the performance when training using the number of examples present in K-1 blocks. Often these K different estimates (which may be quite different due to the relatively few examples available for training and testing) are summarized by the corresponding (arithmetic) mean value but they may also be presented in the form of a histogram. To get a more robust picture, often the K-fold cross validation is repeated sev-eral times, each time using a different randomly selected partitioning into K non-overlapping subsets. Often the subset selection is also stratified in such a way that each subsets has the same proportion of examples from the differ-ent classes as in the complete data set.
3.17 Hierarchical clustering
In this thesis a top-down hierarchical clustering algorithm has been used denoted OMB-DHC (Omnibus Multi-Branching Divisive Hierarchical Clus-tering) [38-40]. By contrast to most hierarchical clustering algorithms this is a top-down rather than bottom-up algorithm. It starts with all data in one cluster which then is analysed using conventional K-Means clustering com-bined with a statistical analysis that goes through a wide range of plausible values for K to suggest the number of clusters the data sets seems to consist of. After splitting the original set of examples into the number of clusters suggested, the algorithm is applied to each of the individual clusters to make another multi-branching step. One of the main advantages of this type of clustering is the resulting hierarchical tree (dendrogram) showing how the different examples analysed are related. Compared to the trees generated by conventional bottom-up algorithms and top-down algorithms only allowing a binary split in each node, the trees produced by OMB-DHC are much easier to understand and visualize because they typically consist of relatively few hierarchical levels due to the multi-branching. Moreover, as with other top-down algorithms, another advantage is that the algorithm is less sensitive to minor local changes among the examples than the bottom-up approaches which are based on clustering the local examples first and then merging them into larger clusters.
3.18 CV and Z-factor
In some of the papers of this thesis two different measures of experimental reproducibility are used. The first is the natural and intuitive coefficient of variation (CV) that for a given sample mean m and standard deviation s is defined as the ratio s/m. The second is the Z-factor mostly used in the
con-text of HTS where it was first introduced [41]. The Z-factor is defined as follows for two groups classes having sample means m1 and m2 as well as
standard deviations s1 and s1, respectively:
Z=1-3 |s1+s2| |m1-m2| .
In the context of HTS, one group is often the control whereas the other represents the samples tested. The value of Z is often used to evaluate the quality of HTS assays. If Z is above 0.5, the assay is considered to be excel-lent. The relevance of this quantity becomes clearer by turning the key ratio in the second term upside-down yielding
| − | | + |
.
This ratio is apparently measuring how well separated the mean values of the two distributions are compared with sum of the corresponding standard de-viations. Thus an assay providing a large difference between the mean val-ues may not be very useful if the corresponding standard deviations are too large, making the ratio above relatively small. However, if the mean differ-ence is very large compared to the standard deviations then the ratio be-comes small and the Z factor value bebe-comes close to one. Curiously this ratio is quite similar to the classical Fisher criterion
| − | ( ) + ( )
introduced to the field of statistical pattern recognition in the 1930s and used to derived the famous Fisher’s linear discriminant classifier designed to op-timize this ratio [36]. In other words one may state that the classical Fisher’s linear discriminant is designed to maximize a criterion that is very similar to the Z-factor for the class detection problem of interest. This very close rela-tionship supports the relevance of the Z-factor while at the same time shows that it does not provide anything conceptually new compared to the old Fisher criterion.
4 Results and discussion
4.1 Identification of compounds modulating autophagy
pathway (Paper I)
In Paper I we developed a method, the label-free vesicle detector (LFVD), for identification of circular vesicles (bubbles, vacuoles) within cells in plain PCM images. We hypothesized that compounds leading to formation of these vesicles play a role in modulating autophagy pathway. To demonstrate the usefulness of the LFVD for this purpose we screened LOPAC1280 with
LFVD and obtained a hit list of compounds forming vesicles within cells. The top hits obtained were validated with respect to their activity as auto-phagy modulators using independent in vitro labeling of acidic organelles, detection of LC3-II protein and analysis of the autophagic flux.
Today there is an apparent lack of label free methods in autophagy re-search and in vitro pharmacology for detection and monitoring of these dy-namic processes. Except for images of electron microscopy, there is no gold standard to unequivocally verify cellular presence of autophagosomes, but multiple assays are recommended to show autophagic response [42]. Aci-dophilic and certain fluorescent dyes are reagents typically used for this pur-pose. Using these methods, several among the top hits found using the LFVD assay were validated with respect to their potential modulation of the autophagic process. In the current literature, there are several recent reports from independent researchers showing that the top hits analyzed by us are indeed modulating the autophagic process [43-47]. Moreover, we provided biochemical evidence that many of the top hits identified induced accumula-tion of autophagosomes and/or increased the autophagic flux. In conclusion, despite the method we describe is not specific for detection of autophagic vesicles our data support the use of this assay for preliminary screening of autophagy-modulating agents.
Compared with other methods for detection of vesicles, for example auto-phagosomes, the current approach is automated and does not require any assay reagent. Moreover, it needs little manual input only, thereby rendering it cost and time effective. Furthermore, kinetic measurement over time is enabled, providing another dimension to the measurements. However, the label free approach introduced also has some obvious limitations: (1) The modest resolution of the images limits the detection of small vesicles, i.e. those that occupy a few pixels only. (2) The proposed two-dimensional
matched filter (the LFVD) is known to be optimal for detection of a single signal prototype embedded in an additive Gaussian background. Assuming that the statistical structure of the image background cannot be described well by a Gaussian distribution, the matched filters used here are not likely to yield optimal performance. Nonetheless, the filters are indeed taking sec-ond order statistics (variances and co-variances) of the image background into account.
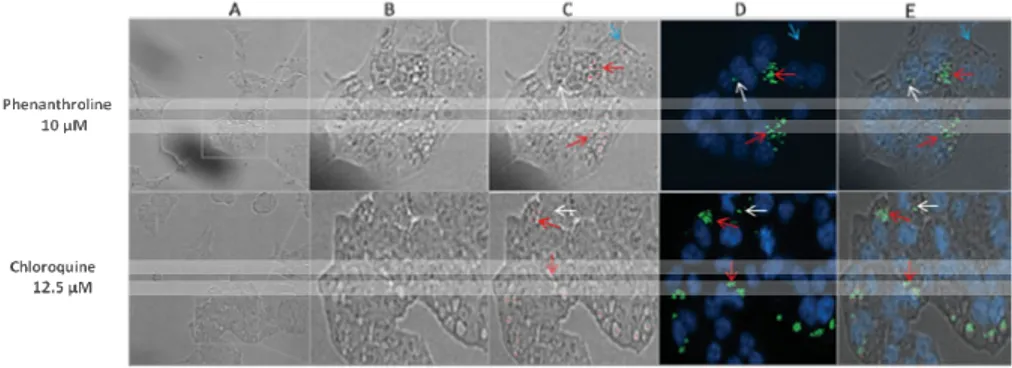
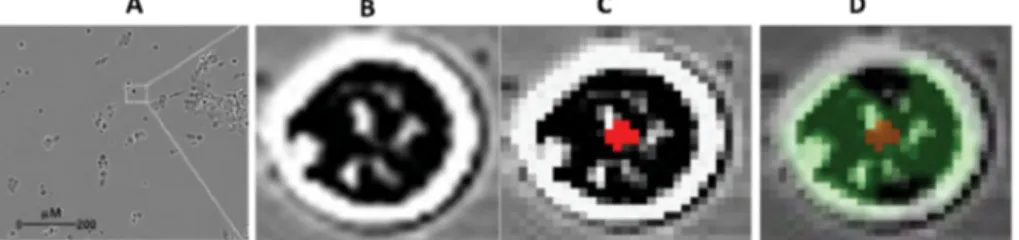
In order to show the accuracy of detection and the nature of identified vesicles LFVD was applied to bright-field images obtained from array scan during LC3-II visualization at 48 hrs drug exposure (Fig. 1). Notably, the LFVD is designed for analyzing phase contrast images, which are of high resolution obtained from IncuCyte HD. The images obtained from the Ar-rayScan reader are bright-field and thus of lower quality. Results showed that 12 out of 15 regions identified as vesicles (80 %) in cells treated with phenanthroline were positive for LC3-II staining (Fig. 1).
Figure 1. HCT116 cells exposed to 1,10-Phenanthroline monohydrate (10 µM) and chloroquine (12.5 µM) for 48 hours were labelled with Cellomics® LC3B Detection Kits and images were acquired using the ArrayScan® HCS reader. (A) Bright field image obtained from ArrayScan® HCS reader. (B) An enlarged image to show vesicle formation. (C) Image scanned through LFVD where red spots indicate detec-tions been made. (D) Composite channel where blue color represents nucleus and green color represent LC3-II. (E) A Merged LC3/LFVD image showing colocaliza-tion between the vesicles detected and the LC3B signal. Red arrow indicates true positive detection, white arrow indicates false negative detection and blue arrow indicates false positive detection.
4.1.1 Image Based Screening for Detection of Autophagy
HCT116 wild type cells were seeded at a density of 2500 cells per well using our pipetting robot Precision 2000 (BioTekInstruments Inc.,Winooski, VT) in 4 drug-prepared 384-well microtiter plates. The plates were incubated in our IncuCyte HD (Essen BioScience Inc., Ann Arbor, MI, USA) which is incubator equipped with a fully automated phase contrast microscope and
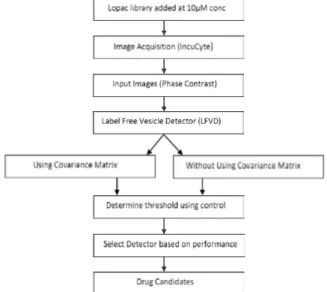
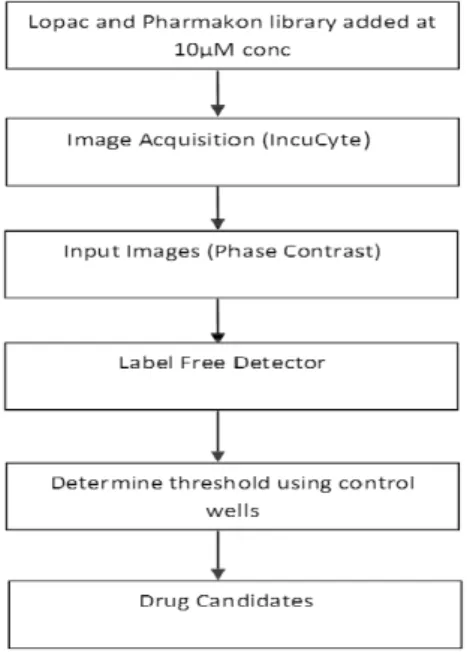
Images were taken every 2 h. A flow chart of the procedure is displayed in Figure 2.
Figure 2. Flow chart of the automated microscopy-based screen. Drugs were added to HCT116 cells at a final concentration of 10 µM and incubated for 72 hours. Phase contrast images were taken every 2 hours and moved to a database. The LFVD was then applied first on test images first using covariance matrix and then without the covariance matrix. Detection thresholds corresponding to 5% false alarms were determined for the two detectors by applying them to control wells. Finally, the two detectors were compared according to the number of true positive detections made in the remaining wells.
4.1.2 The LFVD Algorithm for Autophagy Detection
The LFVD is based on a two-dimensional linear matched filter correspond-ing to a slidcorrespond-ing image region of size M x M pixels and thus M2 filter
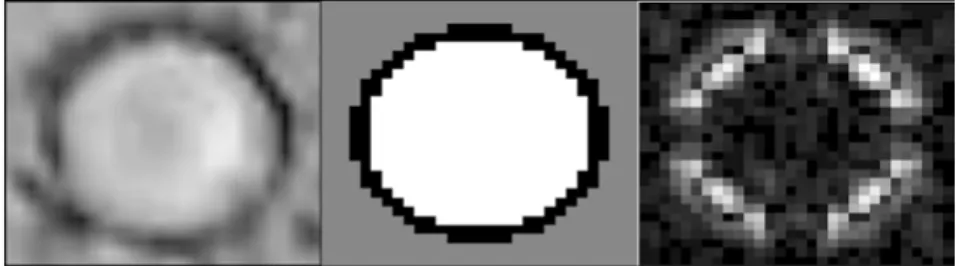
coeffi-cients (For details see Paper 1). For the particular results presented in Paper 1 in which the vesicles to be detected were relatively small, the value M=5 was used everywhere. This size was determined simply by looking at a few examples of vesicles formed in treated cells, see Figure 3.
Figure 3. (A) Image displaying vesicle formation in HCT116 cell line treated with 1,10-phenanthroline monohydrate. (B) Illustration of one vesicle prototype in the form of a MxM dimensional matrix for M=30. Thus the prototype consists of a cir-cular centre consisting of high intensity pixel values (white) surrounded by a rela-tively thin ring of low intensity pixels (black) which in turn are surrounded by an area of mid intensity pixel values (gray). (C) Illustration of the matched filter corre-sponding to the vesicle prototype shown in figure B when employing a robust esti-mate of the covariance matrix inverse.
4.2 Label free detection and dynamic monitoring of
drug-induced apoptosis (Paper II)
In Paper II we developed a method for identification of apoptotic cells using plain PCM images. Apoptosis is an evolutionarily-conserved process regu-lating the balance of cell death and cell growth [48]. This ability to regulate the life and death of a cell is recognized for its immense therapeutic potential and has drawn immense attention in the field of clinical medicine and oncol-ogy, focusing on cures for cancer [49-51]. Thus, by quantifying effects of drug treatment we can better understand the biological mechanisms of can-cer and cancan-cer therapy, thereby accelerating drug discovery and develop-ment. Apoptosis currently is detected using various molecular labeling tech-niques. However, many of these standard procedures are often too costly and time consuming for high throughput (HT) analyses. Therefore, access to methods offering label free detection would be useful for drug discovery.
Here we demonstrate the feasibility of a label-free method to successfully detect and quantify apoptotic cells by using an image processing algorithm applied to PCM images. Very few examples approaches along this direction have been reported previously. A very limited but similar study has been performed in-house using the open source image analysis software CellPro-filer [52]. However, this software is not designed for phase contrast images and should not be able to compete in terms of computational speed (com-plexity) compared with the simple linear filtering approach evaluated here. Based on characteristic features of apoptotic cells a two-dimensional linear matched filter was designed to detect objects from phase-contrast images. In a first experiment, the human colorectal carcinoma cell line HCT116 ex-posed to Mitomycin, an apoptosis inducing drug, was labelled with
caspase-3/7 reagent to monitor caspase activity as a function of time. Phase contrast images were recorded in parallel and then used for detection of apoptotic cells using our designed filter. The detections made showed a pattern similar to the fluorescence readout from caspase activity over time. The proposed method was then tested on a large time-lapse microscopy dataset for identifi-cation of compounds leading to apoptosis. Two compound libraries, LO-PAC1280 and Pharmakon 1600 (consisting of 1266 and 1600
pharmacologi-cally active compounds, respectively) were screened against three cancer cell lines HCT116, DLD1 and RKO. Two outstanding practical advantages of our linear filter approach are the low computational complexity and that there is no need for manual selection of many training examples needed for machine learning based tuning as in the recently proposed method by Hugh et al.
In order to show the accuracy of detection made a co-localization between caspase-3/7 signal and detection made through our detector is displayed in Figure 4.
Figure 4. Detection of apoptotic cells from phase contrast images obtained from HCT116 cells exposed to Mitomycin (10 µM) at time point 20 h. (A) Phase contrast image obtained from IncuCyte FLR. (B) An enlarged image to show morphology of an apoptotic cell. (C) Image scanned through Apoptotic detector representing iden-tification of candidate apoptotic object as indicated by red mark in the center. (D) Co-localization between caspase-3/7 signal and cells undergoing apoptosis identi-fied by detector.
4.2.1 Image Based Screening for Detection of Apoptosis
The human colorectal carcinoma cell line HCT116 was used to screen the Pharmakon 1600 and LOPAC1280 chemical library. All drugs were tested at a
concentration of 10 µM in complete cell culture medium and imaged each 2nd hour over three consecutive days, using IncuCyte HD (see M & M
sec-tion). Images from each of the drug treated wells were transferred to a data-base and a detector was then applied to screen for drugs capable of inducing apoptosis. For the current analysis a filter of size 30 x 30 pixels (M=30) was adopted to match cell size, see Figure 5. For details on algorithm see Paper II. A flow chart of the procedure is displayed in Figure 6.
Figure 5. (A) Image displaying HCT116 cells treated with Mitomycin. (B) An enlarged image to show the apoptotic cell. (C) Illustration of one vesicle prototype in the form of a MxM dimensional matrix for M=30. Thus the prototype consists of a circular centre consisting of low intensity pixel values (black) surrounded by a rela-tively thin ring of high intensity pixels (white) which in turn are surrounded by an area of mid intensity pixel values (gray).
Figure 6. Flow chart of the automated microscopy-based screen. Drugs were added to HCT116 cells at a final concentration of 10 µM and incubated for 72 hours. Phase contrast images were taken every 2 hours and moved to a database. Detection thresholds corresponding to 5% false alarms were determined by applying them to control wells.
4.3 Automated detection of differentially time-evolving
morphology: A promising alternative to viability assays
in high-throughput drug screening (Paper III)
In this study we present and evaluate a label-free method, automated quanti-fication of differentially time evolving morphologies (AQDTEM), to iden-tify chemically induced changes in cellular micro-cultures. In pharmacologi-cal or toxicologipharmacologi-cal HTS of chemipharmacologi-cal libraries, video or time-lapse micros-copy for quantification of cellular events of interest has several potential advantages over cell viability end point assays, like MTT (NADPH depend-ant colorimetric assays), FMCA and assays measuring ATP levels. Although proven helpful in many instances, these settings are designed to quantify viability at a single predefined time point only and can detect morphological changes only implicitly (when the morphological changes are associated with changes in viability). Thus, there is an apparent risk that a standard cell viability assay setting will miss many chemical compounds with potentially interesting cellular actions because the pre-selected time point is not very informative and/or because there are substantial morphological changes that do not parallel changes in viability. Recent advances in HTS and computa-tional image analysis have opened new avenues to screening of chemical compounds in the fields of pharmacology and toxicology. To quantify sev-eral characteristics of a compound’s composite effect, multi-parameter as-says are now available for phenotypic profiling with the potential to deter-mine cellular activity and to predict mechanism of action of unknown chemical perturbations [54-56]. However, these assays are based on molecu-lar labelling techniques that can perturb biological cues of tested compounds, thereby compromising screening data, which may entail false conclusions [53-57]. Moreover, these assays are often prohibitively costly and time con-suming for HT experiments. Thus, there is an apparent need for label-free alternatives that can offer cost-efficient and fast monitoring and quantifica-tion of sub-cellular events over time.
AQDTEM is designed to monitor chemically induced changes in time evolving morphologies, relative to untreated controls, based on sequences of phase contrast microscopy images which are processed rapidly using a com-putationally efficient feature extraction and comparison algorithm. As demonstrated below HTS results obtained by means of AQDTEM can help with suggesting the mechanism(s) of action (and thereby also predict thera-peutic response) of an unknown drug based on its phenotypic profile.
4.3.1 Evaluation of three algorithms for image feature extraction
and comparison
Three different feature extraction and comparison algorithms were evaluated when applying AQDTEM to a large video microscopy dataset obtained by exposing human colorectal carcinoma cell line HCT116 to 1697 bio-active compounds. Comparing the three morphology feature extraction and com-parison algorithms revealed that pixel histogram hierarchy comcom-parison (PHHC) was the most promising algorithm for AQDTEM. It resulted in 137 compounds above the 5% false alarm threshold. These hits were compared with those of the standard FMCA cell viability analysis providing survival indices in the interval [0,100]. The 5 % false alarm threshold level for FMCA was determined to be 81 and resulted in 143 hits. Comparing the FMCA and AQDTEM hit lists revealed that AQDTEM picked 124 out of 143 FMCA hits, translating into a sensitivity and positive predictive value of 87 % and 91 %, respectively (Table 2).
Table 2. Performance comparison of the three feature extraction methods. Symbol (+) indicates presence and (-) indicates absence.
4.3.2 Compounds inducing morphological changes
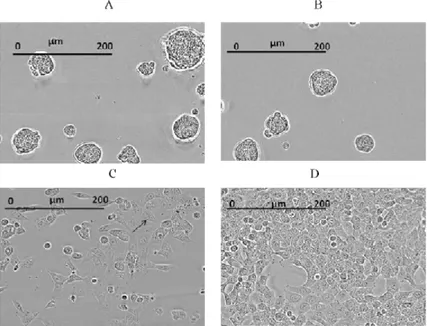
In addition to the FMCA hits AQDTEM also identified agents that induced morphological changes not related to decreased cell viability. These hits included compounds leading to formation of cell aggregates (Figure 7A and 7B) or intracellular vesicles (Figure 7C), the latter group previously con-firmed as modulators of the autophagy machinery (paper I). The compounds inducing cell aggregates are all licensed drugs against various cancer dis-eases and belong to the protein tyrosine kinase-targeting class of pharmaceu-ticals. Thus, these observations support the general conclusion that any two compounds having an outstanding but mutually similar DTEM profile are likely to share a common/similar bioactivity.
Figure 7. HCT116 cells treated with (A) Vandetanib causing formation of cell ag-gregates, (B) Dasatinib causing formation of large spheroidal cell aggregates. (C) ancitabine hydrochloride causing intracellular vesicles pointed by black arrowhead, (D) untreated control cells for 72 hrs.Figure 5. Chemical structure of four com-pounds inducing formation of large spheroidal cell aggregates. (A) ATA, (B) Dasatinib, (C) Vandetanib and (D) Imatinib. All of them have been reported as inhibitors of PDGF signalling.
4.4 Identity control of cell lines and discovery of
chemically induced differential activity in iso-genic cell
line pairs. (Paper IV)
In this article the potential of pixel histogram hierarchy comparison (PHHC) for use in quality control procedures as well as in heterogeneity analyses of iso-genic cell lines for identification of chemicals (drugs) with differential activity was explored. In cancer and cancer pharmacology research cell lines are widely used as models for studying key phenomena such as cell growth,
development and death. Recently there has been an upsurge in the number of different cell lines and the range of cancer types they represent. However, cell line cross-contamination, genetic drift, microbial infection and manual human mistakes are well known factors behind poor reproducibility of find-ings from cell line models [58-61]. Therefore there is an increasing demand for fast and simple assays making it possible to characterize any unknown cell line to one of among a set of possible alternatives (authentication). There are a number of cases where the publications had to be retracted due to cross-contamination of cells [62, 63]. Due to these issues many journals now require the cell line to be validated prior to publication [64]. There are sever-al methods for detection of intra- and interspecies contamination, sever-all relying on molecular techniques [65-67]. These methods are very accurate but often slow, elaborate and expensive so there is room for label free methods for cell line authentication which are sufficiently fast, simple and cheap to be used on a daily basis in any cell biology laboratory and in any cancer or toxicolo-gy project involving cell culturing.
Observing substantial morphological divergence as a function of time be-tween two supposedly identical cell populations should be considered as a strong warning that one of the populations is contaminated, subject to a ge-netic drift, to a microbial infection or simply mis labelled. Similarly, it would be of pharmacological and/or toxicological interest to find that when a cell line of interest is exposed to a particular chemical, the induced change in morphology (relative to unexposed cells of the same kind) is different from the induced change of morphology in another cell line treated with the same chemical. Notably, it is the induced changes in time evolving morphology (TEM) which is compared between the two cell lines. Thus the two cell lines might have different growth patterns (morphologies) but what is compared is how the induced changes in these growth patterns agree or disagree when both cell lines are treated with the same chemicals.
In the article we demonstrate the feasibility of our method to distinguish between cell lines based on their TEM profiles. It can be used as a label-free tool for simple identity control of cell lines and to compare perturbed iso-genic cell line pairs.
4.4.1 Quality control of cell lines
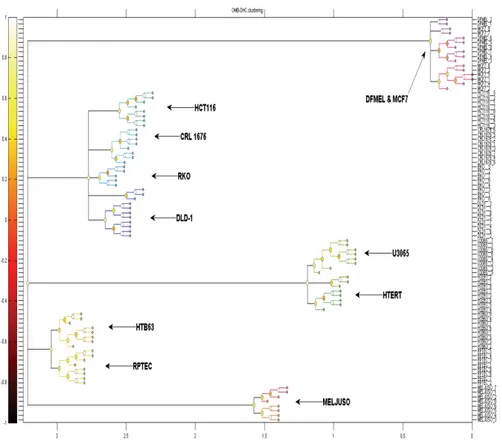
A set of 11 cancer cell lines were monitored every 6 h using our video-microscopy system (Table 1). TEM profiles were extracted for each well on the microtiter plate and they were compared pairwise using our computa-tional PHHC method. The resulting differences were then visualized using multidimensional scaling and hierarchical clustering. As shown in Figure 8 this resulted in wells corresponding to each of the 11 cell lines forming sepa-rated clusters except for the examples of DFmel and MCF7 which co-clustered.
Figure 8. Visualizations of pairwise relationships between TEM on one microtiter plate. Each well (each cell line seeded in 8 different wells) containing cells from one of 11 different cell lines. For the names of the cell lines, see Table 1. (A) Three-dimensional multiThree-dimensional scaling.
A modern supervised machine learning method, Random Forest [68], was also employed to determine how well one may discriminate between the cell line profiles. A repeated external 10-fold cross validation procedure was repeated 250 times yielding 250 different unbiased performance estimates of the expected classification performance (error rate). This distribution of per-formances is shown in Figure 9. This error distribution has the average 4 % and the interquartile range (IQR) 1.6 %.
Figure 9. A histogram of the 250 unbiased cross validation based performance (er-ror rate) estimates of the expected classification performance when designing classi-fiers for discrimination between the 11 different cell lines. This distribution has the average 4% and the interquartile range (IQR) 1.6%.
4.4.2 Comparing unperturbed iso-genic cell line pairs
The results show that the method is promising as a tool to distinguish be-tween the iso-genic cell line pairs and it is concluded that the single allele knock-out or knock-in have produced morphological differences large enough that can be detected through relatively simple image analysis algo-rithms (Figure 10).
Figure 10. Analysis of three iso-genic cell line pairs. (A) Phase contrast images of cells at time point 72 h. (B) Time-evolving pixel histograms displayed after first subtracting a reference histogram being the global average histogram across all the time points. (C) Hierarchical clustering representing all three iso-genic cell line pairs.
4.5 NMR spectroscopy based metabolic profiling of
drug induced changes in vitro can discriminate between
pharmacological classes
In this paper we report results from using an independently developed meta-bolic semi-high throughput profiling assay, which is based on NMR spec-troscopy. Over the last decade, systemic molecular profiling technologies have emerged as highly useful tools to acquire deepened understanding of drug actions as well as disease mechanisms. This particularly applies to mRNA gene expression profiling where the CMap, a database and core con-cept based on a highly standardized in vitro setting, represents a major land-mark [69]. CMap has enabled the identification of novel clinical areas for several already licensed drugs (drug repurposing), thereby significantly ex-panding their applicability [70-72]. It has also been very useful for the eluci-dation of drug mechanisms for a number of uncharacterized drug candidates
[73-83]. The original CMap is a gene expression database publicly available at Broad Institute which contains information about drug induced mRNA gene expression changes in a few cell line models after being exposed to 1309 different chemical compounds during 6 hours. Software provided by the CMap home page at Broad as well as from others has made it possible to successfully use the CMap database for mechanism of action determination of unknown drugs. Moreover, this software has been successfully used to suggest candidate compounds that are inducing a desired target mRNA ex-pression change in living cells. Unfortunately it is costly to allow further expansion as well as application of the CMap database for new compounds since every compound would require performing at least one new mRNA gene expression experiment. Moreover, the CMap only contains information about mRNA changes induced after 6 hours of exposure that may be an in-appropriate time point in many cases. This suggests that one should consider alternatives to the original CMap that are more cost effective and simple to use.
In the proof-of-concept study reported here 1H-NMR spectra were
col-lected only for the polar fraction of the cell lysates and used to study changes in the polar metabolome in the colorectal cancer cell line HCT116 following exposure to 26 different market-licensed or investigational drugs distributed across 12 different pharmacological classes. The subsequent multivariate data processing reveals that many among the 26 accordingly tested agents clustered in compliance with their respective major pharmacology classifica-tion (Figure 11). Thus, the results presented supports the noclassifica-tion that this kind of metabolite profiling offers a straightforward and inexpensive method to predict drug mode of action. Likewise analogous with the original CMap approach, the presented metabolite profiling opens a new experimental ave-nue to suggesting alternative (individualized) pharmacotherapies, based on inverse pharmacology response versus disease signature patterns.