Postprint
This is the accepted version of a paper published in Journal of Personality and Social Psychology. This paper has been peer-reviewed but does not include the final publisher proof-corrections or journal pagination.
Citation for the original published paper (version of record):
Eriksson, K., Vartanova, I., Strimling, P., Simpson, B. [Year unknown!] Generosity Pays: Selfish People Have Fewer Children and Earn Less Money Journal of Personality and Social Psychology
https://doi.org/10.1037/pspp0000213
Access to the published version may require subscription. N.B. When citing this work, cite the original published paper.
Permanent link to this version:
Generosity Pays: Selfish People Have Fewer Children and Earn Less Money
Abstract
Does selfishness pay in the long term? Previous research has indicated that being otherish rather than selfish has positive consequences for psychological well-being, physical health, and relationships. Here we instead examine the consequences for individuals’ income and number of children, as these are the currencies that matter most in theories that emphasize the power of self-interest, namely economics and evolutionary thinking. Drawing on both cross-sectional (Studies 1 and 2) and panel data (Studies 3 and 4), we find that otherish individuals tend to have more children and higher income than selfish individuals. An additional survey (Study 5) of lay beliefs about how self-interest impacts income and fertility gives an indication of why selfish people persist in their behaviour even though it leads to poorer outcomes: people generally expect selfish individuals to have higher incomes. Our findings have implications for lay decisions about the allocation of scarce resources, as well as for economic and evolutionary theories of human behavior.
Introduction
Much of social life poses a tension between seeing to one’s own interests versus attending to the interests of others (Penner et al., 2005; Balliet, Tybur, & van Lange, 2016). Social science has amassed a large body of evidence of individual differences in the relative importance people assign to their own and others’ interests under these conditions (Schroeder & Graziano, 2015). This research shows a high degree of variation in the extent to which people are selfish versus “otherish.” From the vantage point of much theory in biology and the social sciences, this variation is puzzling (Lehmann & Keller, 2006). For instance, rational choice theories conceive of people as maximizing their utility, with selfish individuals deriving utility mainly from their own payoff and otherish individuals also deriving utility from
outcomes to others. By maximizing their own outcomes, selfish individuals should be better off in the long run than otherish individuals who are optimizing something else. How then can otherishness prevail?
The premise that selfishness makes you better off is challenged by a growing body of research showing how selfishness can be disadvantageous (Grant, 2013). A recent review concluded that having an otherish motivation, defined as “wanting or striving to benefit others because one cares about their well-being,” is positively related to psychological well-being, physical health, and social relationships, and conversely, that a selfish motivation is costly in these respects (Crocker, Canevello, & Brown 2017). At the same time, self-interest has long held an exalted place in theories of human behavior (Miller, 1999) and these theories may consider well-being and relationships as relatively peripheral. For instance, in evolutionary theories, psychological well-being matters little so long as it does not interfere with the ability to reproduce. Similarly, in economic theory, the quality of one’s social relationships only matters insofar as it has implications for the accumulation of material resources. Thus a key issue becomes whether those who are more self-interested fare better in those domains where self-interest, at least in theory, reigns.
We address this issue by asking three interrelated questions. First, does selfishness pay in terms of economic resources, or do selfish individuals tend to have lower incomes than otherish individuals? Second, does selfishness pay when it comes to fertility, or do otherish individuals tend to have more children? Finally, do lay intuitions about the the relationship between selfishness and income, and selfishness and fertility, align with dominant theories of self-interest, or the empirical data? This latter question is critical from a rational choice perspective, as it addresses the outcomes people think that selfishness optimizes. The sections to follow address each of these questions in more detail.
Selfishness and income
As noted by Crocker et al. (2017), selfish behavior can lead to greater gains in the short term. In the long run, however, the relation between selfishness and material benefits could be more complex and there are clear bases for competing hypotheses. On the one hand, we might expect a positive relationship between selfishness and income, even in the long run, since those who value their self-interest will tend to pursue jobs that emphasize greater rewards to themselves, including higher pay and more opportunities for advancement. Similarly, they may be less likely to take on jobs that pay less but promote others’ welfare (e.g., school teachers, social workers, police officers, firefighters, etc).
But there are also reasons to expect a negative relationship between selfishness and income. First, recent work shows that those who are more prosocial and contribute more to groups are granted
positions of status (Hardy & van Vugt, 2006; Willer, 2009) and leadership (Harrell & Simpson, 2015) in those groups. That higher status positions and leadership positions are also generally accompanied by higher material outcomes implies a negative relationship between selfishness and income. Similarly, many high paying jobs and occupations require the ability to empathize and work well with others. Given that such skills tend to be higher in those with prosocial emotions (Van Doesum, Van Lange, & Van Lange, 2013; Feinberg et al., 2012), we should expect prosocials to be better off economically. Further, selfishness has detrimental effects on relationships (Crocker et al., 2017). Since friends and acquaintances are key sources of information for employment opportunities (Granovetter, 1995; Bian,
1997), selfishness may be detrimental to income via its negative impact on social relations and social capital (Adler & Kwon, 2002). A meta-analysis of the literature on organizational citizenship
(Podsakoff, Whiting, Podsakoff, & Blume, 2009) found that managers tend to reward employees who help others at work (although this may not hold in every organization, see Bergeron, Shipp, Rosen, & Furst, 2013).
Finally, findings from happiness research indicate that the relationship between selfishness and income may be non-linear, in the form of an inverted U-shape (Grant & Schwartz, 2011). Namely, the highest income has been found to be associated with moderate, not maximum, levels of happiness (Oishi, Diener, & Lucas, 2007). As the same work found a strong linear relationship between happiness and volunteering work (an otherish behavior), it could be that the highest income is also associated with moderate levels of otherishness.
Selfishness and fertility
While income is a key outcome variable for management researchers and economists, evolutionary biologists are more concerned with fertility. Of course, these outcomes are not
independent; indeed, fertility is negatively related to income in most countries at most times (Jones, Schoonbroodt, & Tertilt, 2008). But what is the relation between selfishness and fertility, particularly within a given time and place? Some evolutionarily oriented researchers take for granted that, within a group, the most selfish individuals have the greatest reproductive success, and thus argue that the high level of other-oriented behavior observed in human populations requires some additional evolutionary mechanism, such as group selection (e.g., Sober & Wilson, 1999). Indeed, explaining the capacity for unselfish behavior is a key topic of theoretical studies of the evolution of human behavior (Cownden, Eriksson, & Strimling, 2017).
While much evolutionary theorizing assumes that selfishness pays in terms of reproductive success, there are also clear reasons to expect a negative relation between selfishness and fertility.
Perhaps most obvious is that having a child generally requires extreme attention to his or her needs and interests, very often at a cost to one’s own. This suggests that more selfish individuals may be less motivated to have children. Moreover, otherishness is associated with better relationships (Crocker et al., 2017), and better relationships may create greater opportunity to have one or more children. Despite the importance of this issue for core assumptions underlying evolutionary theorizing, we know of no empirical investigation of the relation between selfishness and fertility in the general population.
What outcomes do people expect?
Although some branches of the social and biological sciences give clear predictions that
selfishness will pay in income and offspring, whether lay beliefs will align with these scientific theories is less clear. Miller (1999) has argued that the ubiquity of the self-interest assumption in economic theories trickles down to influence lay beliefs. Similarly, Crocker et al. (2017, p. 315) state in passing that “people expect selfish motivation to pay off.” But we know of no empirical investigations into lay beliefs about whether selfishness actually pays. This is an important question from a rational choice perspective, as it addresses whether people believe that selfishness optimizes payoffs, so that it is rational for selfish people to be selfish.
Although researchers describe negative outcomes of selfishness as paradoxical (Crocker et al., 2017; Konow & Earley, 2008), it seems a priori possible that laypeople view negative outcomes of selfishness as intuitive, that is, consistent with their implicit theories of how psychological traits or social values interact with the social world to produce outcomes. After all, research has shown that folk psychology, in the sense of laypersons’ intuitive ideas about the mental states and behavior of other people, is not always inaccurate (e.g., Mehl, Gosling, & Pennebaker, 2006). Our question extends the examination of folk psychology to the realms of fundamental human motivations and how they lead to key life outcomes.
Outline of studies
To map how selfishness is related to income and fertility, we searched for existing large-scale and representative survey datasets that include measures of selfishness as well as data on income and
number of children. Crocker et al. (2017) distinguished between otherish behavior and otherish
motivation, since otherish behaviors may be driven by either otherish or selfish motivations. It is
therefore important to look at both motivations and behaviors. We found two datasets well suited to our research questions, the General Social Survey (GSS) and the European Social Survey (ESS), which are analyzed in Studies 1 and 2, respectively. We then searched for panel data that could shed more light on causality, which yielded the UK Household Longitudinal Study (UKHLS) and the Panel Study of Income Dynamics (PSID), analyzed in Studies 3 and 4, respectively. Finally, we conducted a new survey designed specifically to examine people’s intuitions about the outcomes of selfishness (Study 5).1
Study 1: Analysis of the General Social Survey
The GSS is a biannual survey asking demographic, behavioral, and attitudinal questions to a representative sample of American respondents. We use data from the four rounds of the GSS (2002, 2004, 2012, 2014) that included measures of selfishness. Our analyses are based on a sample of 5,294 individuals, 54% women, mean age 47.4 with standard deviation 17.4.
Measures
Otherish motivation. Three items related to otherish motivation: “People should be willing to
help others who are less fortunate”; “Personally assisting people in trouble is very important to me”;
1 No institutional ethical approval was sought, as the Swedish Act concerning the Ethical Review of Research
Involving Humans (2003:460) states that studies with adults using informed consent need approval only if they use a method intended to physically or mentally influence a person or if they involve sensitive information that can be traced back to individual persons. Neither of these conditions apply to the secondary data analyses of publicly available and fully anonymized datasets (Studies 1-4) or to our own survey of intuitions about the outcomes of selfishness (Study 5).
“These days people need to look after themselves and not overly worry about others” (reverse coded). Responses were given on a four-point scale from strongly disagree to strongly agree and were averaged to a measure of otherish motivation (Cronbach’s alpha = .58). The resulting measure was highly
negatively skewed; we bottom-coded it at the lowest percentile to reduce sensitivity to outliers. The measure was then normalized to range between 0 and 1. The final measure had median 0.62, mean 0.56, and standard deviation 0.47.
Otherish behavior. The selected years of the GSS asked the respondent how often during the last
12 months he or she had engaged in each of ten helping behaviors (e.g., donating money for charity, offering one’s seat on a public transportation). See supplementary material for details. These ten responses were averaged for our measure of otherish behavior (Cronbach’s alpha = .74). The resulting measure was highly positively skewed; we top-coded it at the highest percentile to reduce sensitivity to outliers. The measure was then normalized to range between 0 and 1. The final measure had median 0.36, mean 0.39, and standard deviation 0.45.
Number of children. The number of biological children was measured by the question “How
many children have you ever had?”. Responses were given as a number.
Income. Income was measured at the household level (annual family income before taxes), as
well as at a personal level for those 3,508 respondents who earned any income from employment the year prior to when the survey was conducted. Income variables were log transformed.
Analysis
Missing values. There were missing data on income (12% for household income; 8% for personal
income). Missing data on income could be correlated with otherishness, which might bias results. Following Rubin (1987), we deal with this via multiple imputation (see supplementary information). Our analyses are based on combined results from five imputed data sets.
Exclusion. In the personal income models only, we excluded respondents that do not earn
Modeling. We used the provided design and post-stratification weights in all estimated models.
All models include controls for gender, age, ethnicity (white, black or other), and year of survey. To account for the fact that age is non-linearly related to number of children, we control the age effect with penalized cubic splines in generalized additive models, which is a robust way of estimating an
underlying smooth function in cases where it is not known (Wood, 2017).
In accordance with the nature of the data, our analyses of number of children use Poisson models, and our analyses of income use linear models. To account for a possibly non-linear relation between otherishness and income/fertility, we fitted both a linear and a quadratic model and selected the best fitting model according to the Bayesian information criterion (Schwarz, 1978). We present the results of the best fitting models. To ensure that quadratic polynomials represent the underlying non-linear
relationship accurately, the online supplement presents the result of estimating the underlying function using penalized cubic splines instead.
Results
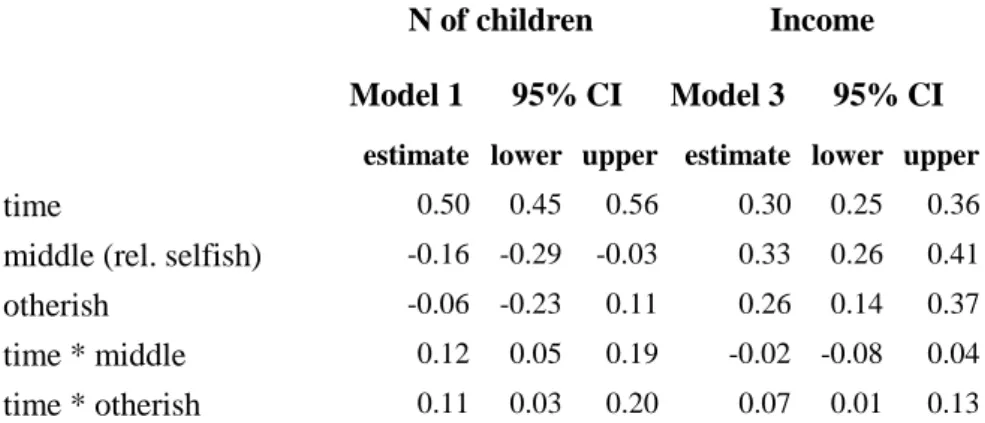
As illustrated in the top left panel of Figure 1, number of children was positively related to otherish motivation. The unstandardized regression coefficient was B = 0.20, 95% CI [0.02, 0.40]. For otherish behaviour the best fitting model is shown in the top right panel of Figure 1. It yielded a positive slope, B = 0.19, 95% CI [0.08, 0.30] for the linear term, but with a slight U-shape, B = 0.53, 95% CI [0.18, 0.89] for the quadratic term. (Note that a positive sign of the coefficient of the quadratic term means a U shape, a negative sign means an inverse U-shape.) However, the quadratic model had only marginal advantage over the linear model, so a purely linear model would be nearly as preferable.
The middle and bottom panels of Figure 1 show that income (whether measured at the personal or household level) was also positively related to having an otherish motivation (household income: B = 0.30, 95% CI [0.15, 0.44], personal income B = 0.21, 95% CI [0.03, 0.38]) . However, the relation between income and otherish behavior was not strictly positive but exhibited an inverse U-shape (household income: B = 0.04 , 95% CI [0.13, 0.20] for the linear term and B = 2.64, 95% CI [3.22,
-2.06] for the quadratic term; personal income: B = -0.14 , 95% CI [-0.33, 0.06] for the linear term and B = -1.66, 95% CI [-2.36, -0.96] for the quadratic term).
[Insert Figure 1 here]
Discussion
Our analysis of data from the GSS revealed several key findings. First, regardless of whether we measured selfishness/otherishness via motivations or behaviors, we found that fertility was positively associated with otherishness. Results for income were less straightforward, as they they depended on whether otherishness was measured via motivations or reported behaviors. For motivations, we found that otherishness was generally related to higher levels of income. For behaviors, we found that that the highest incomes were associated with moderate levels of otherishness. Before discussing this particular pattern in more detail, we assess whether it replicates in a multi-country dataset.
Study 2: Analysis of the European Social Survey
The ESS is a biannual multi-country survey, based on random probability sampling and face-to-face interviews, which monitors public attitudes and values within Europe. For the present paper, we focused on the third round of the ESS (2006), the only round that has information on number of
children. The integrated data files provided by the ESS contain third round data on 43,000 respondents from 23 European countries, 54% females, mean age 47.5 with standard deviation 18.5.
Measures
Otherish motivation. The ESS measures respondents’ values using short verbal portraits of
different people. For each portrait, the respondent is asked “How much like you is this person?” Responses are given on a six-point scale between very much like me (coded as 6) and not like me at all (coded as 1). One of the items describes an individual with otherish motivation: “It's very important to him to help the people around him. He wants to care for their well-being.” We use responses to this item as our measure of otherish motivation. Since less than 0.5% chose the lowest category, we collapsed it
with the next category (not like me) and rescaled the variable to range between 0 and 1. The final measure had median median 0.75, mean 0.67, and standard deviation 0.24.
Otherish behavior. Three items in the survey measured helping behaviors: (1) In the past 12
months, how often did you get involved in work for voluntary or charitable organisations? (2) Not counting anything you do for your family, in your work, or within voluntary organisations, how often, in the past 12 months, did you actively provide help for other people? (3) And in the past 12 months, how often did you help with or attend activities organised in your local area? Responses were given on a five-point scale from at least once a week (coded as 5) to less often than once every six months (coded as 1). Responses on these two items were averaged to create a measure of selfish behavior (Cronbach’s alpha = .68). After rescaling to range between 0 and 1, the measure had median 0.27, mean 0.28, and standard deviation 0.26.
Number of children. The number of biological children was measured via the question “How
many children have you ever given birth to/fathered?” Responses were given as a number.
Income. Income was measured at the household level via the question “Using this card, if you add
up the income from all sources, which letter describes your household's total net income?” In almost all countries, respondents were provided the same 12 categories ranging from a monthly income of less
than €150 to a monthly income of €10000 or more. In Estonia and Ukraine the question was asked
without a showcard, and responses were subsequently recoded in the above-mentioned categories. Income categories in Bulgaria, Russia, and Hungary were lower than in the main questionnaire to better represent income distribution. Given this, we normalize income within each country as z-scores.
Control variables. Our analyses control for age, gender, education (primary or lower, secondary,
tertiary), whether the respondent was born in the country in which the survey took place, and marital status (single, married/cohabiting, widowed/divorced). The household income models additionally control for number of household members.
Analysis
Missing values. The income variable contained a high proportion of missing values, ranging from
4% in Norway to 51% in Portugal. As in Study 1, we dealt with missing data using multiple imputation (see the online supplement).
Modeling. ESS data has a multilevel structure with individuals nested in countries. Accordingly,
our models include a random intercept with zero mean and estimated variance. All models include controls for gender, age and if respondent belong to ethnic minority in the country. The analysis otherwise followed that of Study 1.
Results
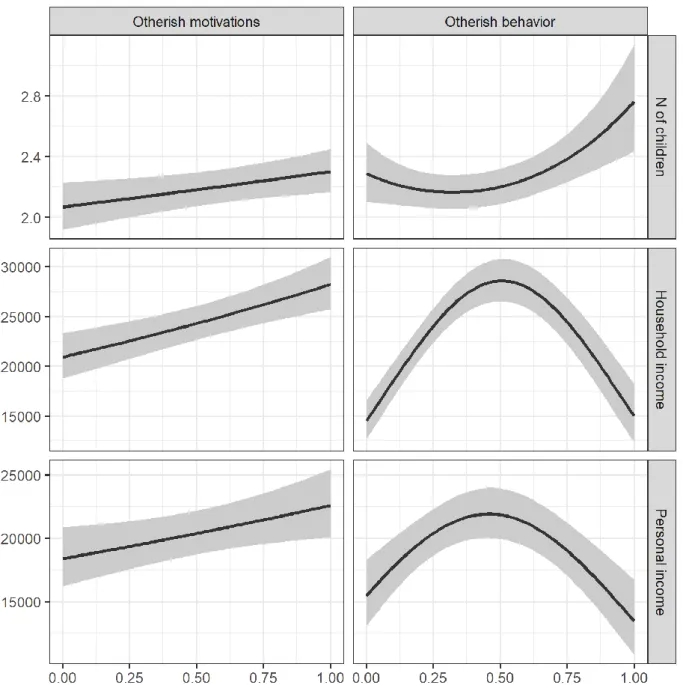
The results are displayed in Figure 2. The top left panel shows that number of children was positively related to otherish motivation B = 0.14, 95% CI [0.10, 0.18]. The top right panel shows a positive relation also with otherish behavior, B = 0.12, 95% CI [0.08, 0.16] for the linear term, but with a slight U-shape, B = 0.17, 95% CI [0.06, 0.28] for the quadratic term.
The bottom left panel of Figure 2 shows that income was positively related to otherish motivation,
B = 0.20, 95% CI [0.09, 0.31] for the linear term, with a tendency toward an inverse U-shape, B = -0.60,
95% CI [-0.82, -0.38] for the quadratic term. The bottom right panel illustrates that the same held for the relation between income and otherish behavior, B = 0.22, 95% CI [0.15, 0.28] for the linear term, and B = -0.55, 95% CI [-0.71, -0.39] for the quadratic term.
[Insert Figure 2 here]
Discussion
The European Social Survey data differed from the GSS data in that it covered 23 countries and used different measures of otherish motivation and behavior. Nonetheless, this study replicated the GSS finding of a positive association between otherishness and fertility. Moreover, it provided a resolution of the conflicting results about income in the GSS data. Namely, the ESS study suggests both that
moderate levels of otherishness are associated with the highest incomes (as the behavioral measure of the GSS indicated) and that high levels of otherishness are associated with higher incomes than low levels of otherishness (as the motivational measure of the GSS indicated). Reassuringly, in the ESS we consistently obtained the same findings whether motivational or behavioral measures of otherishness were used. Note that the inverted U-shape of income in relation to otherishness is also consistent with the finding from happiness research described earlier (Oishi et al., 2007). That said, Studies 1 and 2 are both limited by the use of cross-sectional data. The next two studies draw on panel data to address whether being otherish positively influences one’s future income and fertility.
Study 3: Analysis of the UK Household Longitudinal Study
The UKHLS is a large-scale panel survey in which members of a representative sample of households in the UK are followed and interviewed every year. The study covers a range of social, economic and behavioral topics. For our purposes, the important feature of the UKHLS is that it began including measures of otherish behaviors in 2010. Here we ask whether these measures predict number of children and income up to the last available wave in 2016.
The sample for this study includes adult household members (age 16 or older) that were interviewed in 2010 and remain in the sample in the last available wave in 2016. For the number of children analysis, we included all respondents who were at most 45 years of age by the last time point, totaling 4,402 individuals, 62% females, mean age 29.6 (sd = 6.1). For the income analysis, we included all respondents who were employed or self-employed and had positive income at the first time point and at least twice in the follow up interviews, and who were no more than 65 years of age at the last time point, totaling 7221 individuals, 54% females, mean age 42.0 with standard deviation 9.6.
Measures
Income. Income is measured as monthly amount of income from work, top coded at £15,000. The
Number of children. Respondents indicated the number of biological children when they were
interviewed for the first time and the number of newborn children, if any, during the follow-up interviews.
Otherish behavior. There were two measures of otherish behavior: amount donated to charity and
time spent on volunteering. As described in the supplementary material, these measures were
normalized with respect to respondents’ income and available time, standardized, and averaged. 37% of the sample had the minimum value of the resulting measure (i.e., they neither donated nor volunteered at all) and were coded as selfish. The top 25% were coded as otherish. The 38% in-between were coded as
middle. Analysis
We used the provided longitudinal weights, which correct for panel attrition, unequal probabilities in the originally designed sample, and nonresponse.
Missing data. The income variables are imputed by the data providers. For other variables, the
amount of missing values is minimal, being largest at 3% for selfish/otherish behavior. Since the
expected effect of missing values on estimates is minimal, we use only complete cases for the analyses.
Modeling. We use mixed models with survey years nested in individuals, random intercept in
both models, and random time slope only in the income model. Random time slope in the number of children model indicated overfit and thus was excluded from the final estimation. Both models control for time*age, time*gender, and ethnicity (white, other or mixed).
Results
[Insert Table 1 here]
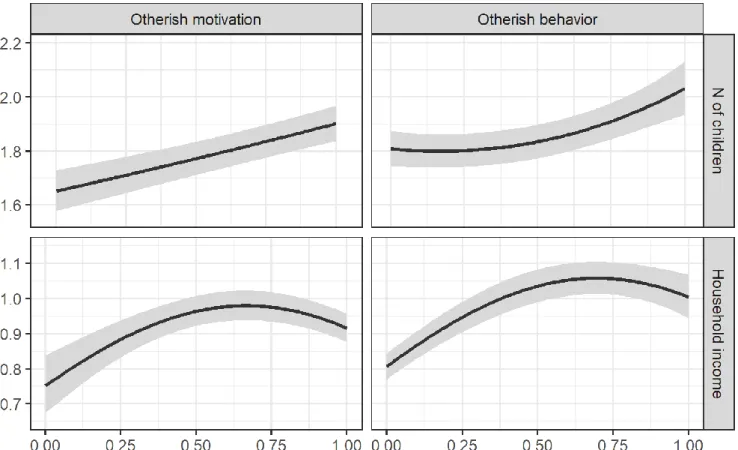
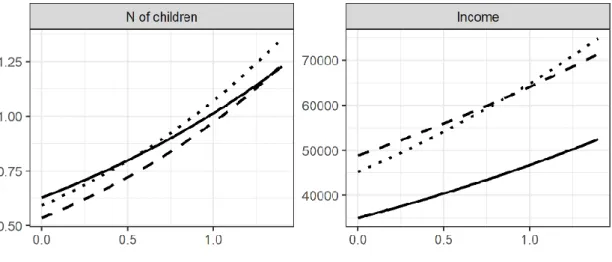
Table 1 presents estimates and confidence intervals of starting levels and slopes of the middle and otherish categories relative to the selfish category. Results are illustrated in Figure 3. The left panel shows that the number of children started highest for respondents in the selfish category (black line) but, importantly, grew faster for people in the middle (dashed line) and otherish (dotted line) categories. The
right panel of Figure 3 shows that income started highest for respondents in the middle category but grew fastest for those in the otherish category. Income for those in the selfish category both started lower and grew slower, compared to those in the otherish category.
[Insert Figure 3 here]
Discussion
Here we used data from the UK Household Longitudinal Study to address whether being otherish has a positive influence on one’s future income and fertility. Results were affirmative. Five years after their behavioral otherishness was measured, otherish participants had a greater increase in the number of children and a greater increase in income than selfish respondents. A middle category of moderately otherish respondents also had a greater increase in the number of children than did selfish respondents, but not in income.
While these results are consistent with a causal role of otherishness/selfishness in key life
outcomes, a limitation of this study is that there is only five years between our measure of otherishness and the dependent measures. With a longer time-span, we might see the otherish category overtake the selfish category in total number of children (as we would expect based on the findings in Study 1 and Study 2).. The data used in the next study offer a more extended time series..
Study 4: Analysis of the Panel Study of Income Dynamics
The PSID is a large-scale panel survey following 5,000 families in the United States. The original sample was initiated in 1968 with individuals from selected households, and their descendants were assessed in follow-up surveys. Here we restrict our sample to those who were interviewed in 2001 when the series of questions for philanthropic behavior were first introduced in the questionnaire. Following the same inclusion criteria as in study 3, models for the number of children models include 1759 respondents, 42% females, mean age 25.5 at the first wave with standard deviation 3.1. For the income
models, we also use the same inclusion criteria as in study 3, yielding 4017 respondents, 29% females, mean age 36.6 with standard deviation 8.2.
Measures
Income. Income is measured as income from labor for the year prior to the interview, the sum of
several self-reported income components, such as wages and salaries, different kinds of bonuses, overtime, and income from business. The measure was log transformed.
Number of children. PSID records childbirth history for all new members of the panel and
updates the information in each interview for all household members. We use childrens’ years of birth to calculate the number of children respondents have at a given interview year.
Otherish behavior. Similar to Study 3, respondents were coded as selfish (41%), middle (34%),
or otherish (25%), based on their donations to charity and volunteering. Details are given in the online supplement.
Analysis
Missing data. Our analyses are based on combined results from five imputed data sets, with
missing data already imputed by the data providers. However, the data are affected by attrition, which occurs if a respondent withdraws from the study, or if a person who was not a respondent in the original (1968) sample or a descendant of an original respondent moves out of the household. It is possible that attrition might correlate with selfishness and thus bias the results. Since longitudinal weights are provided only for those respondents who were part of the original sample and their descendants, using them would significantly reduce the number of eligible cases, especially spouses or partners.
Modeling. We use mixed models with survey years nested in individuals. We use Poisson models
for the number of children and linear models for income, with random intercepts in both models and random time slopes only in the income models. A random time slope in the number of children model indicated overfit and thus was excluded from the final estimation. Both models control for time*age, time*gender and ethnicity.
Married or cohabiting couples are not independent in the sample because charitable donations are reported on the family level and information on volunteering is provided from an interview with only one family member. For this reason, we additionally include a random intercept for couples in the models.
Results
[Insert Table 2 here]
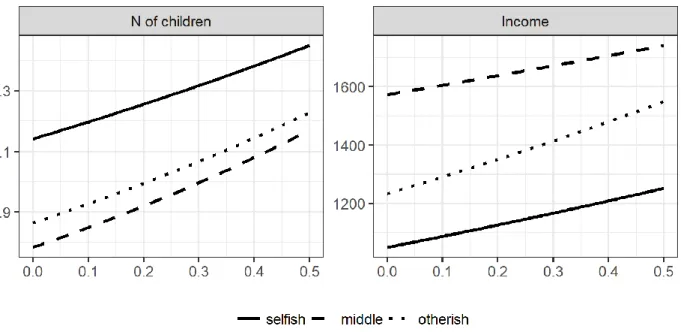
Table 2 reports estimates and confidence intervals of starting levels and slopes. Results are illustrated in Figure 4. First, note that initial levels replicated the pattern of results in Study 3, with selfish respondents (black line) starting out highest on number of children (left panel), and the middle category (dashed line) starting out highest on income (right panel). Second, note that the slopes
replicated the pattern of results in Study 3, with the otherish respondents (dotted line) showing the most positive development both for number of children and income. Most importantly, note that at the end of this longer time-span, the otherish category was highest both on number of children and income.
[Insert Figure 4 here]
Discussion
Using data from the Panel Study of Income Dynamics in the United States, we were able to
analyze how participants’ number of children and income developed over 14 years after their behavioral otherishness was measured. The results replicated the findings in Study 3: otherish and moderately otherish respondents had a greater increase in number of children than selfish participants, and otherish participants had a larger increase of income than both selfish and moderately otherish participants. Moreover, at the end of the 14 years, otherish respondents had both the highest number of children and the highest incomes of all respondents.
Our final study is aimed at examining laypeople’s intuitions about the outcomes of selfishness. Do people anticipate the largely negative impact of selfishness and income identified in the previous
studies? Or do they believe that selfishness pays?
Method
We recruited 400 participants from the United States via Amazon Mechanical Turk (mturk.com). The gender distribution was approximately equal (54 % male), mean age 35.2 with standard deviation 10.1. The sample size was set in advance to allow estimation of proportions with an inaccuracy (95% CI) of at most 5%.
Instructions for the survey began by defining for participants three categories an individual could belong to, noting that otherish individuals tend to think it is very important to help the people around them, and care a lot about the well-being of others; selfish individuals are those who are definitely not otherish; and the category between otherish and selfish was called inbetween. Participants were asked to think about how people in these categories fare in life and answer five questions about them: “On average, which category tends to have the highest number of children; the best physical health; the highest income; the best relationships; the highest psychological well-being?” Each question had four response options: otherish, selfish, inbetween, and no difference between these categories.
To allow us to assess whether perceptions were relatively robust across participants’ own
motivation-types, participants were then asked to categorize themselves as either otherish (36%), selfish (8%), inbetween (51%), or don’t know (5%). Finally, as validation, we had participants complete a well- established measure of prosocial preference, the 9-item triple dominance scale for social value
orientation, SVO (Van Lange, De Bruin, Otten, & Joireman, 1997). Based on their responses to the triple dominance scale, 66% of participants were categorized as having a prosocial orientation and 30% as having a proself orientation. As expected, a prosocial orientation was much more common among those who categorized themselves as otherish (77%) than among those who categorized themselves as selfish (41%), OR = 4.85, p < .001, 95% CI [2.09, 11.24].
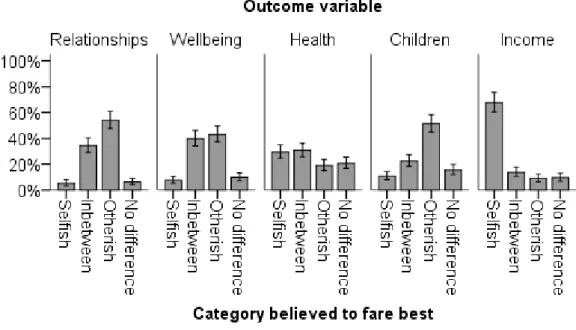
Results
Figure 5 presents the distribution of responses about which category is believed to be the most “successful” for each of the five outcome variables. Prior research (Crocker et al., 2017) has indicated that otherishness is positively related to the three leftmost outcome variables in Figure 5, namely
relationships, psychological well-being, and physical health. Figure 5 shows that participants’ intuitions tended to align with the empirical evidence on relationships and well-being. Specifically, binomial tests show that it was much more common for participants to believe that otherish types had better
relationships than their selfish counterparts, 54% vs. 5%, p < .001, and that otherish individuals had higher levels of well-being, 43% vs. 8%, p < .001. For physical health, however, lay expectations ran counter to the empirical data, with participants believing that the otherish category would be less apt to be physically healthy than their selfish counterparts, 19% vs. 30%, p = .003.
[Insert Figure 5 here]
We now turn to the two outcome variables that are the core focus of the current research. As Figure 5 shows, intuitions about children were very different from intuitions about income. Participants were more apt to believe than otherish types had more children than selfish types, 51% vs. 10%, p < .001, whereas the opposite held for income, 9% vs. 68%, p < .001. Importantly, as discussed more fully in the supplementary material, these results did not depend on participants’ own types.
Discussion
This final study checked lay beliefs against empirical data on how selfishness versus otherness are associated with key life outcomes. Across all outcome variables, the vast majority of participants
believed that outcomes were related to selfishness, and there was generally substantial agreement about the direction of that relation for a given outcome variable. Specifically, people tended to think that selfishness is positively associated with success in terms of physical health and income, but negatively
associated with success in terms of relationships, psychological well-being, and number of children. We return to these findings in the general discussion.
General Discussion
Previous research has established a host of positive outcomes of being otherish rather than selfish, including better social relationships, higher psychological well-being, and better physical health
(Crocker et al., 2017). Here we asked whether otherishness pays off also in two other currencies, income and fertility, which are more central to economic and evolutionary theories. Money and children are obviously important goals and life outcomes for many people, so it is also of general interest to know whether the paths to these outcomes are more apt to be paved with otherishness or selfishness.
Our first two studies examined cross-sectional data on otherishess and outcomes in the United States (Study 1) and 23 European countries (Study 2). Taken together, these studies indicated that otherish people tend to have higher fertility and income than selfish people, but that the relation with income was not necessarily linear - the largest incomes tended to be found among moderately otherish people. To assess causality, the next two studies used panel data from the United Kingdom (Study 3) and the United States (Study 4). We found that those who reported higher levels of otherish behaviors at one point in time experienced larger increases in the number of children and income in subsequent years.
Results from all studies tell a consistent and straightforward story for fertility: otherishness leads to more children. What mechanisms may account for this outcome? We think there are at least two main possibilities. Compared to otherish individuals, selfish individuals may simply be less interested in having many children, given the time, money and other forms of self-sacrifice that having and raising children can entail. Another possibility is that because selfish individuals have lower quality
relationships (Crocker et al., 2017), they have fewer opportunities to have children. These hypotheses are testable, but we know of no extant data that speak to them.
The finding that more otherish people tend to have a greater number of children has important implications for evolutionary theories. Namely, it suggests that humanity may be evolving towards lower levels of selfishness. Note, however, that while selfishness/otherishness is heritable, existing studies show that the heritability is not very high; twin studies of self-reported altruism have yielded estimates of heritability between 0 and 50% (Bouchard & Loehlin, 2001; Krueger, Hicks, & McGue, 2001; Rushton, 2004; Rushton, Fulker, Neale, Nias, & Eysenck, 1986), and a large twin study of charitable donations estimated the heritability at 22% (Cesarini et al., 2009). These findings indicate a strong influence of environmental factors. Even if genes promoting selfishness tend to become less common in the population, the total level of selfish behavior in society is likely to be more strongly determined by norms, institutions, and other societal factors.
Our findings also speak to theories of the evolutionary history of otherishness in humans. It is often assumed that evolution promotes selfishness unless group selection acts as a counter-force (Sober & Wilson, 1999), possibly combined with a punishment mechanism to offset the advantage of being selfish (Henrich & Boyd, 2001). The finding that otherishness is associated with greater fertility within populations indicates that selfishness is not necessarily advantageous in the first place. Our datasets are limited to Europe and the United States, but if the mechanisms we sketched above are correct then we should also expect a similarly positive effect of otherishness on fertility in other parts of the world.
Our results paint a more complex picture for income, compared to fertility. Whereas otherish people tended to show the largest increases in incomes over time, the majority of our studies indicated that the highest absolute levels of income were associated with moderate otherishness. There are several ways in which otherishness may influence income levels and income trajectories. As noted earlier, otherish people tend to have stronger relations and social networks, and social networks are a key source of information about job opportunities (Granovetter, 1995). We also expect otherishness to influence the occupations people choose, which might explain why highly otherish types have lower incomes than moderately otherish types in the cross-section (Studies 1 and 2). At the same time, otherishness is
associated with a number of benefits at work, including greater chances of rewards and promotions (Podsakoff et al., 2009), which may explain the more positive income trajectories of otherish people over time (Studies 3 and 4). That said, income trajectories are inherently different between occupations. Future research may refine the study of how otherishness relates to income by explicitly taking
occupations into account.
In Study 5 we examined whether American laypeople were aware of the negative effects of selfishness. For the most part, they turned out to have accurate intuitions – especially about the negative associations that selfishness has with social relations, psychological well-being, and number of children. Thus, whereas Crocker et al. (2017, p. 315) call the finding that selfishness does not promote well-being the paradox of self-interested behavior, our study indicates that laypeople do not view it as paradoxical. Instead, the empirical finding that runs counter to lay intuitions is that selfishness is not associated with the highest income. Given people’s expectations, this finding is the real paradox of self-interested behavior. If people understood that otherish behavior pays, then selfish people might adopt otherish behavior for selfish reasons. Under their incorrect beliefs, however, it is rational for selfish people to act selfishly.
References
Adler, P. S., & Kwon, S. W. (2002). Social capital: Prospects for a new concept. Academy of Management Review, 27, 17-40.
Back, M. D., & Vazire, S. (2015). The social consequences of personality: Six suggestions for future research. European Journal of Personality, 29, 296-307.
Bergeron, D. M., Shipp, A. J., Rosen, B., & Furst, S. A. (2013). Organizational citizenship behavior and career outcomes: The cost of being a good citizen. Journal of Management, 39, 958-984.
Bian, Y. (1997). Bringing strong ties back in: Indirect ties, network bridges, and job searches in China. American Sociological Review, 366-385.
Bouchard, T. J., & Loehlin, J. C. (2001). Genes, evolution, and personality. Behavior Genetics, 31, 243-273.
Henrich, J., & Boyd, R. (2001). Why people punish defectors: Weak conformist transmission can stabilize costly enforcement of norms in cooperative dilemmas. Journal of Theoretical Biology, 208, 79-89.
Cesarini, D., Dawes, C. T., Johannesson, M., Lichtenstein, P., & Wallace, B. (2009). Genetic variation in preferences for giving and risk taking. The Quarterly Journal of Economics, 124, 809-842. Cownden, D., Eriksson, K., & Strimling, P. (2017). A popular misapplication of evolutionary modeling
to the study of human cooperation. Evolution and human behavior, 38, 421-427.
Crocker, J., Canevello, A., & Brown, A. A. (2017). Social motivation: Costs and benefits of selfishness and otherishness. Annual Review of Psychology, 68, 299-325.
ESS Round 3: European Social Survey Round 3 Data (2006). Data file edition 3.6. NSD - Norwegian Centre for Research Data, Norway – Data Archive and distributor of ESS data for ESS ERIC. Feinberg, M., Willer, R., Stellar, J., & Keltner, D. (2012). The virtues of gossip: Reputational
information sharing as prosocial behavior. Journal of Personality and Social Psychology, 102, 1015-1030.
Granovetter, M. (1995). Getting a job: A study of contacts and careers. University of Chicago Press. Grant, A.M. (2013). Give and take: A revolutionary approach to success. New York: Penguin.
Grant, A. M., & Schwartz, B. (2011). Too much of a good thing: The challenge and opportunity of the inverted U. Perspectives on Psychological Science, 6, 61-76.
Hardy, C. L., & Van Vugt, M. (2006). Nice guys finish first: The competitive altruism hypothesis.
Personality and Social Psychology Bulletin, 32, 1402-1413.
Harrell, A., & Simpson, B. (2015). The dynamics of prosocial leadership: Power and influence in collective action groups. Social Forces, 94, 1283-1308.
Jones, L. E., Schoonbroodt, A., & Tertilt, M. (2008). Fertility theories: can they explain the negative fertility-income relationship? (No. w14266). National Bureau of Economic Research.
Konow, J., & Earley, J. (2008). The hedonistic paradox: Is homo economicus happier? Journal of Public Economics, 92, 1-33.
Krueger, R. F., Hicks, B. M., & McGue, M. (2001). Altruism and antisocial behavior: Independent tendencies, unique personality correlates, distinct etiologies. Psychological Science, 12, 397-402. Lehmann, L., & Keller, L. (2006). The evolution of cooperation and altruism–a general framework and
a classification of models. Journal of Evolutionary Biology, 19, 1365-1376.
Mehl, M. R., Gosling, S. D., & Pennebaker, J. W. (2006). Personality in its natural habitat:
manifestations and implicit folk theories of personality in daily life. Journal of Personality and
Social Psychology, 90, 862-877.
Oishi, S., Diener, E., & Lucas, R. E. (2007). The optimum level of well-being: Can people be too happy?. Perspectives on Psychological Science, 2, 346-360.
Podsakoff, N.P., Whiting, S.E., Podsakoff, P.M., & Blume, B.D. (2009). Individual- and organizational-level consequences of organizational citizenship behaviors: A metaanalysis. Journal of Applied
Psychology, 94, 122–141.
Reuter, M., Frenzel, C., Walter, N. T., Markett, S., & Montag, C. (2010). Investigating the genetic basis of altruism: the role of the COMT Val158Met polymorphism. Social Cognitive and Affective
Neuroscience, 6, 662-668.
Rubin, D. B. (1987). Multiple imputation for nonresponse in surveys. New York, NY: Wiley.
Rushton, J. P. (2004). Genetic and environmental contributions to pro-social attitudes: a twin study of social responsibility. Proceedings of the Royal Society of London B: Biological Sciences, 271, 2583-2585.
Rushton, J. P., Fulker, D. W., Neale, M. C., Nias, D. K., & Eysenck, H. J. (1986). Altruism and aggression: The heritability of individual differences. Journal of Personality and Social
Psychology, 50, 1192-1198.
Sober, E., & Wilson, D. S. (1999). Unto others: The evolution and psychology of unselfish
behavior (No. 218). Harvard University Press.
Schwarz, G. (1978). Estimating the dimension of a model. The annals of statistics, 6(2), 461-464.
Van Doesum, N. J., Van Lange, D. A., & Van Lange, P. A. (2013). Social mindfulness: Skill and will to navigate the social world. Journal of Personality and Social Psychology, 105, 86-103.
Van Lange, P. A. M., De Bruin, E. M. N., Otten, W., Joireman, J. A. (1997). Development of prosocial, individualistic, and competitive orientations: Theory and preliminary evidence. Journal of
Personality and Social Psychology, 73, 733-746.
Van Buuren, S. (2012). Flexible Imputation of Missing Data. CRC press.
Willer, R. (2009). Groups reward individual sacrifice: The status solution to the collective action problem. American Sociological Review, 74, 23-43.
Table 1. Regression coefficients and 95% CI from UKHLS data
Number of children Income
Model 1 95% CI Model 2 95% CI
estimate lower upper estimate lower upper time 0.76 0.60 0.91 0.27 0.21 0.34 middle -0.38 -0.50 -0.26 0.41 0.37 0.44 otherish -0.28 -0.42 -0.14 0.16 0.12 0.21 time * middle 0.32 0.18 0.47 -0.15 -0.22 -0.08 time * otherish 0.22 0.05 0.40 0.10 0.02 0.19 Note: All models include controls for time*age, time*sex and ethnicity.
Table 2. Regression coefficients and 95% CI from PSID data
N of children Income
Model 1 95% CI Model 3 95% CI
estimate lower upper estimate lower upper
time 0.50 0.45 0.56 0.30 0.25 0.36
middle (rel. selfish) -0.16 -0.29 -0.03 0.33 0.26 0.41 otherish -0.06 -0.23 0.11 0.26 0.14 0.37 time * middle 0.12 0.05 0.19 -0.02 -0.08 0.04 time * otherish 0.11 0.03 0.20 0.07 0.01 0.13 Note: All models include controls for time*age, time*sex and ethnicity.
Figure 1. Number of children (top), household income (middle), and personal income (bottom), predicted by otherish motivation (left) and otherish behavior (right), controlling for gender and age. Data from the 2002, 2004, 2012 and 2014 waves of the GSS. Shaded regions represent 95% CI.
Figure 2. Number of children (top) and household income (bottom) predicted by otherish motivation (left) and otherish behavior (right), controlling for gender and age. Data from ESS Round 3 (2006). Shaded regions represent 95% CI.
Figure 3. Estimated growth trajectories for number of children (left), and labour income (right) conditioned on selfish/otherish behavior. Data from the UKHLS.
Figure 4. Estimated growth trajectories for number of children (left), and labour income (right) conditioned on selfish/otherish behavior. Data from the PSID.
Figure 5. Distribution of responses to which category tends to have the best relationships; the highest psychological well-being; the best physical health; the highest number of children; and the highest income. Error bars indicate 95% confidence intervals.