ANALYSIS OF FUTURE SCENARIOS
FOR ELECTRIC VEHICLE ADOPTION
IN SWEDEN
A case study
KATHARINA ROSSBACH
School of Business, Society and Engineering Course: Master thesis
Code: ERA400
Topic: Energy technics Credits: 30 hp
Program: Sustainable energy systems
Supervisor: Javier Campillo Examinator: Iana Vassileva
Comissioner: School of business, society and engineering, MDH
Datum: 2015-05-31 E-post:
i
ABSTRACT
Transportation is one of the areas where Sweden could not yet manage to reduce the CO2 emissions. One solution that has been suggested to reduce the CO2 emissions in this sector is through the mass adoption of electric vehicles (EVs). However, mass EV adoption brings complications with it. Drivers behavior is a critical aspect since people often charge their car at home after work. This could negatively affect the evening load peak and thus cause a high impact on the electricity system. A survey was sent out to current private EV owners in Sweden, to learn about their charging schedules, driving patterns and battery capacity. 226 of 403 replied to the survey which gave a survey reply rate of 56 %.
The goal of this work was to estimate the future adoption of EVs, based on the current trends and national targets in order to develop different scenarios. With the scenarios in mind, the projected consumption of EVs for different periods of the day, the magnitude and time of the peak load as well as the overall consumption and CO2 reduction per year were calculated. Three scenarios were analyzed with 96 000, 650 000 and 1 000 000 electric vehicles where 25 % are defined to be running entirely on electricity in the middle and high penetration scenario since even plug-in hybrid electric vehicles, PHEV where included. The scenarios are estimated as the possible situation in 2030 and a simulation is done in MATLAB for summer and winter cases as well as weekdays and weekends. Results showed that the charging pattern of the EV drivers would cause a peak load at around 20.00 where the peak load from the overall household consumptions also takes place. The highest consumption takes place during the weekend cases but there were no significant difference between summer and winter. For example the peak consumption of the EVs was 150 MWh during winter and weekends at 20.00. The annual consumption of the EVs would be 238 GWh, 342 GWh and 616 GWh for the low, middle and high penetration scenario. By analyzing the current
installed power of renewable energy sources in Sweden, it was found that the demand for EVs could be met by renewables entirely today. It was also found that using EVs instead of
conventional fossil fueled cars can save up to 264 Mton CO2 for the low penetration scenario, 447 Mton for the middle penetration scenario and 688 Mton for the high penetration
scenario.
Different assumptions could have caused deviation from the actual result and it was found during the implementation of the simulation that the survey questions could be improved for future surveys. It was concluded that mass adoption of EVs is possible in terms of electricity production and installed power. However, increase in the evening peak led to the conclusion that balancing of the grid is necessary for example through Vehicle-to-grid (V2G), controlled charging or energy storage.
Keywords: MATLAB, electricity consumption, EV, CO2 emissions, simulation, 2030, Scenario, penetration level
iii
PREFACE
I want to thank all the people who responded to the survey, without them this work would not have been possible. Also I want to thank my supervisor Javier Campillo for all of his support and patience. Also I want to show my gratitude to my examiner Iana Vassileva because she gave me strength by believing in me. At last I want to thank my family because their support throughout my whole life gave me the possibility to come this far and showing me that I can accomplish everything.
iv
SUMMARY
Sweden is an innovative country, supports renewable energy sources and CO2 saving technologies. However, one important sector where Sweden has not been able to meet their goals of CO2 reduction is the transportation sector and there is a large potential for reducing emissions in this sector; for instance, electric vehicles (EVs) pollute 4 g CO2/km while an conventional one emits about 144 g CO2/km. Nevertheless, large penetration of EVs is not an easy task. There have been several reports that forecast the number of EVs in the future with different requirements, mostly policies and incentives. The big question becomes if a lot of people purchase EVs, would it be possible to integrate those new vehicles with the existing infrastructure? Part of the problem is the use pattern of EV owners. Already today there are high peaks at the evening when people come home from work and use all their appliances and lightning; if EVs will be charged at the same time, this peak will be even higher. Can the Swedish power production meet that increasing demand?
In order to determine the charging patterns and other factors from EV owners, a survey was send to 403 private EV owners asking questions about their driving patterns, charging patterns and battery capacity etc. This was possible thanks to the Transport Directory Chamber (“Transportregisteravdelingen”) at the Swedish transport board
(“Transportstyrelse”) who gave access to the addresses of private EV owners. A difference is made between charging patterns during the week and weekend. 226 responses were received so that the response rate is 56 %. Three scenarios are defined with 96 000, 650 000 and 1 000 000 EVs and PHEVs in 2030. The information from the surveys is used to build a simulation model in MATLAB where the total daily load curve, the annual consumption and the CO2 emission reduction are estimated. It is even considered that during summer, 18 % more energy is withdrawn from the batteries than during summer. The constant current- constant voltage charging method is used to determine the power needed for charging the battery and it is assumed that the batteries are charged until they are full or until the chosen period is over.
Simulation results showed that in all cases week/weekend, summer/winter the highest consumption occurs at around 20.00 matching the nightly consumption peak from a typical household. Also, it was found that the peak consumption is not significantly changing from case to case. The lowest consumption occurred during the summer/week case and the highest during the winter/weekend case. Together with the household consumption, the weekend cases have a higher peak than the week cases but there were no significant difference between summer and winter. When the consumption was compared to the renewable power available it is found that in all three scenarios the demand could be met by renewable energy sources. Only solar power is not contributing significantly to the production for EVs electricity demand. In the future the share in renewables is forecasted to be even greater. The total annual consumption of 238 GWh, 342 GWh and 616 GWh could all be met by the 7 TWh production from wind power according to the Swedish Energy Agency which according to the report of road map Sweden will be available for the demand of EVs. Additionally, in terms of CO2 reductions, simulation results showed that EVs would reduce the CO2 emissions with
v
264 Mton in the low penetration scenario, 447 Mton in the middle penetration scenario and 688 Mton in the high penetration scenario.
According to the result from this work, large EV adoption is possible and even if only battery- EVs are used. Nevertheless, concerns are expressed regarding the consideration of plug-in hybrid electric vehicles, PHEV. The recharging behavior of EV drivers was found to be higher during evening hours, and therefore, it would affect the daily peak demand, however, if a large number of EVs get charged around the same time, increased peak power, can affect the performance of the distribution grids.
Different assumptions were made for this simulation, which affect the accuracy of the result. Also, the survey questions could be improved in the future (e.g. more detailed questions), in order to minimize uncertainties.
The suggestion for further work would be to decrease the number of assumptions in this work, consider PHEVs and look further into the influence on the local electricity networks.
CONTENT
1 INTRODUCTION ...1 1.1 Purpose ... 3 1.2 Researchquestions ... 3 1.3 Delimitation ... 4 1.4 Outline ... 4 2 METHOD ...4 3 LITTERTURE STUDY ...5 3.1 History ... 5 3.2 System description ... 7 3.2.1 Batteries... 8 3.2.1.1. Lithium-ion battery...8 3.2.1.2. Lead-acid battery ...9 3.2.1.3. NiMH battery ...9 3.2.1.4. Flow Battery ...9 3.2.2 Safety ...10 3.2.3 Charging technologies ...10 3.2.3.1. Battery swap ... 113.2.3.2. Fast and slow charger ... 11
3.2.3.1. Inductive charging ... 13
3.3 Successful adoptions ...14
3.4 Similar studies ...15
3.4.1 Driver and barriers ...16
4 SCENARIOS ... 18
4.1 High penetration scenario ...18
4.2 Middle penetration scenario ...20
4.3 Business as usual- low penetration scenario...20
4.4 Household consumption ...21
5 CURRENT STUDY ... 23
6 RESULTS ... 28
6.2 Simulation Results ...31
7 DISCUSSION... 37
8 CONCLUSION ... 39
9 OUTLOOK ... 39
APPENDIX
APPENDIX 1 – Main code
APPENDIX 2 - - Function SOC, VOC, I, P
APPENDIX 3 - Function hours-battery cap and drive range APPENDIX 4 - Function value P(x), VOC(x), SOC(x), I(x) APPENDIX 5 - Function CO2
FIGURES- AND TABLES
Figure 4. Number of EVs in Norway from 2008 to 2015 ... 15
Figure 5. EV number development in Sweden from 2012 to 2015. ...21
Figure 6. Forecast of EV number development until 2030. ...21
Figure 7. Average consumption profile, households of scenario in Sweden on weekdays. .... 22
Figure 8. Average consumption profile, households of scenarios in Sweden on holidays/weekend. ... 22
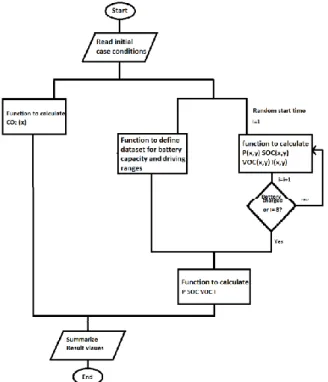
Figure 9. Flow chart of simulation code. ... 27
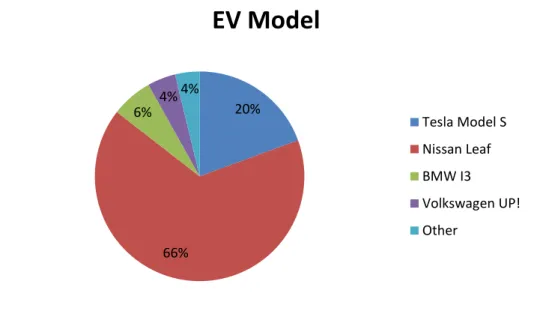
Figure 10. Most common EV models according to survey results. ... 28
Figure 11. Answers to the Daily average driving distance. ... 29
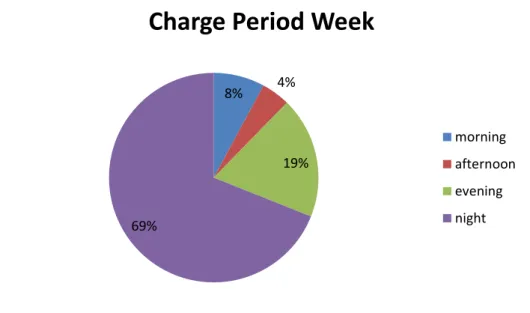
Figure 12. Most usual charging period during weekdays according to survey results. ... 29
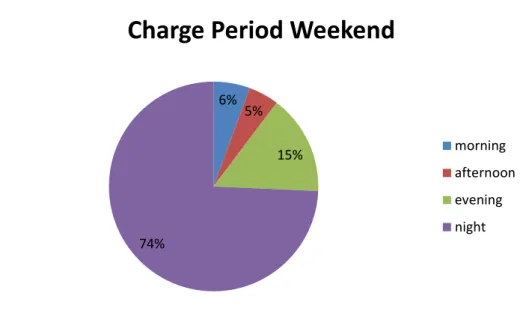
Figure 13. Most usual charging period during weekend according to survey results. ... 30
Figure 14. Most common battery capacity of owners EV according to survey results. ... 30
Figure 15. Answers to the maximum possible driving range of owners EV. ... 31
Figure 16. V/I charging profile of a typical charging period, afternoon period, summer/week case. ... 32
Figure 17. Charging distribution for all scenarios, summer/week case. ... 33
Figure 18. Charging distribution for all scenarios, summer/weekend case. ... 33
Figure 19. Charging distribution for all scenarios, winter/week case... 34
Figure 20. Charging distribution for all scenarios, winter/weekend case. ... 35
Table 1. Regulation measure and introduction year in Norway. ...14
Table 2. Electricity consumption of the most common EV models. ... 23
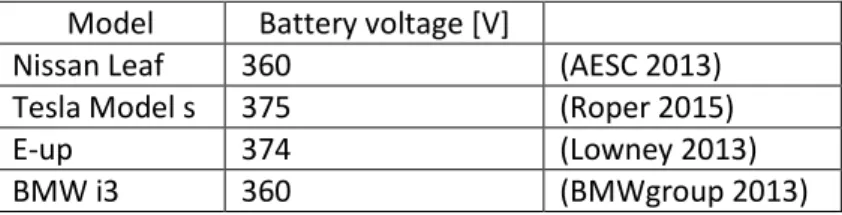
Table 3. Battery voltage of the most common EV models. ... 25
Table 4. Battery/Cut-off voltage of the most common EV models. ... 25
Table 5. Results for the calculation of values needed in the simulation. ... 31
Table 6. Summarized results from simulation. ... 36
NOMENCLATURE
Name Symbol Unit
Energy P Wh
Time t s/h/yearquarters
State of Charge SOC %
Circuit Voltage Voc V
Cell Voltage Vo V
Polarization Voltage K V
Exponential Zone Amplitude A V
Exponential inverse time constant B Ah-1
Nominal battery capacity Qnom Ah
Initial current i0 A
Capacitance C F
Power E W
Current i A
Efficiency η %
Number of cells in series Ncells -
Coefficient of determination R2 -
ABBREVIATIONS
EV Electric Vehicle
ICE Internal Combustion Engine
PHEV Plug-in Hybrid Electric Vehicle
V2G Vehicle-to-Grid
V2H Vehicle-to-Home
V2B Vehicle-to-Building
VAT Value-added taxes
SOC State of Charge
MATLAB Matrix Laboratory
AC Alternating current
DC Direct current
RCD Residual-Current Devise
1
INTRODUCTION
In 2012 the transportation sector was responsible for 33% of all greenhouse gas emissions in Sweden, mainly due to fossil fuel predominance (Trafikverket, 2014). 33 % corresponds to 19 million ton CO2 and the total emission in Sweden in 2012 was 56.26 million ton CO2.
(Naturvårdsverket, 2014). Emissions are not the only negative aspect; oil availability is also decreasing and contributes one of the main triggers for finding alternative fuel sources. According to the IEA (International Energy Agency) the peak oil was already reached in 2006 and in non-oil-producing countries the use of oil has decreased with 15 % since then (Krantz, 2012). All those oil-related concerns have resulted in increasing research and development of environmentally friendly vehicles as electric vehicles (EV), plug-in hybrid electric vehicles (PHEV), Fuel-cell cars or hydrogen, ethanol, biodiesel or natural gas fuelled cars. However, electric vehicles are only more environmentally friendly if the electricity production is environmentally friendly (N-tv, 2014). For instance does electricity for EVs contribute with 6.1 g CO2 /MJ while diesel and gasoline for ICE emission 86.9 g CO2 /MJ respectively 85.6 g CO2 /MJ (Östborn et al, 2013). The emissions for electricity from solar, hydro or wind occurs mostly during the construction of the plants (N-tv, 2014). In Sweden the total electricity production in 2013 was 149.2 TWh, 61 TWh from hydro power, 63.6 TWh from nuclear power, 9.8 from wind power, 0.035 from solar power and the rest from different heat power (Statistics Sweden, 2014). The greenhouse gas emission free electricity production stands for 90 % of the total electricity production in Sweden which gives Sweden good conditions for the implementation of electric vehicles (Streeter, 2013). An EV in Sweden would be responsible for 4 g of CO2 emission per kilometer because of the mixture of electricity
production, for Europe that number is 85 g CO2/km and for the average emission of Swedish passenger cars 144 g CO2/km. Every ICE replaced by an EV in the private sector decreases the annual CO2 emission by 2 ton (Stål et al, 2015). But the wish to be environmentally friendly is not big enough to motivate Swedish people to use EVs (Streeter, 2013).
In Norway the purchase of an electric vehicle gives many advantages against the purchase of a fossil fuel driven car. For instance EV drivers can use the bus lane, park in the city without paying and avoid congestion charges when accessing the city. The purchase of an electric vehicle it-self is expensive because of high taxes in Norway. Still 5.2 % of the vehicle purchases in Norway were electric vehicles in 2012 against Sweden where it was 0.13 % (Streeter, 2013). Norway is also taken actions to improve the air quality in Oslo. It has been stated that diesel cars are prohibited in the city at times of high pollution. The impulsion for this decision was that asthmatics should not have to stay at home because of the quality of the air. Stockholm now wants to put through the same decision for the capital of Sweden (Rabe, 2015).The EV market is growing although the market share of electric vehicles remains small compared to the overall market in Europe (Amsterdam Roundtable
Foundation et. al., 2014). There were 3 993 environmentally friendly vehicles in Sweden in 2014, of which 1 208 are fully electric which is an increase of 24 % since the year before (Von
Schulz, 2014). Currently there are not many advantages of driving an electric car in the private sector in Sweden. There is a contribution called “miljöbilspremie” where a person who buys an EV gets a bonus of 40 000 SEK but it is not enough to make an EV a worthy investment since an internal combustion vehicle (ICE) is still cheaper (Goldmann, 2015). Additionally, this bonus is only available for the first registration when the car is bought, meaning that as a secondhand car there is no bonus (Telsa Incitament, 2015). Even when Norway is making big investments to make electric cars attractive, for the Swedish government it is more expensive. Transportation is the only sector where Sweden has not achieved to reduce emissions. There have been plans for charging internal combustion engine vehicle (ICE) drivers for the emissions from their car and in turn reward drivers with less emission. It is a system that has been working in Norway (Goldmann, 2015). EV drivers are free from paying the traffic taxes the first 5 years after registration. When the five years have passed 360 SEK have to be paid for the traffic taxes each year. There are even additional advantages and incentives when using EV or any other environmentally friendly vehicle, as corporate car. The assessment value is reduced to the same value as for a comparable ICE and is then reduced additionally by 40 % though not more than 16 000 SEK (Telsa
Incitamen,t 2015).
There are several factors that influence the development of EVs like, fuel prices, battery prices and emission regulation. It might be easier and a more advantageous for companies to invest in EVs as company cars. Transportation that has fixed driving patterns, subsidies and emission reduction plans make the switch to EVs more advantageous for companies. Moreover, although the price for batteries is decreasing, it still is one factor that affects the purchasing-EV-decision the most, making EVs not completely cost effective yet (Roundtable Foundation et. al., 2014). But the price has decreased 70 % in seven years from 8 699
SEK/kWh to 2 600 SEK/kWh and if it continues like this the battery price in 2020 could be 1 300 SEK/kWh. In that case would EVs be competitive to conventional ICE (Karlberg, 2015 e). If the use of electric vehicles would increase a larger implementation of charging stations will be necessary which would require an upgrade of the current infrastructure. Several different ways of charging an electric vehicle exist on the market right now, battery swapping, induction charging and wired charging. Norway has 1 387 charging stations (Amsterdam Roundtable Foundation et. al., 2014).
One of the user‟s main concerns is the possibility of battery discharge in some locations far from a charging station; the current EV charging infrastructure situation in Sweden does not help solving that concern. In Sweden there are not enough fast charger stations available. The construction of one fast charger station costs around 500 000 SEK (Von Schulz 2014) and with the current electricity price the electricity charged at the charging stations is not enough to finance the construction of the station (Stål et al 2015). In 2014, 32 fast charger stations were installed in Sweden and there are no plans from the government to support the
construction of new ones. In contrast Norway had around 100 fast charger stations installed in 2014 and the plan is to reach 500 fast charging stations by year 2017. This is an investment from the government of 170 million SEK for constructing fast chargers and the example is even followed by other countries like Estonia. According to the acting head chef of the
chargers is not necessary since there are not so many electric cars today in Sweden. Additionally there is a strong believe by the government that the government itself is not responsible for making these investments but the market is. A brief estimation has been made and the result was that around 350 fast chargers are needed to allow EVs to freely move in Sweden. The driving distances increase as soon as more fast chargers are installed even if those are not really used often, indicating that the issue is psychological: people drive further distances because they feel safer when charger stations are in range (Von Schulz, 2014). But not only the EV charging infrastructure must be upgraded; the more people use electric cars the more people will charge their car at home which will increase the afternoon peak of the residential electricity. Due to that, in lower voltage distribution areas the distribution grid would have to be upgraded at high costs (Amsterdam Roundtable Foundation et. al., 2014). In Sweden the use of engine pre-heaters is common but is usually not suited for charging EVs due to the too weak fuse or missing RCD. The advantage is that through the wide spread use of engine pre-heaters the behavior for plugging-in vehicles already exists. In general is the national electric grid is capable of handling a large amount of EVs so that the problem lies with the local grids, where either the components or the cables are upgraded or the loads when EVs are charging are controlled. The Roadmap Sweden report states that a
combination of those two solutions should be implemented. The technology of V2G
contributes to the goal to flatten the peak loads or provide the grid with electricity when it is needed (Stål et al, 2015).
The aim of this thesis is to focus on modeling different scenarios where different EV
penetration levels are studied together with their impact on the electricity distribution. Data from current trends among early EV adopters in Sweden regarding the most common
charging patterns and methods; EV battery capacity; and driving ranges; has been used in the different scenarios.
1.1
Purpose
The goal is to evaluate the potential of large adoption of EVs in Sweden while identifying eventual peak demands and the reduction in CO2 emissions.
1.2
Researchquestions
Can the Swedish power production meet the demand for large penetration of EVs? Would the reduction in emission be significant?
1.3
Delimitation
This work will only include implementation of EVs in the private sector and not public transportation or truck technology. Only pure electric vehicles are analyzed. Also the calculations are done with formulas describing the current state of the art. For the
calculations on the batteries the cycling numbers and temperature differences are neglected.
1.4
Outline
After describing the methodology used in this work a literature study will follow. In the following chapter the scenarios are presented and in the chapter “current study” the simulation model will be explained followed by the results from the simulation. In the discussion chapter reasons for possible errors in the result are discussed as well as theories explaining the results. In the next chapter the conclusions are explained and last an outlook for further studies is made.
2
METHOD
After research carried out regarding technology and market, different scenarios are created for the situation of EVs in Sweden. A survey was sent out to private EV owners and evaluated through summarizing the responses in order to learn about the usual driving and charging patterns and other aspects to the ownership of EVs like for example battery capacity and possible driving distance. By that any trends in the population of Sweden can be discovered. The scenarios are created from existing reports like roadmap Sweden and own estimations. A simulation model was built in MATLAB to estimate how the Swedish electricity grid can manage the change in the different scenarios. Functions are used to make the code more efficient and the constant current- constant voltage method is used to estimate the power withdrawn from the grid. The emissions are estimated with the help of the daily average driving range and are summarized for one year. The result from the simulations is analyzed and summarized in Excel. For the literature study books are the primary source for
background information, while other reports from databases like ScienceDirect provided information about earlier studies and for the current state of technology and political influence articles from for example NyTeknik or TechnologyReview are used.
3
LITTERTURE STUDY
The following chapter is a depression in the EV history, technology development and previous work similar to the current work.
3.1
History
The history of the electric car starts with the invention of batteries in 1800 when Alessandro Volta from Italy succeeded to store electrical energy by putting a zinc and copper plate in saltwater and separate the two plates with pasteboard. The next milestone was in 1821 when Michael Faraday demonstrated the principle of an electric motor and ten years later he discovered electromagnetic induction. In the following years several prototypes of operating motors were demonstrated. Reports exist from 1835 where Professor Stratingh from Holland presents a small model car. Between 1834 and 1836 Thomas Davenport from USA presented an electric road vehicle, in 1837 an electric driven carriage was built by R. Davidson and in 1838 a German named Moritz Jacobi build an electric paddle boat.
The next step towards today‟s cars was the discovery of the lead acid battery used in all conventional cars until today. With this invention from 1859, a Belgian Gaston Planté enabled to charge and discharge a battery repeatedly (Westbrook, 2001).
At the same time as Antonio Pacinotti invented the „ring‟ direct current motor in 1861 he discovered the electromagnetic generator which gave Zenobe Theophile Gramme from Belgium the opportunity to construct the first operating direct current electric motor in 1869. He also was the first who used a steam engine to provide mechanical energy for the
generator. In 1870 the start of the electrical supply industry was initiated when the Siemens brothers build and patented the Double T Iron Armature motor/generator.
The following years several roadworthy vehicles were presented and starting in 1881 the cars worked with lead/acid batteries. The tricycle presented by Professor William Ayrton and John Perry in 1882 used ten acid/lead batteries which gave 1.5 kWh and 20 V. The motor had 0.5 horse power and the vehicle was reported to be able to drive a range of 16 to 40 km at a maximum possible speed of 14 km/h. In the following years several new models were demonstrated some tricycles some four wheelers also in 1885 Carl Benz demonstrated the first running internal combustion engine tricycle. In 1896 a taxi service in New York was started with 12 hansoms and one coupé driving by 44 lead/acid batteries giving 88 V and a range of 48 km (Westbrook, 2001).
From now the high interest brought internal combustion engines into the competition but many electric vehicles were constructed even if electric vehicle never won any trails. The electric vehicles could not compete with the distance ranges of the other candidates.
The demonstrated model of the Frenchman M. A. Darracq in 1897 had regenerative braking (Westbrook, 2001). Regenerative braking means that the vehicle is slowed down by
(Solberg, 2007). In 1899 an electric car build for the purpose of racing by Camille Jenatzy in France won the world speed record with 98 km/h but was beaten three years later by gasoline fueled vehicles. At the beginning of 1900 the interest in electric vehicles was high. The three competitors; internal combustion engine, steam engines and electric engines had an almost equal share of the market at that time. Electric engines were especially popular because of the quietness of the engine and the advantage of escaping hand cranking the engine in order to start. The number of electric vehicles increased and 1900 until 1912 was called the golden age for electric vehicles. But the technology for internal combustion engines developed rapidly. The hand crank was replaced with the self-starter and the silencer was included in the engine to reduce the noise. The big challenge for the electric cars was to increase the driving range and the development of better batteries did also increase the cost of production. Several new cars were constructed with big amounts of batteries which was good for the range and braking but not for the weight of the vehicle. Also in this time Ferdinand Porsche built the first internal combustion and electric engine hybrid.
At this point range problems and the much higher investment cost led to the overtaking of the internal combustion engines. The last electric vehicle was presented in 1921 and after that there was a period of 50 years where electric car more or less disappeared from the market. The environmental aspect of internal combustion engines reawakened the interest in electric cars. The air pollution from the ICE especially in cities led to the construction of several electric cars in order to test their performance. During the 1970‟s many different electric vehicles came on the market but no model was substantial enough and production stopped eventually (Westbrook, 2001).
In the 1980‟s funding of electric vehicles was made possible because the environmental advantages of electric cars was recognized by governments. Up to the 1990‟s many electric vehicle constructions contributed to the development, for instance the ETX-1 demonstrated by Ford and GE had sodium-sulphur batteries, could drive 160 km and the top speed was 96 km/h. Starting in California, USA, the governments put requirements on the car
manufactures to sell a certain percentage of electric cars (Westbrook, 2001).
Starting in 1995 taxes for cars were based on the emission of CO2 and the energy content of the fuel in Sweden. The rule that EV purchasers don‟t have to pay vehicle registration taxes the first five years of the ownership, was also introduced 1995.
Company cars that even are used in private purpose got tax benefits according to the purchase price of the environmentally friendly car since 1999. The assessment value is reduced to the price of an ICE and that rule was developed further in 2002 and 2007. Then a regulation was introduced in 2005 where 50 % of the cars purchased or leased by
government authorities have to be environmentally friendly which was increased to 75 % in 2006 and 85 % in 2007 (Clean Vehicle Europe, 2015 ).
Since 2005 it was defined by law that fuel stations with a certain level of sales must offer renewable fuels. Since 2006 all fuel stations got support if they provide at least one renewable fuel alternative and most stations chose E85 since it was the most affordable alternative.
In 2006 an exempt from congestion charges when entering the center of Stockholm was introduced applied to vehicle use for example biogas, ethanol, electricity, natural gas or hydrogen until 2012. In 2007 a rebate of 10 000 SEK was made available for private purchasers of environmentally friendly vehicles but was closed down May 2008 when the budget was terminated. However, a similar budget was made available in July 2008 until summer 2009 (Clean Vehicle Europe, 2015 ).
In 2008 the Tesla roadster was put on the market and was claimed to be the only existing zero emission car in production at that time (Drori, 2008). The car is reported to have a range of over 320 km (Handy, 2014). In 2011 an EV won for the first time the price for the car of the year (Öresundskraft, 2013) and in the following years many other car manufacturers launch EVs and PHEVs. In 2011 Nissan put their Nissan Leaf on the European market (Nissan, 2015 a), 2012 came the Tesla Model S (Tesla 2012), at the end of 2013 the BMW i3 was launched (Russell, 2013) and in the same year came the VW e-Up (Autozeitung, 2013).
3.2
System description
The essential components in an electric vehicle which distinguishes it from the conventional internal combustion engine vehicles are the battery, a control component, an electric engine and the charger (Johansson, 1986).
The electric motor converts electrical power into mechanical power. The electricity is stored in rechargeable battery packs from where the motor receives the electricity in turn.
There are several different kinds of motors and batteries. Some of those motors are DC-motors and AC-DC-motors and there are even many different types of DC-and AC-DC-motors (Westbrook, 2001). A DC- or direct current motor for instance works in a way where a conductor is placed in a magnetic field. When a current is send into the conductor from an external power source it begins to move and a mechanical force is produced (electrical4u, 2015). The most frequently used AC-motors are induction motors and synchronous motors. The induction motor has the same principle as the DC-motor: a conductor is moving when a current is induced and the conductor is placed in a magnetic field. But the difference is that in the induction motor the current is induced trough electromagnetic induction between the conductor or rotor and the poles of the magnetic field also called stator. Induction motors are a strong alternative to DC-motors because the construction is simpler and the maintenance is lower. Providing the possibility of higher speed, the weight and size still is less (Westbrook, 2001). In a synchronous motor 3 phase electric conductors create a magnetic field if they are positioned at certain angles from each other which lead to a rotating movement of the electric field. If an electromagnet is added the magnet will rotate at the same speed as the magnetic field which gives it the name synchronous (electrical4, 2015).
3.2.1
Batteries
The three main components in a battery are two electrodes; an anode and a cathode, and a separating electrolyte between them. An energy flow between the electrodes is enabled
because of the chemical electrolyte. When discharged, electrons are released at the anode and led through the electrolyte to the cathode where the electrons are absorbed (Bates, 2012) Many different materials can be combined in order to create a battery. The performance of the battery is influenced by the amount of deep discharge cycles; the more often a battery is discharged the energy density and maximum power density are reduced. On top of that, the outside temperature can influence the battery‟s performance in a negative way. The useful energy density of gasoline is 2 000 Wh/kg (Westbrook, 2001).
3.2.1.1.
Lithium-ion battery
During the process of discharge the lithium in the anode releases electrons allowing the electricity to be discharged from the battery. The ions travel through a separator to the cathode. The charging process goes vice versa.
Hybrids, plug-in hybrids and cars run entirely on electricity need different kind of batteries. The most frequently used Lithium-ion battery type is the Lithium-nickel-manganese-cobalt-oxide, NMC which means that the cathode would be consisting of the same relation of 30 % nickel, manganese and cobalt. Research about the composition of materials in the cathode is carried out to increase battery performance. The batteries are still the limiting component when considering the cost of producing an electric car and the prices for lithium-ion batteries are not expected to sink more than 20 to 30 %. The material of the cathode is the main cause of high cost. By using a higher amount of nickel in the cathode the price can be lowered but with the result of shorter lifetime and lower security (Trechow, 2015). According to
Westbrook (2001) a Lithium-ion battery has a maximum energy density of 120 to 150 Wh/kg, although Volkswagen has developed such batteries on NMC basis with an energy density of 170 Wh/kg (Trechow, 2015). The Tesla Roadster for example uses Lithium-ion batteries and is claimed to have the highest energy density in the industry. One of those batteries weighs 408 kg and can provide up to 215 kW electrical power (Tesla Motors, 2015). The efficiency of a lithium-ion battery is estimated to be up to 90 % (Löffler, 2008).
Because of its simplicity the Lithium-ion battery can switch fast between charge and
discharge which also leads to a shorter charging time then for lead-acid or NiMH. Also they are 40 % smaller and weigh half as much as NiMH batteries but have still the same energy capacity (Dhamej,a 2002). However, the Lithium used in the batteries is quiet toxic which makes the recycling and handling of those more complex (Westbrook, 2001). Lithium is 100 % recyclable but the investment for the recycling process cost around five times the
production price which often leads to the fact that it is not recycled. But with higher EV production rates the need for Lithium might rise, making the recycling worthwhile. Today there is a lack of infrastructure for the recycling of lithium batteries and one reason could be that the chemistry of batteries are always different and makes the process harder when there is a lack of standardization (Kumar, 2015).
3.2.1.2.
Lead-acid battery
These batteries are the most understood batteries due to a long time of experience. Lead batteries are used as the starter battery in conventional internal combustion engines
(Westbrook 2001). A flooded or wet battery has the necessity of replacing distilled water. On the other hand lifetimes of 20 years or even 40 years have been recorded. Through an electrochemical reaction polarization of the anode and cathode occurs which leads to the charging of the battery. The negative electrode or anode is made of lead while the positive electrode or cathode is made of lead with calcium or antimony. The cathode is on top of that covered in lead oxide, PbO2 or lead sulphate, PbSO4 which creates a large absorption surface for electrons. The electrodes are placed in a bath of sulphuric acid, H2SO4 in combination with distilled water, also called electrolyte. While charging the water in the electrolyte is split through the evolution of oxygen at the positive electrode and hydrogen and the negative electrode this process is also called electrolysis (Dhameja, 2002). Lead acid batteries have an energy density of 35 Wh/kg and a maximum power density of 150 W/kg according to
Westbrook (2001) and an efficiency of ca. 75 % (Löffler, 2008). The energy density and power density is reduced when the battery operates in temperature conditions colder than 10 °C. That is why electric vehicles powered by a lead acid battery might need an extra battery heater and insulation. Because lead acid batteries have been used a long time there already exists a well working recycling system for them (Westbrook, 2001). Valve regulated lead acid battery has a similar design as the flooded lead acid battery but the maintenance is lower because there is no need of refilling distilled water. The efficiency of a VRLA battery can reach up to 95 to 99%. There are two types of VRLA batteries, the absorbed glass mat battery and the gel battery (Dhameja, 2002).
3.2.1.3.
NiMH battery
Nickel-metal hydride batteries have a maximum energy density of 70 Wh/kg and power density of 200 W/kg according to Westbrook (2001).The negative electrode consists of a metal hydride mixture, the positive electrode is made from nickel hydroxide and the
electrolyte is potassium hydroxide. During the charging process the hydrogen is captured in the metal hydride mixture and nickel hydroxide is oxidised to nickel oxyhydroxide. In 1996 an electric car with such a battery scored a one charge distance of around 600 km(373 miles) and is claimed to have a lifetime of five years plus 1 550 possible charge and discharge cycles (Westbrook 2001). A NiMH battery has the disadvantage that it weighs more than double than a lithium-ion battery from a roadster (Tesla Motors, 2015).
3.2.1.4.
Flow Battery
A flow battery is charged by exchanging the electrolyte and is claimed to be a fast and safe way of charging EVs. The energy density of flow batteries is comparable to lead acid batteries and is around 25 Wh/kg. Flow batteries have one disadvantage against Lithium-ion batteries which is the distance range which is over 100 km for Lithium-ion but flow batteries compete with faster charging and lower operating costs. The time for charging of a flow battery driven vehicle is between five to six minutes. In the charging process, discharged electrolyte is
pumped from the vehicle while at the same time fully charged electrolyte from the base station is pumped into the vehicle. The discharged electrolyte can then newly be charged at low peak loads or high production when for example there is much solar energy or wind power. In a study of EA Technology, minibuses were tested in urban environment with a flow battery which had an electrolyte with an energy density of 23 Wh/kg. The result gave that the busses reached 30 km before refueling was necessary, the refueling took 5 to 10 minutes and the busses could be operational for 24 hours a day if needed. The conclusion of the study was that EV‟s can compete with diesel fueled vehicles since the technology is cheaper than
conventional batteries, refueling technology is one of a kind, zero emissions and the capability to flatten peak loads. More research in electric fuel technology and weight of the vehicle can provide further ranges (REDT, 2014).
3.2.2
Safety
The biggest safety issue for EV is the impact on the battery during a crash. It is important that the battery doesn‟t break loose or develop any electrical error. In the case of some batteries the leakage of the battery material which often is corrosive must be prevented. An important component for safety could be a fan which provides cooling or in other cases provides heating to avoid that the battery freezes. Another safety issue is the voltage of the battery. At voltages above 50 V contact would result in a serious electric shock. Because of weight issues 500 V is the normal voltage in electric vehicles (Westbrook, 2001). That brings the necessity to insulate all cables and connectors with high care so that there is no possibility of contact with people or contact between cables during a crash. In an emergency the system can shut down and proceed to find the error in the system and for that the chassis is usually isolated from the electric system. High voltage circuits are disconnected when it is needed. Because of the high amount of energy that the battery is charged with there is the possibility of an explosion or fire when this energy is released during an accident. A system must prevent any overheating even in other electronics than the motor. The energy withdrawal from the battery has to be controlled so that in extreme conditions not too much energy is taken for other appliances in the car for example heating. For that an extra battery which is charged by the primary battery is used. The secondary battery operates at 12 V and provides electricity for all the features inside the car and is always fully charged. In some cases solar panels support the charge of the 12 V battery (Westbrook, 2001).
3.2.3
Charging technologies
There are three different levels of charging an electric vehicle in a conventional way. The difference is between the levels of voltage and ampere where the first level has the lowest and the third level has the highest voltage and ampere. Level two has a voltage of 240 V and 40 A (Dhameja, 2002) which is comparable with the conventional plug-in in Sweden (Göteborg Energi AB, 2015); here the charging time would reaches 3 to 8 hours. It is preferred to have a higher level of charging because with a higher voltage and ampere the charging time is reduced significantly. At the third level 480 V and 90 to 250 A charge an EV in minutes. But such equipment must be handled by trained personnel (Dhameja, 2002).
3.2.3.1.
Battery swap
Battery swap means that the empty battery is replaced by a fully charged battery which is demonstrated by Tesla to take less time than filling a gas tank. The swap is supposed to take around 3 minutes and cost somewhat less than a full tank of gas. Tesla is optimistic to be able to reduce the battery swap duration to even less than one minute in the future (Tesla motors team, 2014). Batteries are stored at the swapping station and solar panels help to recharge the discharged batteries. But this technology is not yet proven. One issue with battery swap could be that the battery in the car is the property of the driver and that no one would want to swap their battery with the risk to get a battery which is not in the same good shape. The company Better Place used a system where costumers would own the battery and a minimum capacity was guaranteed. On top of that, competitors like GM and ABB bring other systems to the market. ABB is introducing “flash-charging” for transit buses, GM is developing charging stations for home charging or charging at work (Bullis, 2013).
3.2.3.2.
Fast and slow charger
There are two conventional methods to charge an EV. One method is an AC charger which is located on board which can be applied for both fast and slow charging. The other method is a DC charger which is located off-board and is applied for fast charging only. AC chargers are used for charging at home or at work but can also be used in public places and it takes around 8 hours to charge. DC chargers are more expensive to install and are used near the highway and power stations. The charging time is dependent on the type of charger and can take between 15 and 120 minutes. One advantage of fast chargers is that a bigger amount of cars can be charged daily; 10 to 24 vehicles for fast chargers against one or two for slow chargers (Miederna, 2012).
90 % of all charging occurs at home during the night with an ordinary plug or a three-phase plug (Blomhäll, 2013). An ordinary household plug has 230 V and 10 A (Garo, 2015) and takes depending on the battery size around six to ten hours to fully charge an EV (Gjöby 2015) which is defined as slow charging. A three-phase plug has 400 V which decreases the charging time. However, the charging at home is enough for the daily driving demand around 70-80 km with a cost of 0.2-0.3 SEK/km. It is possible to decrease the charging time by installing a higher fuse for example 20 A (Öresundskraft, 2014). Additionally do the
manufacturers and electricity suppliers of EV recommend using a wallbox for charging and they offer individual wallboxes. For example Vattenfall offers a wallbox which is claimed to charge an EV up to ten times faster than an ordinary plug. Wallboxes provide safety while charging with higher current. Furthermore does the wallbox communicate with the EV and turns of the charging process if an error is detected. Vattenfalls wallbox can provide 32 A or 22 kW at three-phase charging and can be used both in and outside. (Vattenfall a, 2015). Several other advantages are found when using a wallbox; for example can one wallbox be used by several people who might live in an apartment building and users identify them self when they want to charge with a keycard. Additionally, it can be overviewed which wallboxes are occupied or free through an app. The most important advantage of wallboxes might be that influence on the load of the local electrical grid can be controlled. Peak loads can be
avoided and charging during low loads occur which can improve the stability of the local grid (Hemnet, 2015). Nevertheless, the charging of EVs at home creates some concerns.
According to the Danish Electrical Safety Authority (“Sikkerhedsstyrelsen”), the charging with 230 V is not recommended. The plugs at home are not rated for keeping a high current for several hours. The risk is that old or worn plugs can overheat and melt. There hasn‟t been any incident in Sweden but in Norway has a charging station started to burn because the grid of the building could not manage the high current. However the risk is decreased if a current of 10 A or less is used but it is recommended to install a wallbox since it can detect errors and turn of the charging process (von Schulz, 2015).
Teslas super charger provides a direct current power of 120 kW and is claimed to charge in around 30 minutes. The flow of electricity is reduced when reaching a high level of battery charge when using this technology. It is explained that this is done due to the topping of cells. In order to balance cell voltage the current is reduced (Tesla 2015 b). On the other hand, it is always recommended to charge up to 80 % of full capacity because it takes longer time to charge the remaining 20 % (Karlberg, 2015 a).
The potential for fast chargers is high because the charging can be combined with other services. Chargers can for instance be installed in parking garages, outside shopping malls, cinemas, restaurants or other commercial places. Any place where parking occurs for a period has potential for charging stations (Miederna, 2012). At Vattenfalls fast charging stations the charge is 3 SEK per minute and a charging card is used for payment sending a bill every 3 month (Vattenfall b 2015). Fortum is also taken paid for the electricity for EVs. This payment system results in a charge of 90 SEK for an 80 % charge and is considered to be high since a full charge would no longer be cheaper than using gasoline. Until not long ago, the charging of EVs at those stations was for free and there are still companies offering this service for free, but in time it will probably disappear. The only electric car manufacturer that promises to always provide free charging is Tesla and they have installed almost 100
operating super chargers in 13 places in Sweden until 2015 (Karlberg 2015 a). Fortum has started a campaign where it costs 2 SEK/minute to charge at their fast chargers. Vattenfall is now forced to follow the example but the price reduction will not be as great as Fortums. However, Fortum owns 21 fast chargers in Sweden of which only 2 have been charging money for the electricity. It was noticed that as soon as the chargers took money the use diminished. In Norway there are 70 chargers and charging has always cost money, on the other hand are there 70 000 EVs in Norway and in Sweden there are only 3 000 EVs (Karlberg, 2015 b). It is argued that not until there are 12 000 EVs in Sweden payment is appropriate especially when only 1 800 of 3 000 EV are suitable for fast charging. Vattenfalls argument for charging 3 SEK/minute at fast charger stations is that they want to keep a high standard of service so that when chargers do not work they can be rapidly fixed. For taxi companies consisting of entirely EVs the price for 10 km becomes 20 SEK. The biggest investor in building fast chargers is Öresundskraft who will build 32, 50 kW fast chargers between Malmö and Stockholm and in Värmland (Karlberg, 2015 c).
Considering charging standards there has already been a decision in 2012 in Sweden that mod 3, type 2 connections are used in all new public charging stations. Until 2017 such connections will be the standard in all of Sweden but even in other countries in Europe and
America. However, this charger combination is able to charge at one phase alternating current, fast three phase alternating current, direct current at home and fast direct current at public chargers. All of these different charging possibilities are going to be integrated in one plug. Asian manufacturers are not included in the plans so that the direct current fast charger called Chademo used in for example Nissan Leaf will still be used. The reason why a new standard was chosen is that EV owners had problems with different kind of cables and it helps the grid when many EVs are charged. On top of that does such a standard simplify the construction and the owning of EVs, reduces complexity of the developing infrastructure and it reduces the costs in general. In the future more technology will be developed and
integrated in both the charger and the EV in order to create more intelligent charging (Karlsberg 2012 y). But since that first decision much has changed, in 2014 the EU-commission decided that a charging system called type 2-charger shell be the standard in Europe. This charger is able to be used with 1-phase, 2-phase and 3-phase AC, DC and a combination of those four. Also part of the decision was to extend the number of chargers so that there will be enough chargers available in cities and their surroundings (Abrahamson, 2014).
3.2.3.1.
Inductive charging
In order to charge the car battery by induction a coil in the bottom of the car respectively in the floor is needed. An alternating magnetic field in the coil in the floor transfers electricity to the coil in the car. BMW has developed a system where a PHEV can be charged in three hours at a rate of 3.6 kW. If the charge can be increased to 7 kW an EV can be charged during one night. BMW claims that their system has an efficiency of 90% and that the components are protected in such a way that the system can be installed both indoors and outdoors. The advantage with inductive charging is that the car only needs to be parked and a button has to be pushed which makes the system easy to use (Szondy 2014).
3.3
Successful adoptions
A little bit less than all USAs EVs and PHEVs drive on the roads of California. The purchase of EVs or PHEVs is reduced in terms of taxes and the state gives discounts of 2 500 $ for EVs and 1 500 $ for PHEVs. Additionally, the state California has put requirements on their car manufacturer to offer a certain percentage of zero-emission vehicles which will be adopted by several other states. The goal is to insure that 15 percent of all light-duty vehicles sold must be electric or fuel-cell powered (Peeples, 2014).
The French government has established a law which says that 10 % of all parking lots for all kind of houses have to be equipped with chargers. Also adapted in France is the model of car pools. In Paris, companies such as Autolib, allows EVs to be rent at one Autolib station and then returned at a different Autolib station. Such initiatives give the opportunity to test EVs and increases the general knowledge and acceptance of EVs. One car from a car pool can replace 5 to 20 private cars depending on what kind of transportation was used before (Stål et al, 2015). Furthermore, France introduced a bonus of 10 000 Euro when purchasing an EV which gives the possibility to obtain an EV for less than 120 000 SEK and to decrease the number of ICE, the French government has increased the fossil fuel taxes with approximately 20 öre. It is hoped that this will help the prestige of EVs and make ICE vehicle less attractive. (Karlberg, 2015 d)
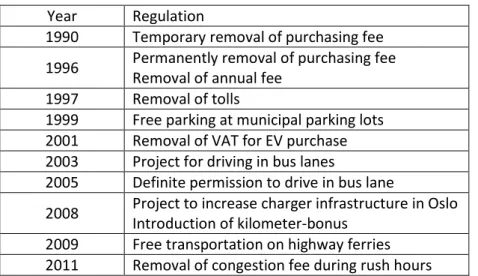
In Norway, already in 1990 the fee when purchasing an EV was removed temporarily which in 1996 was made permanently together with the removal of the annual fee for EVs.
Following, EV drivers were freed from paying tolls in 1997 and from paying parking fees at municipal parking lots in 1999. Additional regulations were introduced in the 21st Century; in 2001 the purchase of an EV was freed from VAT (value-added taxes), a test project was started in 2003 for the use of bus lanes in Oslo. Another project was started in 2008 for developing the number of charging stations in Oslo and a kilometer- bonus for EVs was introduced. In 2009 free transportation of EVs on highway ferries was added and in 2011 EV drivers were freed from congestion charges during rush hours. Table 1 shows the different regulations together with their introduction year.
Table 1. Regulation measure and introduction year in Norway. Year Regulation
1990 Temporary removal of purchasing fee 1996 Permanently removal of purchasing fee
Removal of annual fee 1997 Removal of tolls
1999 Free parking at municipal parking lots 2001 Removal of VAT for EV purchase 2003 Project for driving in bus lanes
2005 Definite permission to drive in bus lane
2008 Project to increase charger infrastructure in Oslo Introduction of kilometer-bonus
2009 Free transportation on highway ferries 2011 Removal of congestion fee during rush hours
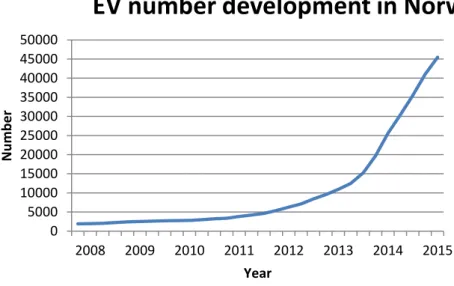
Because of the different incentives and regulations, the number of EVs in Norway has been increasing the past years; especially in 2011 a significant development can be noticed. The number of EVs in Norway during the years is shown in Figure 4: until 2011 the number of EVs was low but starts to increase more after that. In the third quarter of 2013 the rate of change increases additionally until the number of EVs reaches 45 481 in February 2015 (elbil.no, 2015).
Figure 1. Number of EVs in Norway from 2008 to 2015
3.4
Similar studies
In Bertling et al (2010) several different projects for electric vehicles and plug in hybrid electric vehicles (PHEVs) are described. The projects have different aims, some are focusing on the number of charging stations, the number of EVs and PHEVs, grid effect,
standardization, development of EVs and such things as V2G(vehicle-to-grid). The overall conclusion was that regulation is necessary in order to avoid increasing afternoon peak loads otherwise charging would appear around the same time range in all areas. That would impede the capability of a large number of EVs. Bertling et al (2010) found that the cable capacity of the 10 kW grid is another factor that influences the growth of EVs (Bertling et al, 2010).
In the study of Hedegard et al (2012) four scenarios are analyzed for 2015, 2020, 2025 and 2030. The shares of electric vehicles in the scenarios are 2.5 %, 15 %, 34 % and 53 % respectively. The study is done for the northern European countries Sweden, Denmark, Norway, Finland and Germany and the goal is to identify how the adoption of EV‟s would affect power system operation and investment. High battery cost, long charging time and driving range which is even decreased because of air conditioning or heating when it is very hot or cold outside decrease the popularity of EVs. In order to enable EV adoption, economic
0 5000 10000 15000 20000 25000 30000 35000 40000 45000 50000 2008 2009 2010 2011 2012 2013 2014 2015 Nu m b er Year
incentives by national and local governments have to be made and charging infrastructure must be upgraded. The scenarios are based on the Electric Power Research institute (EPRI) and the International Energy Agency (IEA). Intelligent charging/discharging patterns and transport habits from national investigations are applied and socio-economic optimization is used to investigate which power generation technology is appropriate to meet the demand caused by EVs while taxes, tariffs or subsidies are absence. Additionally, the influence on CO2 emissions and cost are evaluated.
Hedegard et al (2012) built a model in the simulation program Balmore to investigate the integrated power and road transport system. Development in district heating is taken into account and different scenarios are compared. The result showed that the investment in wind power could meet the demand of large EV adoption the best way. Coal based electricity production responses for the most electricity for EVs in the nearer future while wind power is dominating the shares up to 2030. The CO2 emission reduction in the first period is not significant while later the reduction increases significantly which is due to the increased share of wind power and number of EVs. The large adoption of EVs results in an increase of total system costs and the power system is influenced by fuel and CO2 prices (Hedegaard et al, 2012).
In another study the case of Stockholm is analyzed at niche, regime and landscape level, through interviews with actors from the EV business. The work is socio-technical and the goal is to be able to give suggestions on how to improve the situation in Stockholm. The niche level consists of the possibility to learn about and get experience with EVs governmental projects and projects led by distributers or manufacturers. On regime level one issue is how other transportation methods are favored by the government and manufacturers for example ICE. Often the case is that investments are rather made to increase ICE efficiency than developing EVs. The landscape level addresses the lack of incentives and policies which gives a bad signal to potential EV buyers.
The result showed that all levels contribute to the situation in Stockholm but the niche level is the strongest one followed by the regime level and finally the landscape level. It is suggested that policies has to be introduced, signals from the government has to be recognized which support EVs and possibilities for test drives and demonstrations must be available (Nykvist, Nilsson 2014).
3.4.1
Driver and barriers
In a survey from Sustainability Group, 113 people in the USA who work with EVs in
management, engineering, technology or marketing and sales were asked about the drivers and barriers of EVs. Almost 70 % of respondents think that fuel economy is the main driver since EV engines have a higher efficiency and electricity is cheaper than fossil fuels. 13 % chose comfort and only 10 % chose environmental awareness as the most significant driver. Even less people chose love to technology or concern about oil resources. 46 % of the participants stated investment cost as the biggest barrier, 27 % think range anxiety, 21 % concerns about the availability of charging and five percent think charging time is the most important barrier (Slavin, 2015).
In a different study the range anxiety and unusually the resale anxiety were analyzed. The main result of the study showed that in order to make EVs more attractive a business model concerning charging infrastructure must be offered which will lead to less range anxiety. Additionally, it was found that battery leasing or battery swapping is a solution for resale anxiety. The combination of battery swapping, leasing and enhanced charging infrastructure gave the best result in terms of emission savings, profitability and consumer surplus (Lim et al, 2014).
4
SCENARIOS
According to the Swedish Energy Agency by 2030 the electricity production in Sweden is estimated to be as follows: The total production will reach 175 TWh; hydropower will contribute with 68 TWh, nuclear power with 72 TWh, CHP with 8 TWh, electricity from district heating plant with 19 TWh and wind power with 7 TWh. This forecast shows that 25 TWh electricity is to spare and can be exported in that case (Stål et al, 2015).
From 2007 to 2030 the electricity production will increase with 16 TWh which is mostly due to losses in the power plants but even the increase in power. The fossil fuel use will decrease due to high fossil fuel prices, and the use of trash and bio fuel will increase instead. In the forecast of the Swedish Energy Agency the use of coal will stop entirely in Sweden
(Andersson, 2011).The use of electricity will increase to 152 TWh until 2030 mostly because of the increase of energy use from the industry. From the transportation sector the electricity use will increase with 1 TWh while in homes the use of electricity decreases from 150 TWh to 148 TWh. The number of homes increases but at the same time do homes get more efficient and need less energy for heat. The use of electricity will decrease since more homes will use heat pumps instead for direct electric heating. According to the Swedish Energy Agency the use of electricity in households will not increase significantly because the use of electric equipment will increase in the Swedish household at the same time as the appliance become more efficient and need less electricity.
The forecast of The Swedish Energy Agency had some requirements for the feasibility of the report; Development is based on the planned projects by the government and the different goals from both national and EU policy makers (Andersson, 2011).
EVs are even more environmental friendly if the electricity that charges the EVs is produced from renewable energy sources. In Sweden there was 5 425 MW installed wind power in 2014 (Svensk vindenergi, 2015), 16 200 MW installed hydro power (Åhrling-Rundström, 2014), 4 400 MW installed power for electricity from bio fuel (Svebio, 2015) and 23.8 MW solar power in 2012 (Palmblad, Barqi 2013).
All chargeable vehicles are included in the high and middle penetration scenario, which means that PHEVs are included as well. For this thesis only pure electric vehicles are
considered. There are 9367 EVs and PHEVs in Sweden of which 2309 are pure electric which gives a share of 25 % (Elbilsstatistik 2015). This share is used in the middle and hig
penetration scenario.
4.1
High penetration scenario
According to Stål et al (2015) the numbers of vehicles will increase. If the growing rate of vehicles continues as it does now there will be 1.8 billion vehicles in the world until 2030 and it is unlikely that those can be fuelled by fossil fuels.
The key is profitability for all parts involved; manufacturers, distributers and customers. Sweden has the ambition to be leading the global market in terms of EVs by 2030.
Additionally, Sweden wishes to have stopped influencing the environment by 2050 and for that goal many EVs are needed 2030. It is suggested that 1 million EVs and PHEVs are
needed in Sweden by 2030 or that 20 % of all driven kilometers in the private sector is fuelled by electricity which would reduce the greenhouse gas emissions by 90 %. The report says that one million EVs and PHEVs could be powered by wind power since they would consume only 5 TWh if the forecast of the Swedish Energy Agency can be trusted. All measures to
accomplish this goal would result in a reduction of 1 million ton CO2 emission and 330 million liter diesel.
Three main issues are mentioned and the first one is coordinating the government and the industry; create an equal ground for goals, work together to solve issues, build up a resource for knowledge and information and standardization, both national and international. The second aspect is creating collaboration between all organizations, groups and projects because they all have the same goal. And the last aspect is creating a market which makes EVs more attractive. To accomplish their goal different short term measures are suggested for example the investment in Car pools by reducing taxes, abrogate congestions and other advantages like using bus lanes and free parking. Other measures are the opportunity for test drives, investigations in behavior and the demonstration of EVs and PHEVs. The physical settings must be appropriate in order to be able to test the products and the services. In a longer view the use of EVs and PHEVs in the public sector should encourage increasing use of EVs and PHEVs in total and city centers should be made emission free zones, so that only EVs and PHEVs are allowed to pass through.
There are also some concerns explained considering the infrastructure for instance that charging EVs and PHEVs on private property may not encumber the electricity grid. In addition available charging in cities and on long highways, standardization of chargers and subvention for infrastructure upgrades for private owners is necessary.
The time range between 2015 and 2030 is divided into two periods 2016-2020 and 2021-2030. The short term measures would be implemented in the first period until 2020 and the long term measures are implemented between 2021 and 2030.
Three suggestions are made to increase the trust of costumers and to increase the sales; The technology must be easy to test, EVs and PHEVs must be available for test drives, it must be easy to charge the EV or PHEVs at home and on the road, services must be provided when needed and it must be easy to buy and own an EV or PHEV. One aspect mentioned is that the range anxiety is decreased with experience, as soon as using an EV or PHEV the anxiety decreases and is not greater than the anxiety of reaching a fuel station in time with a
conventional ICE vehicle (Stål et al, 2015). In Another study, Lewald et al. (2009) suggested two high penetration levels, one with 1 780 000 EV and PHEVs and an extreme scenario with 3 270 000 vehicles. The extreme scenario seems too extreme and for the simulation of this work 1 000 000 EVs and PHEVs are the high penetration scenario.
4.2
Middle penetration scenario
The scenario on the middle high penetration level is taken from the Swedish Energy Agency. The scenario is based on the development of incentives today. The environmental policies keep developing which makes EVs and PHEVs economically competitive on the market but sales and use still occur primarily around cities. If the growth in the support of EVs and PHEVs continues like it has the number of EVs and PHEVs would reach 650 000 until 2030 (Lewald et al. 2009).
4.3
Business as usual- low penetration scenario
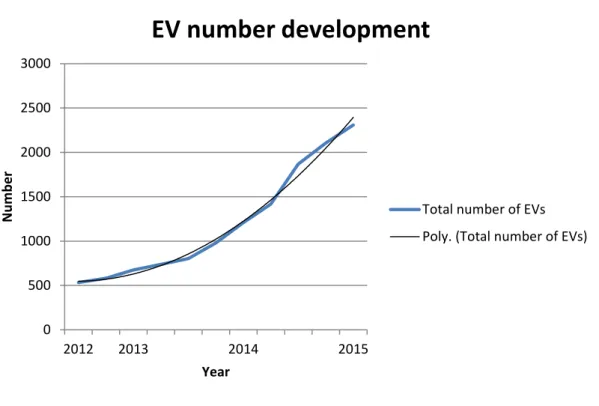
February 2015, 8 668 chargeable cars were registered in Sweden of those 25 % were EVs which has been an increase in environmental cars since a year. A forecast is that until the end of 2015, 14 000 chargeable cars will be driving on Swedish roads. (Power circle AB, 2015) The increase in EV numbers during the previous years has not been significant but if the end of 2012 and February 2015 are compared the increase is as significant as 433 %. Figure 5 presents the development of EV numbers in Sweden during the past few years. The blue line indicates the number of EVs and the black line is the polynomial trendline. The trendline is an approximation of how the change in EV numbers can be expressed in a polynomial equation of second degree created in Excel. The polynomial trendline has the equation:
[eq. 1]
Where
N is the number of EVs and
t is the time in quarters of years
the coefficient of determination is R²=0,991.
The time is represented by years that are divided into quarters, beginning at the third quarter of 2012. With this polynomial expression the number of EVs can be calculated for future years but those numbers are roughly a guess of the real number if the change rate continues the way it has.From the polynomial another graph is gained showing the growth of EV numbers until 2030. Figure 6 shows that graph. It is seen that the number of EVs increase until it reaches 96 545 EVs at the end of 2030.
Figure 2. EV number development in Sweden from 2012 to 2015.
Figure 3. Forecast of EV number development until 2030.
4.4
Household consumption
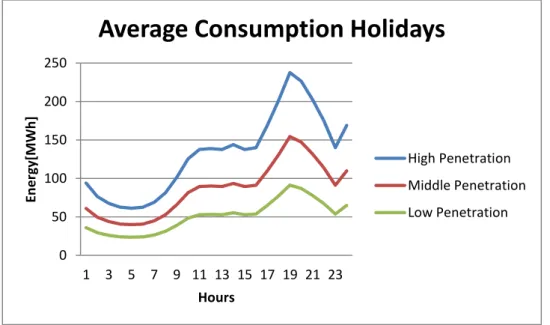
Since the use of electricity in households will not increase significant, the electricity consumption in households today can be applied for 2030. Also the use of direct electric heating will decrease so that the electricity consumption is for houses without direct electric heating. Figure 7 shows the average electricity consumption during weekdays of all
0 500 1000 1500 2000 2500 3000 2012 2013 2014 2015 N u m b e r Year
EV number development
Total number of EVs Poly. (Total number of EVs)
0 20000 40000 60000 80000 100000 120000 20 13 20 14 20 15 20 16 20 17 20 18 20 19 20 20 20 21 20 22 20 23 20 24 20 25 20 26 20 27 20 28 20 29 20 30 N u m b e r Year