THE VALUE OF TIME OF CAR DRIVERS CHOOSING ROUTE:
EVIDENCE FROM THE STOCKHOLM CONGESTION
CHARGING TRIAL
Maria Börjesson WSP Analysis & Strategy maria.borjesson@wspgroup.seAnders Levander WSP Analysis & Strategy
Jonas Eliasson WSP Analysis & Strategy
Centre for Transport Studies, Royal Institute of Technology jonas.eliasson@wspgroup.se
PRELIMINARY DRAFT 2007-09-15
To be presented at the 2007 European Transport Conference, Leiden, Netherlands.
Abstract
A crucial parameter when forecasting route choice in networks with road pricing is the assumed value of time for car drivers. This will determine the extent to which drivers are willing to take detours to avoid being charged. The purpose of this paper is to investigate this question using survey data from the Stockholm congestion charging trial.
The estimation results in this study can be interpreted in two ways, depending on whether charging costs (at face value) of average marginal driving costs are taken as the relevant travel cost measure.
Relative to charging costs, we obtain values of time of 174 kr/h for work trips and 190 kr/h for other trips, and values of distance of 2.19 kr/km for work trips and 2.40 kr/km for other trips. If we instead relate time and charging costs to average marginal driving cost, we get values of time of 127 kr/km for both work trips and other trips. Further, this interpretation means that expenditures for congestion charges are only worth 70% of driving costs. One possible interpretation of this is that 30% of the travellers in this group did not pay the charges out-of-pocket themselves, but had their costs covered by their employers.
With either of the interpretations, drivers’ actual behaviour seem to imply considerably higher values of time for private cars than are typically used in traffic assignment modeling, usually obtained from stated preference studies or mode/destination choice models. This is the same conclusion reached by Lam and Small (2001) and Brownstone et al. (2003), analysing Californian value-priced highways. This could explain that the traffic diversion onto the
1 INTRODUCTION
A crucial parameter when forecasting route choice in networks with road pricing is the assumed value of time for drivers. This will determine the extent to which drivers are willing to take detours to avoid being charged. The purpose of this paper is to investigate this question using survey data from the Stockholm congestion charging trial.
Drivers’ behavioural value of time enters traffic forecasting model in several ways – not always necessarily in a constitent way. Most traffic models are split into a demand model, typically a nested logit model forecasting travel demand per OD-pair and mode. In a second step, this travel demand is assigned to the road and public transit networks. It is the assumed value of time in this second step that is the issue of this study. Obviously, one would ideally want to have consistency between all steps of the model, but this is seldom the case in practical applications for several reasons – some a little better motivated, such as that self-selection bias, other because of model limitations. Investigating the impact of road pricing on mode and destination choice – and in particular the question of whether road pricing somehow affects behavoiur differently than other costs such as ticket fares od fuel prices – is left for future work. When assigning transit trips to the public transit network, the trade-off between travel cost and travel time is seldom an issue for regional trips (although certainly for long-distance train and air trips), so typically, trips will be assigned to the route(s) with least (generalised) travel time (most often weighting waiting time higher than in-vehicle time etc.). Hence, there is no need to assume a value-of-time in the transit assignment step. When assigning car trips to the network, the most common practice is probably to assign trips to the route(s) with the least travel time, hence ignoring that different routes may have different monetary travel costs because of different lengths. If monetary travel cost is ignored during assignment, there is obviously no need to assume a value-of-time for car drivers.
But when modeling the impact of road pricing – a toll road or a congestion charging system, for example – monetary travel cost obviously cannot be ignored during the assignment step. Lacking ex-post revealed preference data, the modeler will typically resort to another source of a value-of-time – say, a stated-preference study conducted on drivers in the area. In many cases, the choice of value-of-time will have a significant effect on forecasted traffic volumes (and hence on forecasted revenues, travel times etc.), especially if there are many OD pairs where there is a choice between a tolled and a non-tolled route.
During the Stockholm congestion charging trial, drivers between the northern part of stockholm and the southern part had the choice to go through the charged area or around it, using the free-of-charge but heavily congested Essinge bypass. Before and during the trial, extensive travel survey were carried out, where (among other things) respondents noted whether they had used the Essinge bypass or not (for applicable trips). This gives an
opportunity to estimate the implicit value of time for car drivers, when facing the choice between a shorter, tolled routed and a longer, free route.
There seems to be few earlier studies of drivers values of time based on revealed preference route choice data, probably due to the relatively few congestion charging systems in use; furthermore, many toll roads are operated by commercial operatos who may not want to publish data or analyses. A notable exception are the two ”value priced” highways in California, where drivers choose between free, congested lanes and a tolled, essentially free-flow lane on the same stretch of highway. Lam and Small (2001) analyse data from one of these highways (the SR-91), and estimate drivers’ value of time and reliability. They arrive at a value of time of 22.87 $/hour, corresponding to 72% of the average wage rate in the sample. This is considerably higher than most value-of-time studies, most of which are based on stated preference data. There are many possible reasons for this, most importantly perhaps that this is a special type of trips and travellers: relatively affluent car owners during the morning commute driving under congested conditions.
Brownstone et al. (2003) analysing choices on another partially tolled (”value priced”) Californian highway (the I-15). They also report high values of time – median willingness-to-pay is around 30 $/hour. The authors note possible upwards bias due to drivers’ perception that the toll facility provides safer driving conditions.
2 THE STOCKHOLM TRIAL
The so-called Stockholm trial consisted of two parts: a congestion charging scheme that was in place between 3 Jan and 31 July 2006, and an extension of the public transport supply that was in place between 31 August 2005 and 31 December 2006.
Initially, the trial was meant to consist only of a congestion charging scheme, but for mainly political reasons, it was complemented by the extension of public transit. The congestion charging scheme was originally meant to be a ”full-scale trial for several years”, and was a part of an agreement between the Social Democrats, Lefts and Green on the national level following the election in the autumn of 2002. For various reasons – most importantly legal complaints regarding the technology procurement process - the period with congestion charges became considerably shorter than was initially planned. An overview of the effects of the charges can be found in Algers et al. (2007).
The charging system was made up by 18 control points located at Stockholm city entrances and exits. Vehicles were registered automatically by cameras that photograph the number plates. Those vehicles equipped with an electronic onboard unit (transponder) for direct debit payment were also identified through this means.
The cost for passing a control point was SEK 10, 15 or 20 depending on the time of day (see the table). The cost was the same in both directions. The maximum amount payable per vehicle and day was SEK 60. No congestion charge was levied in the evenings or at night nor on Saturdays, Sundays, public holidays or the day before a public holiday. Various exemptions (for e.g. taxis, buses, alternative-fuel cars and for traffic between the island of Lidingö and the rest of the county) meant that about 30% of the passages were free of charge.
There was no opportunity to pay at the control points. More than 60% of the payments were made automatically through transponder/direct debit. The rest were either paid at local shops (7-eleven etc.) or through bank transfers, either direct transfer or using a “virtual shop” on the Internet where you could pay using e.g. a VISA card.
The Stockholm trial consisted of two parts: a congestion charging scheme that was in place between 3 Jan and 31 July 2006, and extended public transport that was in place between 31 August 2005 and 31 December 2006. Initially, the trial was meant to consist only of a congestion charging scheme. Later, it was decided that the charging scheme should be complemented by public transit extensions – several new bus lines, additional capacity on commuter trains and subways, and more park-and-ride facilities.
The congestion charging scheme was originally meant to be a ”full-scale trial for several years”, and was a part of an agreement between the Social Democrats, Lefts and Green on the national level following the election in the autumn of 2002. For various reasons – most importantly legal complaints
regarding the technology procurement process - the period with congestion charges became considerably shorter than was initally planned.
The Stockholm trial was followed by referendums in the City of Stockholm and in about half of the neighbouring municipalities. The referendum in the City of Stockholm ended with a majority for keeping the charges, but adding all votes up, a majority of the voters in the county were against the charges. However, the results could be viewed as a bit skewed, since most of the municipalities where polls showed greater support for the charges did not arrange a referendum at all. The new national government eventually decided that the City of Stockholm was allowed to reintroduce the congestion charges as of August 2007, this time permanently. At the time of writing, preliminary analyses indicate that traffic effects are essentially the same as during the trial. A negotiator appointed by the national government is trying to strike a deal between the municipalities and the county of Stockholm. The deal is meant to produce a ”package” where the charge revenues is used for number of road investments.
2.1 The charging system
The charging system consisted of a cordon around the inner city of Stockholm with time-differentiated charges. The area inside the cordon is around 30 km2.
There were 18 control points located at Stockholm city entrances and exits. Vehicles were registered automatically by cameras that photograph the number plates. Those vehicles equipped with an electronic onboard unit (transponder) for direct debit payment were also identified through this means. There was no opportunity to pay at the control points. More than 60% of the payments were made automatically through transponder/direct debit. The rest were paid retroactively, either at local shops (7-eleven etc.), through bank transfers or using the Internet.
The cost for passing a control point was SEK 10, 15 or 20 depending on the time of day (see the table). The cost was the same in both directions. The maximum amount payable per vehicle and day was SEK 60. No congestion charge was levied in the evenings or at night nor on Saturdays, Sundays, public holidays or the day before a public holiday. Various exemptions (for e.g. taxis, buses, alternative-fuel cars and for traffic between the island of Lidingö and the rest of the county) meant that about 30% of the passages were free of charge.
There was no congestion tax levied on vehicles driving on the E4/E20 (the Essinge bypass) past Stockholm (the green road on the map). This was the only free-of-charge passage between the north and south part of the county. The Essinge bypass was heavily congested even before the charges, so from a pure traffic perspective, there was a strong argument for also charging vehicles on the bypass. The opposition from the surrounding municipalities were so strong, however, that the politicians of the City of Stockholm decided that the Essinge bypass should be free of charge.
The choice between using the non-charged Essinge bypass or going through the city center (where, during the trial, congestion was low) is the main focus of this study.
3 THE
DATA
Two travel surveys were carried out, one before the charges were introduced (in September 2004) and one once the charges were in place (in March 2006). For applicable trips, respondents were asked whether they used the Essinge bypass or not. Hence, we can use the surveys to estimate the value-of-time for those drivers going between the north part of Stockholm county and the southern part. Below is a map of the Stockholm area, showing approximate changes in traffic flows (in absolute numbers) during the trial. There are no other bridges connecting southern and northern Stockholm except the Essinge bypass and the four bridges in the city centre, inside the cordon.
The data material consists of 2274 trips between the northern and southern part of Stockholm, and which hence had the choice to go through city centre or use th Essinge bypass. Not all of these trips would be charged, though, even if they went through the city centre: some of them were made during 2004 (before the charges), or outside charging hours (6.30-18.30) or exempted from the charge for various reasons. These non-charged trips were still used for estimation, however, since they still contain information regarding the trade-off between distance (and hence fuel cost etc.) and travel time. As shown in the table below, only 7% of the trips in the data material were charged: the rest were not charged for various reasons - choosing the Essinge bypass, exempt from charges or the trip being made in 2004.
Share of all trips Share of charged trips only charged 7% men 62% 66% < 25 years 4% 25-39 years 27% 32% 40-64 years 58% 52% >64 years 11% Work trips 42% 46% Other trips 58% 54% Approximate charging cordon Essinge bypass
That the congestion charge affected route choice is fairly evident from the followign table, comparing route choices for would-be charged and those trips that would not have been charged (for the reasons stated):
Work trips Other trips
Non-charged choice situation Charged choice situation Non-charged choice situation Charged choice situation 331 69 625 82 Through the city centre 43 % 21 % 53 % 22 % 426 253 522 281 Essinge bypass 56 % 78 % 44 % 76 %
The table shows that for those trips that would not have paid the charge (the ”non-charged choice situations”), 43% of work trips and 53% of other trips went through the city centre. This can be compared to those trips that would pay the charge if they went through the centre: the corresponding shares drop to 21% and 22%. In other words, around half of the (remaining) ”through” traffic in the city centre moved to the Essinge bypass. (Note that some of the ”through” traffic disappeared to other destinations or modes once the charge was introduced, and that ”through” traffic is a comparatively small share of total traffic in the city centre. Note also that this is only private trips; around 20-30% of the relevant traffic is distribution traffic, which is not included in the survey.)
Travel times were calculated using the static network equilibrium model EMME/2, with the volume-delay functions developed especially for Stockholm (the ”TU71 functions”). In heavily congested situations, this will often tend to underestimate travel times since this kind of model cannot account for blocking of links due to backward propagation of queues. Furthermore, only three periods of the day are modelled: morning peak, afternoon peak and the rest of the day.
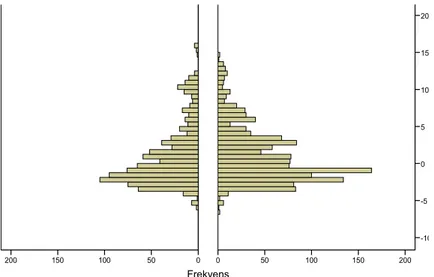
The diagram below shows the loss of time (in minutes) when choosing the Essinge bypass instead of going through the city centre. Obviously, the bypass will be the faster alternative for many trips (shown as a negative number in the diagram)
Frekvens 200 150 100 50 0 20 15 10 5 0 -5 -10 200 150 100 50 0
Figure 1. Difference in travel time Essinge bypass – city centre (minutes). Bars show number of trips. Work trips left, other trips right.
With the charges, travel times through the city centre dropped significantly, while travel times on the Essinge bypass increased somewhat. The diagram below shows how the differences in travel times changed by the charges (only trips during charged hours are included).
Frekvens 125 100 75 50 25 0 20 15 10 5 0 -5 -10 125 100 75 50 25 0 2006 2004 Vardagar 06:30-18.30
Figure 2. Difference in travel time Essinge bypass – city centre (minutes). Bars show number of trips. 2004 left, 2006 right.
4 ESTIMATION
RESULTS
4.1 Distance, travel time and charging costs
The first estimated model had the following specification:
where α, β and γ are parameters to be estimated, i denotes the two alternative routes (across the cordon or on the Essinge bypass) and εi are error terms, assumed to be independently Gumbel distributed.
Estimation results are shown below.
Work trips Other trips
Observations 928 1289
Log-Likelihood -479.8 -701.8
Rho²(0) 0.255 0.215
Rho²(c) 0.221 0.216
Travel time (β) [min] -0.2638 -0.1990
(-8.1) (-7.1) Cong. charge (γ) [kr] -0.0911 -0.0627 (-12.3) (-12.1) Distance (α) [km] -0.1993 -0.1502 (-5.2) (-5.3) Value of time [kr/h] 173.74 190.43 Value of distance [kr/km] 2.19 2.40 10 kr is approximately 1.11 €.
The value of distance is rather high compared to average marginal cost for car trips, which is around 1.6 kr/km (0.18 €/km)1. On the other hand, it corresponds well to the average total cost for car trips, i.e. including capital costs, depreciation and fixed insurance costs; this cost is around 2.6 kr/km (0.29 €/km).
The values of travel time (19.30 €/h for work trips and 21.15 €/h for other trips, but the difference is not significant) are higher than what is generally encountered in stated preference studies, and also higher than typical values obtained when estimating destination/mode choice models on revealed preference data. For example, the value of in-vehicle time for regional work trips in the national model SAMPERS is 67 kr/h (around 7.45 €/h). A stated preference study of car commuters in the central parts of Stockholm (Eliasson, 2003) estimated a value of time of 58-68 kr/h. Under congested conditions, this value increased by 42-52%. Even more surprising is that the values of time do not differ significantly between work trips and other trips. Note that possible passengers are not accounted for – the average number of persons per car is 1.26 across the cordon, counting all vehicles, not only private cars. If the travel cost can (more or less formally) be spread among people in the car, the actual cost decreases and hence the value of time increases. There is also the possibility that some drivers taking the route through the city centre is dropping passengers of there, without noting this in the travel diary. This will also tend to increase the estimated value of time.
The obtained value of time is similar to the value obtained in the two other similar study we know other, Lam and Small (2001) and Brownstone et al. (2003), who obtain a values of time in the range 23-30 $/h – around 17.90-23.30 €/h. As in these studies, our sample population is a fairly specific type of trips and travellers: relatively affluent travellers and a heavily congested traffic situation. This will tend to increase the value of time.
In the table above, we have calculated values of distance and travel time by dividing the travel time parameter and the distance parameter with the parameter for the congestion charge. That is, we assume that the charge cost is the appropriate ”currency” to use for costs. We get an alternative interpretation of the results if we assume that the average marginal distance cost is the appropriate ”currency”, i.e. if we instead divide the parameter for travel time with the parameter for distance divided by the average marginal running cost (1.6 kr/km or 0.18 €/km). This gives a value of time of 127 kr/h (14 €/h) for both work trips and other trips – still rather high, although more similar to typical estimated private values of time. The ”value” of the charges, on the other hand, drops to around 0.70 kr per ”charge-kr” – i.e., money spent on congestion charges are only ”worth” a little less three-quartes of its face value. If we go for this interpretation, this would be a surprising result – one would rather have expected the opposite, that money spent on congestion charges would be ”worth” more than normaly expenditures due to the higher ”visibility” of the cost and the extra hassle of paying the cost afterwards. On the other hand, similar results have been found before; Hensher (2001), for example, analysing stated preference data, found that the ratio of toll costs to running costs was around 80%.
Neither of these interpretations take into account the effects of some amployerspaying the charges and the extent to which travellers could deduct travel costs. The legal and administrative system surrounding the charges was complicated; the charge could not be deducted2, neither by employed nor companies, but this may have not been clear to everybody. Further, different employers had different rules whether they reimbursed congestion charging costs for employees with company-paid cars. Some employers reimbursed all costs once you had a company-paid car; some employers did not even reimburse costs for business trips.
The interpretation that money spent on congestion charges is only ”worth” around 70% of its face value could then be interpreted as 30% of the (relevant) travellers had their car costs covered by their employers. Unfortunately, we do not have reliable other sources on this figure, so we cannot say if this is correct; however, it seems reasonably plausible.
4.2 Introducing congestion
There is strong evidence from several studies that drivers there are extra costs connected with driving in congested situations, over and above the increase in average travel time. One reason is that travel time variability increases with congestion, and hence a need for extra safety margins and
increased risk of being late. Another reason is that the start-and-stop driving behaviour in queues adds extra disutility compared to driving in free-flow conditions.
Eliasson (2007) estimates a relationship between congestion, travel time and the standard deviation of travel time σ, obtaining a function of the following principal form: 1 0 − ∝ t t t σ
where t is the travel time on the link, t0 is the free-flow travel time and the constant depends on link length, type of road and whether the queue is building up or dissipating. We tried estimating a new model using the expression to the right as a measure of congestion, but results were not credible: the charge parameter γ becomes very small, and the parameter for the congestion expression gets the wrong sign. Congestion was high primarily during periods with high charges (naturally), and especially on the Essinge bypass; hence, the congestion variable seems to be picking up the explanatory power of the congestion charge.
4.3 Replacing model travel times with measurements
Before and during the trial, travel times were measured automatically on the entire Essinge bypass and on many links in and around the city centre. Since there are good reasons to believe that the EMME/2 travel times are not very reliable in heavily congested situations, we replaced EMME/2 link travel times with measured travel times whereever possible, recomputed route travel times and reestimated the first model. Results are shown below.
Worjk trips Other trips
Observations 928 1289
Log-Likelihood -494.2101 -748.7
Rho²(0) 0.2317 0.1624
Rho²(c) 0.1967 0.1586
Travel time (β) [min] -0.1130 -0.0161
(-6,7) (-1,4) Cong. charge (γ) [kr] -0.0642 -0.0585 (-10,7) (-11,3) Distance (α) [km] -0.3443 -0.2669 (-10,3) (-11,1) Value of time [kr/h] 105.61 (16.51) Value of distance [kr/km] 5.36 4.56
The values of time decrease significantly, while the ”values of distance” (which coul be interpreted as running costs) increase. The travel time parameter for other trips is insignificant.
It turns out that this is caused by the travel times on the Essinge bypass now bieng considerably shorter than the modelled travel times. This means that
there are very few drivers who gain time by going through the city centre, which means that the only advantage of going that route (and paying the charge) is that the travel distance is shorter. Hence, the value of distance increases and the value of time decreases. We regard this model as a failure: probably, mixing modelled travel times (which are at least consistent with each other) with measured ones does not work too well for estimation purposes when the share of measured links is comparatively small.
5 CONCLUSIONS
The value of time to use in network assignment models for car traffic often has profound effects on forecasted effects of road pricing schemes, including effects on traffic flows and travel times, and anticipated revenues. Empirical evidence of drivers actual behaviour when faced with the choice between a slow, free road and a faster, charged road is thus important. There seems to be a scarcity of research into this matter. A related, important topic is to what extent drivers value driving distance in their actual behaviour – in other words, whether charging costs and marginal car driving costs affect behaviour in the same way.
The present study deal with private trips only (hence not distribution traffic etc.), and with a fairly particular sample: drivers between the northern and southern part of Stockholm county. This is a relatively affluent sample, and the travel times and distances are fairly long compared to average work trips. The estimation results in this study can be interpreted in two ways, depending on whether charging costs (at face value) of average marginal driving costs are taken as the relevant travel cost measure.
Relative to charging costs, we obtain values of time of 174 kr/h for work trips and 190 kr/h for other trips, and values of distance of 2.19 kr/km for work trips and 2.40 kr/km for other trips. These values of times are higher than the ones typically found in stated preference studis or mode/destination choice models estimated on revealed preference data. However, the difference may perhaps be explained by higher income, the presence of passengers in the car and/or heavy road congestion. The values seem to correspond well with similar studies by Lam and Small (2001) and Brownstone et al. (2003). The values of distance are higher than can be explained by marginal running costs only (fuel, insurance and depreciation related to kilometers driven etc.), but correspond well to total driving costs, i.e. including also capital cost and fixed depreciation costs.
If we instead relate time and charging costs to average marginal driving cost (1.6 kr/km), we get values of time of 127 kr/km for both work trips and other trips. This is still fairly high, but more similar to results from other studies, especially when passengers and congestion traffic conditions are taken into account. Further, we get the interesting result that expenditures for congestion charges are only worth 70% of driving costs. One possible interpretation of this is that 30% of the travellers in this group did not pay the charges
out-of-pocket themselves, but had their costs covered by their employers. Unfortunately, we do not have data to compare this hypothesis with other sources.
With either of the interpretations, drivers’ actual behaviour seem to imply considerably higher values of time for private cars than are typically used in traffic assignment modeling – values generally obtained from (mostly) stated preference studies or (sometimes) mode/destination choice models estimated on revealed preference data. This is the same conclusion reached by Lam and Small (2001) and Brownstone et al. (2003), analysing Californian value-priced highways.
This is potentially a very important question, since it will in many cases have large effects on forecasted traffic effects and revenues. Indeed, while the forecasted effects of the Stockholm congestion charges did, on the whole, agree well with actual effects, one notable exception was that the traffic increase on the Essinge bypass was less than half of the forecasted increase – 0-5% (during different months) compared to a forecasted increase of 8-9%. This could very well be explained by the hypothesis that drivers in fact had higher values of time than those used in the forecast, which was taken from stated preference studies.
5.1 Future work
This is a first report of ongoing work. We plan to continue to refine the estimation by including socioeconomic variables (especially wage rates), using more flexible functional specifications and/or error specifications.
6 REFERENCES
Algers, S., Brundell-Freij, K., Eliasson, J., Henriksson, C., Hugosson, M., Hultkrantz, L., Ljungberg, C., Nerhagen, L., Smidfelt-Rosqvist, L. (2007) The effects of the stockholm congestion charging trial 2006: An overview. Forthcoming in
Transportation Research A.
Brownstone, D., Ghosh, A., Golob, T., Kazimi, C., Van Amelsfort, D. (2003) Drivers’ willingness-to-pay to reduce travel time: Evidence from the San Diego I-15 Congestion Pricing Project. Transportation Research A, 37, pp. 373-387.
Eliasson, J. (2004) Car drivers’ valuations of travel time variability, unexpected delays and queue driving. Presented at the ETC, Strasbourg, 2004.
Eliasson, J. (2007a) The relationship between travel time variability and road
congestion. Presented at the WCTR, Berkeley, 2007.
Hensher, D. (2001) The valuation of commuter travel time savings for car drivers: evaluating alternative model specifications. Transportation 28:101–118.
Lam, T. and K. Small (2001) The value of time and reliability: measurement from a value pricing experiment. Transportation Research 37E, 231-251.
Swedish Consumer Agency [Konsumentverket] (2003) Hushållens matkostnader (in Swedish). [Households’ expenditures for food]. Available at www.konsumentverket.se/Documents/PM/PM_2003_25_hushallens_matkostnad er.pdf