School of Innovation, Design and Engineering
Critical factors when implementing Lean
practices and Lean distribution for a micro
company in the start-up phase
Bachelor thesis
15 credits, C-level
Product and process development Production and Logistics
Amanda Ivars & Mathias Lundberg
Tutor (company): Johan Tjernell Tutor (university): Viktorija Badasjane Examiner: San Aziz
ABSTRACT
The aim for this study is to identify the critical factors for an implementation of Lean for a micro company in the start-up phase, as well as to identify which Lean practices that are most applicable for a distribution strategy in a micro company. The aim was divided into two research questions:
• RQ1: Which factors of a Lean implementation is critical for a producing micro company in the start-up phase?
• RQ2: How applicable are lean tools and practices for a micro company’s distribution strategy?
The research approach used to answer the aim and research questions were a literature review and a case study. A solid literature review was performed to understand the subject in a broader context as well as to compensate for the empirical findings. The case study was conducted at a micro company in the construction industry in Sweden, which currently has no distribution strategy. Since there is limited information related to micro companies, the study has been expanded to also include SMEs.
Several factors were identified as critical for an implementation for a micro company. The factors were categorized as critical, favorable, hindering and driving. The identified most relevant critical factors for micro companies was the leadership and management as well as financial capabilities. This was found to be in line with the theoretical framework. Furthermore, an identification was that the Lean tools and practices that were the most applicable for a micro company were those that focus on the internal processes and the involvement of the workforce, such as 5S, PDCA and visual management. These tools were the most applicable because of the financial aspects as well as the lack of influence that a micro company has over its supply chain. It is recommended to perform a similar case study in a micro company with a higher level of maturity and has started their distribution of goods to further analyze tangible empirical data. Lean concerning micro companies need further research if it should become attractive and achievable for micro companies.
Keywords: Lean, Micro Company, Start-up, Distribution Strategy, Implementation of Lean,
ACKNOWLEDGEMENTS
This Bachelor thesis was performed during our Master in Engineering studies in Production and Logistics at Mälardalens University. We have learned so much while working on this thesis, but there is still an incredible amount of knowledge in the area left to learn.
We would like to start by thanking everyone who has participated in this study. First of all, we would like to thank Johan Tjernell at Husmuttern AB, which allowed us to put our knowledge into practice and perform our case study there. Furthermore, we want to thank the interviewees at the case company who took their time to answer our questions. Last of all, Viktorija Badasjane, our supervisor at Mälardalens University, deserves a special thanks for the invaluable tutorials and guidance throughout the study. This study had not succeeded without her help.
_________________________ _________________________
TABLE OF CONTENTS
1 INTRODUCTION ...1
1.1 BACKGROUND ...1
1.2 PROBLEM FORMULATION ...2
1.3 AIM AND RESEARCH QUESTIONS ...3
1.4 PROJECT LIMITATIONS...3 2 RESEARCH METHOD ...4 2.1 RESEARCH APPROACH ...4 2.2 LITERATURE REVIEW ...4 2.3 CASE STUDY ...5 2.4 ANALYSIS ...6 3 THEORETIC FRAMEWORK ...8 3.1 THE LOGISTICS SYSTEM...8 3.2 DISTRIBUTION CHANNELS ...8 3.3 TRANSPORTATION PLANNING ...9
3.4 DELIVERY CUSTOMER SERVICE ELEMENTS ... 10
3.5 COMPANY MATURITY ... 11 3.6 LEAN ... 12 3.7 5S ... 13 3.8 ELIMINATION OF WASTE ... 14 3.9 PDCACYCLE ... 15 3.10 LEVELLED WORKLOAD ... 16 3.11 JUST-IN-TIME ... 17
3.12 IMPLEMENTATION OF JIT PRACTICES ... 17
3.13 IMPLEMENTATION OF LEAN PRACTICES FOR SMES ... 19
3.14 LEAN START-UP ... 22
3.15 LEAN DISTRIBUTION ... 22
3.16 LEAN TRANSPORTATION ... 23
4 COMPANY PRESENTATION ... 25
4.1 BACKGROUND HOUSING CRISIS ... 25
4.2 CASE DESCRIPTION ... 25
5 EMPIRICAL FINDINGS ... 26
5.1 GOAL AND VISION STATEMENT ... 26
5.2 COMPANY CULTURE ... 26
5.3 WORKFORCE AND RECRUITMENT ... 26
5.4 COMMUNICATION AND CHANGES ... 27
5.5 PRODUCING SME ... 28
5.6 EXPANSION ... 29
5.7 DISTRIBUTION STRATEGY ... 29
5.8 SALES AND TRANSPORTATION PARTNERSHIPS ... 30
5.9 LEAN KNOWLEDGE ... 30
6 ANALYSIS ... 32
6.1 LEAN IMPLEMENTATION FOR A PRODUCING MICRO COMPANY IN THE START-UP PHASE ... 32
6.2 LEAN TOOLS AND PRACTICES FOR MICRO COMPANY’S DISTRIBUTION STRATEGY ... 36
7 CONCLUSIONS AND RECOMMENDATIONS ... 41
8 REFERENCES ... 43
9 APPENDICES ... 46
9.1 APPENDIX 1-INTERVIEW QUESTIONS ... 46
List of Figures
Figure 1. Delivery methods, modified from Jonsson (2008) ... 10
Figure 2. The PDCA Cycle, modified from Moen and Norman (2006) ... 16
List of Tables Table 1. Methods of how data was identified for non-empirical data collection ... 4
Table 2. Subsystems in the logistics system, according to Jonsson and Mattson (2016) ... 8
Table 3. Service elements, modified from Segerstedt (2009) and Jonsson (2008) ... 11
Table 4. The four phases of the Deming Wheel, according to Moen and Norman (2006) ... 15
Table 5. Core practices related to JIT, modified from Nakamura et.al. (1998) ... 17
Table 6. Themes and factors for a Lean implementation for micro companies in the start-up phase ... 32
ABBREVIATIONS
TPS Toyota Production System
JIT Just-In-Time
SME Small and medium-sized enterprise
1
1 INTRODUCTION
This chapter is introduced with the Background of this study, which opens to Problem Formulation, as well as the Aim and Research Questions and Project limitations.
1.1 Background
Distribution can be defined as the steps it takes to move, manage and store a product from supplier to customer in a supply chain. It includes all steps from raw material and components from suppliers to producers, as well as finished products that are moved from producers to the end customer (Chopra & Meindl, 2013). The distribution structure is an important factor for overall profitability as it directly affects costs within the supply chain and customer value. For a company to be able to maintain a high delivery service, it is important to keep short and safe delivery time to the customer, which is affected by choice of distribution method. Organizations' strategies for distributing their products are crucial to their competitiveness and profitability (Jonsson & Mattsson, 2016).
The Lean approach is another way for companies to constantly improve and maintain competitiveness. According to Liker (2004), Lean production is a production system originating from Toyota Production System (TPS) where the main focus is identifying and eliminating waste through tools such as Just-In-Time (JIT), Kanban, Total Quality Management, 5S, Value Stream Mapping, Kaizen, one-piece flow etc. Only using these tools will not result in a transformed business, since the success of Lean lies in the philosophy grounded in the understanding of humans and their motivation. Succeeding with Lean relies on the organization´s capability to become a constantly improving organization that keeps on learning. Lean production is defined as a process in five steps: identifying what value is for the customer, see how value streams through the organization, creating a flow of value, using a pull system, and work towards excellence (Liker, 2004).
Due to the ever-growing demand for high-quality products, Lean production has been the production system that has often been implemented. Large companies that had implemented Lean production consequently affected Small and medium-sized enterprises (SME) and left them with no other choice than to also implement Lean production (Rose, Deros, & Rahman, 2011). The European Commission has listed the main factors of whether a company is a SME according to either the staff headcount, turnover or balance sheet total. A company with less than ten employees is considered a micro company (European Commission, 2019). It has been documented that Lean production has been successfully implemented in large companies, in contrast, there have been few documented cases of successful implementation in SMEs (Rose, Deros, & Rahman, 2011). SMEs have a significantly lower level of knowledge and uptake of Lean production, resulting in SMEs being unfamiliar with the methods for implementation of Lean successfully. The majority of prior research regarding Lean production implementation has focused on large companies, which has created a gap in the research for SMEs (Hu, Mason, Williams, & Found, 2015).
With an increasingly globalized world, the competition is constantly growing for producing organizations. Globalization has opened the various markets for global organizations that offer a lower cost for products that challenge the regional enterprises (Rose, Deros, & Rahman, 2011). Due to globalization, the amount of organizations has increased, and due to modern technology, organizations can supply their products all over the world. With a large number of suppliers to choose from, the customer has several choices and can, therefore, seek out the most valuable
2 supplier when choosing products and services. Because of the competitiveness, the supplier has to improve continuously and to utilize the available resources effectively to become a competitive organization (Hu, Mason, Williams, & Found, 2015). One significant consequence of globalization is that supply chains are becoming more international and complex. More complex distribution structures, including logistics networks and activities, leads to organizations placing greater focus on logistical aspects (Creazza, Dallari, & Melacini, 2010). According to Waller and Fawcett (2012) logistical costs such as transportation can be vastly complex and requires careful evaluations and sometimes, to measure the cost it requires, skilled and costly labor. Logistics costs and delivery service are two important aspects of the functions of the logistics system, which must be coordinated to satisfy customer needs. But another aspect that has become increasingly important in recent decades is the environment. Customers' demand has increased for more environmentally friendly products that have been produced more sustainably. There is a lot to be gained by the early inclusion of the customer to capture what is requested. Within the logistics area, there is much to be done here (Björklund, 2018). Customer behavior has changed, and people today are willing to pay more for products with high environmental quality that benefits the environment (Zhang, Wang, & You, 2015).
The construction industry is one of the slowest industries to recognize the importance of logistics, even with proven financial benefits. Because of the slow adaptation of logistics in the construction industry, the opportunities for improvement and change are vast. Of total construction costs, 10 to 20 percent are estimated to be connected to transportation costs. Even if a fifth of the total cost of construction is connected to transportation, little attention has been given to the transportation method, resulting in waste and increased costs (Gary, Barthorpe, & Robbins, 2010).
According to Agapiou et al. (1998), supplying building materials and components to the building site is likely to be related to obstacles. This can have a significant effect on productivity levels. A critical productivity-related aspect of material delivery to the construction site requires that a carefully developed system for monitoring and control is introduced as early as possible. If the building process is planned from a logistics perspective, major productivity gains can be made.
1.2 Problem formulation
The organization´s choice of distribution of its products and choice of distribution structures is often crucial for its competitiveness and profitability. The goal is to make products available on the market in a cost-effective manner. The method for how the organization distributes also has great significance for the ability to maintain a high delivery service through short and secure deliveries to the customer. The chance for what is operatively possible to achieve is determined by these strategies and how the distribution system is designed. When maintaining the distribution structure, it is also critical that it complies with the organization´s strategies and sub-goals (Jonsson & Mattsson, 2016). Choosing a strategy is about choosing the focus, that is, choosing what should and should not be done, but creating clear guidelines and goals is not always simple for companies when they must consider different aspects (Ljungberg & Larsson, 2012).
There is a gap in prior research regarding the implementation of distribution strategies as well as Lean practices within micro companies (and SMEs). The need to investigate what is important when implementing a distribution strategy using Lean practices is therefore worth investigating.
3
1.3 Aim and Research questions
The aim for this study is to identify the critical factors for an implementation of Lean for a micro company in the start-up phase as well as to identify which Lean practices are most applicable for a distribution strategy in a micro company.
RQ1: Which factors of a Lean implementation is critical for a producing micro company in the start-up phase?
RQ2: How applicable are lean tools and practices for a micro company’s distribution strategy?
1.4 Project limitations
The case study was conducted at a micro company in the construction industry in Sweden, which currently has no distribution strategy. Since there is a gap in previous research related to micro companies, the study has been expanded to also include SMEs. The distribution structure includes everything from raw materials to the finished product has been delivered to the end customer, but this study's focus on the distribution strategy is in the final stage,from the finished product delivered to the customer.
4
2 RESEARCH METHOD
This chapter provides information about the method used for the Research approach, how the Literature review and Case study was performed as well as a description of the method for Analysis.
2.1 Research approach
A literature review has been performed for an understanding of a distribution strategy in a broader context. For empirical data collection and for creating an overall picture of the problem, interviews were conducted with key individuals who work at the case company where the case study was performed. Previous thesis projects completed at the chosen case company, related to production and logistics, was studied for an overview knowledge of the case company. The work was iteratively and gradually updated during the process. A preliminary schedule was created at the start of the project in Microsoft Excel where a template for Gantt scheme was used. The timetable was not followed entirely since the work followed an agile approach.
2.2 Literature review
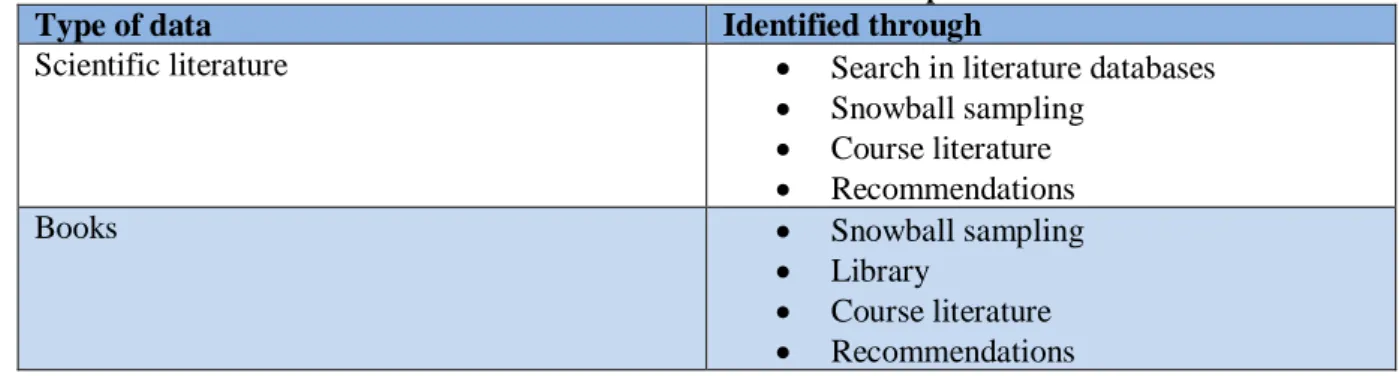
The literature review is one of the most important parts of academic writing as it provides a thorough base of previous knowledge that new research can be founded on (Oliver, 2012). Literature means all forms of published material, such as books, dissertations, journals, conference papers etc. (Blomkvist & Hallin, 2014). A solid literature review was carried out to compensate for the empirical findings because there is no existing distribution strategy at the case company. The search for the theoretical study was mostly performed through databases. Through combinations of keywords, data were identified through searches in scientific database Scopus and Emerald Insight. Other database such as Google Scholar and Diva has also been used to collect data. Snowball sampling is another method that was used, where data were identified through reading the theoretical framework of previous research and deriving their original source, as well as reading the table of contents of previous research. Furthermore, data were collected by searching the Mälardalens University library database Primo, or by searching physical relevant books among the bookshelves. Lastly, material from previous course literature during engineering studies at Mälardalens University and material identified through recommendations of colleagues and mentors. Table 1 below shows the type of data collected and which method it was collected through.
Table 1. Methods of how data was identified for non-empirical data collection
Type of data Identified through
Scientific literature • Search in literature databases • Snowball sampling
• Course literature • Recommendations
Books • Snowball sampling
• Library
• Course literature • Recommendations
A literature review was made to support the thesis with scientific information that was valuable for the study. The literature review also ensures that the thesis will be positioned in a scientific
5 knowledge gap to make the result of the study scientifically valuable. The literature collected was critically analyzed to ensure validity and reliability at a satisfactory level.
2.2.1 Source criticism
A critical approach is required when working with a literature study. Being critical in this context means having a questioning attitude to what is read. Critical thinking is part of the foundation of science. In the academic context, this means explaining, interpreting and striving to understand the deeper meaning of what is to be critically examined. The goal of critical examining is to highlight more fundamental uncertainties in arguments and to deepen the analysis. In the literature study, it is important to be source-critical by ordering the sources and continuously having a reflective writing style. It must be clear that the literature has been carefully read and questioned. In the method section, the critical approach is marked by justifying why the study has been done in a certain way, regarding research design, data collection method and analysis method. An argument is also needed for why the selections are suitable in relation to the purpose of the thesis. The results section should be kept impartial by avoiding appreciative judgments and source-critical thinking by not assuming that the information provided by informants is the given truth. Throughout the thesis, the critical attitude is marked by the fact that it is clear what the comments of the author are, and what has been used from different sources (Blomkvist & Hallin, 2014).
In this study, great importance has been attached to critically analyzing the sources. Several different sources have been used to strengthen the validity of the literature. The sources for the literature study have been carefully read and questioned. The results section has been kept impartial without judgments. Source-critical thinking has been completed by not assuming that the information provided by informants is the given truth. Blomkvist and Hallin (2014) mean that throughout the thesis, the critical attitude is marked by the fact that it is clear what the comments of the author are, and what has been used from different sources. This has been important for the authors of this study to clarify.
2.3 Case study
A case study is a method for evaluating a real-life phenomenon through the collection of data from one or several cases. Based on the selected cases, the study should be able to research and explain the phenomenon through the collected data. The case study should be systematic in its selection of data collecting method as well as the selection of case. When conducting a case study, the researchers should be ready to change their research questions based on the data. The selection of the case is critical for the case study and its quality. The case study can be formed in two different ways, by first formulating the research questions and then selecting the case, or the other way around, where the case is identified and selected first, and then suitable research questions are formulated. Case studies are preferable when there is a need to understand a complex phenomenon because of the detailed empirical findings that come with a case study (Blomkvist & Hallin, 2014). The study chose the case firstly and therefore, the aim and research questions where formulated based on the case.
2.3.1 Semi-structured interviews
One of the most commonly used methods for collecting empirical data within research and thesis context is to conduct interviews to learn more about how individuals’ reason about different questions. As a research method, the interview is a suitable method when there is interest in
6 developing a deeper understanding of a phenomenon, discovering new dimensions of the studied subject and for ambiguity. A qualitative interview aims to create qualitative data with a focus on words, compared to a quantitative interview where the focus is on measurable data (Blomkvist & Hallin, 2014). A qualitative interview can be semi-structured, which means that the interview is organized around several themes or question areas that have been determined in advance in an interview guide which covers the main topics of the study. The various question areas are then treated in the order that falls most naturally. There is also the possibility of follow-up questions based on the participant’s responses (Kallio et al., 2016).
Semi-structured interviews with key individuals at the case company were conducted to collect empirical material. An interview guide was created before the interviews with questions divided into different themes. Some alternative questions were prepared if the answers were brief. The interviews were conducted to investigate how a case company works within the chosen field. Since the company is small with few employees, it was decided that all interviewees will be kept anonymous, as their areas of responsibility can be directly linked to the persons and will therefore not be named in the empiric results. However, there are no clearly stated roles among the employees at the case company. In total, three interviews were conducted. The interviews were about one hour long each. The reason that so few interviews were carried out was because the case company only have three employees, which all of them were interviewed. One person performs many different types of tasks at the company, including as a designer/constructor. The second interviewee is the founder, owner and CEO of the company, with tasks such as marketing, negotiating prices and creating contact with suppliers. The last interviewee is working on developing animated instructional films and designing the work process.
2.3.2 Questionnaires
A quantitative interview, also called a structured interview, can be conducted as a questionnaire that is filled in together with the informants. It is a complete form with yes and no questions, as well as questions where the informants are asked to rate their answers on a scale. This is a way of distributing a questionnaire with the possibility of asking follow-up questions of a semi-structured nature (Blomkvist & Hallin, 2014).
Questionnaires were used to collect quantitative data for the empirical results of this study. The questionnaires were designed to evaluate the level of knowledge of Lean at the case company. This was done to get an overview of how well employees know about and work with Lean practices, tools and methods today. Also, to find out the case company's degree of maturity for the implementation of Lean in the future regarding the distribution strategy. This study is mostly based on previous research about Lean principles, therefore, questionnaires were a good complement to the semi-structured interviews.
2.4 Analysis
The analysis was conducted by first reading through the literature thoroughly to identify similarities in the form of patterns and themes. This process was carried out in steps where general patterns where identified, the patterns then became the foundation for themes. To further categorize the entirety of the literature, the themes were placed in an Excel document. The rest of the literature were then assigned to one or more themes; this process continued until the entirety of the transcript were assigned. After the literature had been assigned to the different themes, the empirical findings from the interviews and questionnaires were then matched into
7 the themes to identify where the theoretical findings and the empirical findings correlate or may contradict.
This process made it possible for themes to evolve during several instances, and change was possible. During the process, themes and subthemes were prone to change. This makes the process free of opinions and perceptions that could have been predetermined. An analysis of data that had been gathered through quantitative means can be difficult, according to Bryman & Nilsson (2011) without a method that is appropriate for analysis. Therefore, the method that this thesis used with themes and subthemes was identified is an appropriate option.
2.4.1 Reliability and validity
A scientific study’s quality can be evaluated by its level of reliability and validity, where reliability is performing the study the right way, and validity is studying the right thing. Two methods to ensure reliability is arithmetic reliability and dialogical reliability. Arithmetic reliability is achieved through measuring mechanically after an agreement by the observers. To achieve dialogical reliability, there needs to be an unambiguous interpretation of the empirical data, this requires neutrality of those who had made the interpretation. A high level of validity is achieved by using literature that is suitable for the research questions and the literature that is referred to in the analysis match with the purpose and research question of the study. Furthermore, the problem formulation, purpose and questions need to correlate with the chosen methods for gathering data and the discussion needs to answer the research questions (Blomkvist & Hallin, 2014). To ensure the level of validity for this study, the interviews were recorded to ensure transparency. Even though there were efforts to retain a high level of validity, it is difficult to eliminate the internal validity, so the study was made with this in mind. To increase the repeatability, the interview questions (see appendix 1) and questionnaires (see appendix 2) are presented in the appendix. To ensure validity, the data was studied at several occasions and discussed to ensure a unified interpretation while focusing on neutrality and objectivity.
8
3 THEORETIC FRAMEWORK
This section will provide the primary data for this study. It is initiated with Logistics aspects, and company maturity, followed by Lean tools and practices and implementation aspects for Lean practices in SMEs.
3.1 The logistics system
There are several definitions of logistics. The internationally leading industry organization in logistics, Council of Supply Chain Management Professionals, defines logistics management as follows:
“Logistics management is that part of supply chain management that plans, implements, and controls the efficient, effective forward and reverses flow and storage of goods, services and related information between the point of origin and the point of consumption in order to meet customers' requirements.” (Council of Supply Chain Management Professionals, 2019).
Logistics is a system that enables activities regarding flow between different companies with each other as well with customers. These types of activities concern nearly all kinds of companies in various industries. This makes the logistical system a vital part for organizations to understand and optimize (Jonsson, 2008). The logistics system can also be described as a set of functional subsystems. Table 2 below shows examples of common logistics-related functions in distribution (Jonsson & Mattsson, 2016).
Table 2. Subsystems in the logistics system, according to Jonsson and Mattson (2016)
Transportation planning Transportation
Loading and unloading Storage
Product configuration and installation (production)
The activities that the logistics system concern is the result in processes where there is a transformation from input to output with a clear beginning and an end. The output from one process will eventually become input for another. Processes and activities that string together are what forms an organization. The goal of the processes is to be as effective as possible at creating value for the customer while consuming the least amount of input. Processes can differentiate and therefore be categorized as core processes, support processes and management processes. Core processes are initiated by events, supporting processes supports the core process, and management processes are often long-lasting strategies and plans (Jonsson, 2008).
3.2 Distribution channels
When creating distribution channels, there are two very central alternatives, especially for the channel of material flow; speculation and postponement strategies. The speculation strategy means in the context of supply chains that value-adding or material-moving activities are performed without an order from the customer. Instead, the activities are initiated based on forecasts. By using this strategy, there is the risk of producing products that will never be in demand or sold, resulting in those products becoming obsolete. This strategy also results in higher inventory costs as well as capital tied up from building up inventory. Where the
9 speculation strategy has disadvantages, the postponement strategy has advantages and vice versa. The postponement strategy waits as long as possible, preferably until a customer order has been received, before performing value-adding and material-moving activities. There are two dimensions of postponement, production postponement and material flow postponement. Production postponement means that specific product variants are not performed in any form until there is a customer order for it. The material flow postponement means that no transportations of materials are performed until there is an order for the goods (Jonsson, 2008).
3.3 Transportation planning
Transportation planning refers to the planning activities that occur before the external transportation of goods. The choices that are being made during the planning dictate which transport method should be used, which transporter should do the transportation, where to load and unload, the optimal route, which vehicle at the specific parts of the route and the designing of a transportation network (Jonsson & Mattsson, 2016). Transportation planning is a process of decision-making and analyzation of data in steps. The decision-making should be based on analyzed data, the data could come from prior transportations, but the gathering of data could be more sophisticated. The next step is to define objectives, goals and ways to measure the performance of the newly planned transportation. This step is crucial when determining criteria to judge the potential transportation methods effectiveness. The next step is to estimate the potential impact of the new transportation plan and how it may perform compared to the existing transportation plan if there is one (Meyer, 2016).
3.3.1 Transportation costs
The most standard external transportation costs are loading, movement of goods, reloading and unloading. Activities associated with cost occur when there is a transportation of products to another facility of the organization, to another organization, to a third-party deliverer or the end customer. Transportation costs can be difficult to distinguish because the costs are often included in the total product cost. Similar to inventory costs, transportation costs bind capital and material during transportation, creating waste and adding to the total transportation cost (Jonsson & Mattsson, 2016). Transportation costs should be an important part when designing a transportation plan. The main transportation cost factors that were identified were the distance of the delivery, the number of vehicles used for transportation, the weight of the goods and the duration of the transportation. It is important to identify these transportation costs to reduce them as much as possible and to compare them against other possible transportation options (Bokor, 2010).
3.3.2 Different methods of delivery
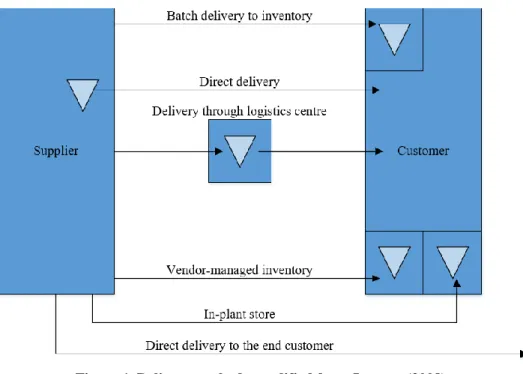
After the supplier has finished the value-adding work to goods, it is time to transport it to the customer. The supplying company can choose different ways to complete this process of transporting goods to their customer. The most common methods of delivery that producing companies may choose are batch delivery to inventory, direct delivery, delivery through logistics center, vendor-managed inventory, in-plan store and direct delivery to the end customer
(Jonsson, 2008). Figure 1 below illustrates the most common methods of delivery for producing companies.
10 The triangles of the figure represent the possible location of inventories for the various methods of delivery (Jonsson, 2008).
3.4 Delivery customer service elements
According to Segerstedt (2009) and Jonsson (2008), the service that the suppliers provide from the point when a customer makes an order to a delivered product is referred to as delivery customer service. The delivery customer service can be divided into service elements that define the different services in different situations. Table 3 below shows the five service elements identified by Segerstedt (2009) and Jonsson (2008), with an additional sixth service element identified by Segerstedt (2009).
11
Table 3. Service elements, modified from Segerstedt (2009) and Jonsson (2008)
Service elements Definition of service
1. Delivery time The time it takes for a customer to use the product or service that he or she has ordered from the supplier.
2. Delivery precision How accurate the timing of the delivery regarding the timeframe that the supplier provided, or the supplier and customer agreed upon.
3. Delivery reliability To which degree did the supplier deliver the right goods in the right amount based on what the customer ordered.
4. Inventory service level How much of the ordered goods can the supplier provide directly from their inventory.
5. Delivery flexibility How much the supplier can change and adapt to a special or changing customer order to meet the customers' needs and expectations. 6. Information Information regarding the delivery is key for
customer satisfaction, even if the delivery time and precision have been lacking, improved information have shown to make a customer believe that the delivery customer service has improved (Segerstedt, 2009).
3.5 Company Maturity
According to Bamford and Deibler (1993), the Carnegie Mellon University Software Engineering Institute has developed a framework to measure the level of maturity. The framework presented five levels of maturity that a company can be at regarding their processes, where level 1 is the lowest level of maturity. Bamford and Deibler (1993) define these five levels as follows:
• Level 1. Initial
There is no process, or they are in the initial steps and are informal. • Level 2. Repeatable
The processes have been developed enough that they are repeatable, and key workers understand them well.
• Level 3. Defined
Processes are so well defined that they support the growth of the company by being a baseline for new technologies and processes to be added.
• Level 4. Managed
Measurements have been defined to evaluate if quality improvements are needed and to identify defects in the processes.
12 • Level 5. Optimized
Continuous improvement has been achieved by automatically measuring the performance of processes and evaluating the data.
Kulkarni and St Louis (2003) argues that the maturity of a company also reflects on the management of knowledge. These have also been presented in a framework that consists of five levels, where level 0 shows that the company completely lacks in the management of knowledge and level 1 is the lowest level of maturity. Kulkarni and St Louis (2003) presents the five levels as follows:
• Level 1. Possible
The company and its employees have identified knowledge assets. A majority of the employees want to share knowledge because they understand that it is valuable.
• Level 2. Encouraged
The sharing of knowledge is appreciated and rewarded. The company has started to store knowledge and its assets.
• Level 3. Enabled
Knowledge management has become a part of the normal work and is required by the employees.
• Level 4. Managed
Knowledge has now become easy to find and use by the employees, and they understand how to seek it out and use it.
• Level 5. Continuously Improved
The entire workforce is familiar to and uses the knowledge as a tool. Effective and useful tools have been developed and are used to update processes as well as share the knowledge to every part of the company.
3.6 Lean
The goal of Lean is to create the most value for the customer with the lowest cost through elimination of waste and to generate flow while involving and utilizing the full potential of the workforce (Bicheno & Holweg, 2016; Reichhart & Holweg, 2007). An organization that uses Lean can reach these goals through its tools and Lean philosophy. The Lean philosophy and its tools can be used by other industries even though its origin is in automotive production (Melton, 2005). One of the fundamental parts of Lean is its long-term philosophy. From the very top of the company, all decisions should focus on adding value to the customer, as well as society. This drives a long-term approach to build a learning organization that can adapt to changes in the surrounding environment and survive as a producing company. Without this foundation of long-term thinking, the investments towards continuous improvements and learning would not be possible. It is also important to develop a culture at the organization in which everyone is striving to improve continuously. An organization that uses Lean tools in combination with Lean thinking can become a Leaner organization. The key methods and tools of Lean are Kanban, 5S, Visual control, Pull-systems and JIT (Liker, 2004).
13
3.7 5S
The Lean tool that focuses on the elimination of waste that generates errors, defects and workplace hazards is 5S. It stands for sort, set in order, shine, standardize and sustain. The 5S makes for a continuously improving tool when they are used together to create a cleaner and more efficiently streamlined workplace (Liker, 2004; Dennis, 2007).
• Sort
Create a sorted workplace by removing unnecessary tools that are in the way of workforce productivity. When sorting the workplace, a common method is red-tagging. Red-tagging is carried out by tagging the tools that are rarely used in that process by later removing them to eliminate the time searching for the correct part or tool. A result of not doing this is the possibility that the workplace can be oversaturated with material that can affect the effectivity negatively (Liker, 2004; Dennis, 2007).
• Set in order
Organize the workplace by assigning tools and material to place them at their optimal place to help the operator work efficiently, resulting in a stable workplace. If a workplace is set in order, the operator should be able to reach the most commonly used (Liker, 2004). When setting a workplace in order, visual tools could be used to make it obvious where tools and materials should be placed to save time for the operator (Dennis, 2007). • Shine
Cleaning is dual functional in 5S because the cleaning process works as an inspection to detect problems with the machinery before a potential breakdown as well as an ordinary cleaning (Liker, 2004). According to Dennis (2007) increased work spirit amongst the operators will be a result of a clean workplace.
• Standardize
To implement the three previous S’s, there needs to be standardization. Standardization is easier to achieve with clear standards that will be simple to follow for the workforce. The result is that the procedures of the first three S’s will become natural for the workforce. The first step of the standardization should be the identification of what elements of the previous S’s can be standardized. After a standardization has been implemented, defects and standouts become easier to identify (Dennis, 2007).
• Sustain
The Lean tool 5S is designed, so it brings value to its user through the last S, sustain. Sustain captures the value of 5S by making it a process that improves continuously (Liker, 2004). To secure the sustaining of 5S, there need to be involvement of the workforce by communication, training and promotions (Dennis, 2007). Eventually, the workforce will become self-disciplined, and the true value of 5S will be captured, if not the value of the tool will be lost, this makes the last S a vital part of the success for the tool (Liker, 2004).
14
3.8 Elimination of Waste
Waste is anything in the process from order to a customer that is not value-adding from the perspective of the costumer (Liker, 2004; Čiarnienė & Vienažindienė, 2012; Kulkarni, Kshire, & Chandratre, 2014). Therefore, waste is identified by looking at all processes within an organization that the customer is not willing to pay for (Čiarnienė & Vienažindienė, 2012; Kulkarni, Kshire, & Chandratre, 2014). The focus of eliminating waste originated from the TPS and resulted in the identification of seven main wastes that are connected to non-value-adding processes. These waste can be applied to various types of work environments, everything from offices to production lines (Liker, 2004). The seven wastes, according to Liker (2004), are as following:
• Overproduction
This type of waste occurs when the production produces more than customers demands. Overproduction often creates other types of waste, thus needs to be eliminated. The other types of waste that occur because of overproduction are excess inventory, unnecessary transportation and movement.
• Waiting Time
Operators or machines that are unused are waste because they are not doing value-adding-work. If operators or machines are being unused, for reasons like stockouts or not having anything to work with, the result will be a more expensive production cost.
• Unnecessary Transportation.
This waste refers to the transportation of work in progress products or finished products in and out of inventories and other transportations that may occur within the production plant. Unnecessary transportation often creates more waste, such as damaged products and lost parts.
• Unnecessary Movement.
Waste connected to unnecessary movement occurs when the operator has to move him or herself when doing their work. Wasteful movements include reaching, looking and even walking. This waste often occurs because of a suboptimal workplace for the operator.
• Defects.
When producing a defective product, the product becomes worthless unless there is rework done, and additional resources are applied. Rework takes time, time that could have been value-adding. Sometimes the defective part is defective to such an extent where it is useless and cannot be reworked into a quality product.
• Excess Inventory
When there is an excess of material, work in progress products and finished products in the inventory, there is excess inventory. Excess inventory can cause longer lead times, damaged goods and unnecessary transportation and finished goods may become useless. This waste may also hide problems in the production such as defects, bottlenecks and unevenness.
15 • Over Processing or Incorrect Processing.
This waste may occur when the product has greater quality than needed to satisfy the customer or when a process uses inefficient tools, and the process takes more time than necessary.
In addition to the seven wastes, there is an eight waste that occurs when the organization does not utilize the workforce's skill and knowledge. Not utilizing the workforce is waste because the organization misses out on ideas, improvements, unused skills and the opportunity to learn from the workers in the production (Liker, 2004; Kulkarni, Kshire, & Chandratre, 2014). According to Bengtsson and Osterman (2014), many organizations have introduced widespread improvement programs, involving most of its employees, in the ambition to solve problems and reduce waste, but this broad approach has introduced other problems. In terms of overall improvements, much of the effort and resources spent on improvements give very little results as the resources are spent, but no real improvement is achieved. This is defined as the ninth waste: wasted improvements or improvements in vain (Bengtsson & Osterman, 2014).
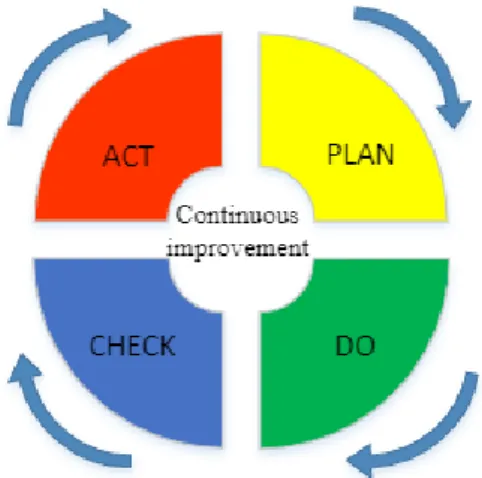
3.9 PDCA Cycle
The origin of the plan-do-check-act (PDCA) cycle, also referred to as the Shewhart Cycle, comes from the Deming Wheel by Dr. W. Edwards Deming’s lecture in Japan in 1950. Deming underlined the importance of the interaction between design, production, sales and research. The Deming Wheel consists of the four phases, and a fifth which is repeat, shown in Table 4 below (Moen & Norman, 2006).
Table 4. The four phases of the Deming Wheel, according to Moen and Norman (2006)
1 Design the product
2 Production: test it in the production 3 Put it on the market
4 Sales: test it in service, market research
5 Re-design the product, in consideration of consumer reactions)
The aim is to improve the quality of the product or service, and the steps should be rotated constantly. The Japanese interpreted and altered the Deming Wheel in Dr. Deming’s lectures, resulting in the PDCA cycle (Moen & Norman, 2006). The standard Lean cycle is a methodology that aims at iterative problem-solving. There are several variants of PDCA discussed in previous research, and since its origin, it has been applied to a range of engineering design problems. The flexibility and simplicity of the approach is the power of the PDCA, and the framework can be integrated into, e.g. existing Lean approaches, hence it supports flexible continuously improvement (Sreeram & Thondiyath, 2015). The basis of the PDCA cycle consists of four phases, as illustrated in Figure 2, which will be described below.
16
Figure 2. The PDCA Cycle, modified from Moen and Norman (2006)
The problem is defined in the plan-phase by identifying the root causes of the problem and the redundant steps in the process (Sreeram & Thondiyath, 2015). This phase is usually dedicated to the strategies, definition of objectives, as well as the design of the organization. It also includes human resources management (Chiarini, 2011). The Do-phase typically involves a scheme of solutions. After deciding on a possible solution, it is time to adapt and test it to ensure that the solutions output will satisfy the requirements and constraints. The primary aim of the Check-phase is to ensure that the solution is stable and predictable. The implementation could start in this phase and continue into the next phase. Lastly, the Act-phase consist of product or process control measures. At the end of this phase, the next steps for further improvements should be identified for continuous improvements (Sreeram & Thondiyath, 2015).
3.10 Levelled workload
To meet customer demand on a weekly or monthly basis, the workload may vary to different degrees resulting in a stressed workforce and overloaded machinery one week, and other weeks the workforce barely has anything to do, then the machinery becomes underutilized. If the production varies, it can be difficult to determine which quantity and when there should be placed an order from the supplier, this is a difficult way to use Lean. This would result in stockpiling to meet the varying customer demand, creating problems in quality when problems get hidden as well as tying up capital in expensive warehouses. To solve these problems, the workload needs to be levelled. To achieve a levelled workload, the three Ms: Muda, Muri and Mura need to be eliminated. The most familiar M, Muda includes waste and non-value-adding activates that prolongs the lead times, an unnecessary movement that the operator makes and excess inventory as well as the various types of waiting. Muri include the overburdening of the different aspects of an organization, from the workforce to the machinery. The result of Muri is often in workplace hazards and a lacking quality as well as mechanical failures and defects. The last M, Mura comprises of unevenness, and can be viewed as the result of the two prior Ms. An organization becomes uneven when the production schedule differentiates because of problems such as downtime and too many defects. This means that there is a need for more material, equipment and a larger workforce, even if the average production need is lower. To truly achieve a levelled workload, all the Ms need to be eliminated, otherwise, the production system will fail, and the workload will still be uneven (Liker, 2004).
17
3.11 Just-in-time
JIT is an essential part of Lean that is involved in various parts of Lean production (Shah & Ward, 2007). JIT production is a method used to meet changes that arise due to problems or changed requirements. The goal of JIT is to produce the right goods, in the right quantities at the right time and place. JIT emphasizes the achievement of the goals of zero defects, queues, inventories, and zero breakdowns, among other aspects (Kumar & Panneerselvam, 2007; Monden, 2012). Organizations that properly use JIT has the potential of gaining results such as increased quality, productivity and efficiency, but also decreasing the costs and waste,
improving communication as well as strengthening the organization’s competitiveness in the marketplace (Kootanaee, Babu, & Talari, 2013). JIT is also a production philosophy that is expected to reduce inventory by reducing the level of stock in a production process. The three fundamental principles of JIT philosophy are the elimination of waste, continuous quality improvements and encouragement of workers to participate in operations planning and execution. Other objectives of JIT is minimizing the need for raw materials, work-in-process (WIP) and finished goods inventory by reducing setup times (Chan, Yin, & Chan, 2010). Lean practices such as JIT is not a finished programmable or modular system that can be purchased and installed by a vendor then ready to use (Im & Lee, 1989). It requires more to implement JIT practices since it remains state of the art and because it is a kind of do-it-yourself system. Since JIT not is a finished system that can be purchased by a vendor who implements it, many companies, especially SMEs, use outside consultants as the primary information source, guiding them through the implementation of JIT (Zhu, Meredith, & Makboonprasith, 1994). This is often due to the need for specific implementation procedures depending on the characteristics and environment of an organization that is to implement JIT (Im & Lee, 1989). Zhu, Meredith and Makboonprasith (1994) find in their study that JIT users at some producing companies also used published articles as an information source for their workforce education of JIT.
3.12 Implementation of JIT practices
Successfully implemented JIT is, according to Nakamura, Sakakibara and Schroeder (1998), typically associated with more utilization of labour as well as higher productivity, compared to alternative production methods. There are many developed practices for JIT today; however, according to Im and Lee (1989), it is unnecessary for a company to adopt all of them. Nakamura et.al. (1998) have defined some of the core practices related to JIT, which is listed in table 5 below.
Table 5. Core practices related to JIT, modified from Nakamura et.al. (1998)
Setup-time reduction Schedule flexibility JIT maintenance
Specific equipment layout configurations
Kanban systems Pull systems support JIT supplier relationships
18 The marginal cost of implementing some of these core JIT practices does not necessarily have to be higher than the marginal cost associated with other alternative production practices. However, there is still costs related to an implementation of core JIT practices such as training for workers, research and development investments, as well as investment in capital equipment. For example, redesigning the production equipment are often required for implementing new JIT production lines (Nakamura, Sakakibara, & Schroeder, 1998).
There are some critical factors for a JIT implementation. Top management commitment is one of the most critical factors in successfully implementing a technological innovation (Im & Lee, 1989; Zhu, et.al., 1994). If JIT is implemented under short-term profit-oriented management, the implementation is more likely to fail than if the long-term view is taken. Furthermore, JIT production requires system-wide production plans scheduling based on customer demand information. This is made possible by the use of other Lean practices, such as the use of pull system support practices, Kanban system, as well as schedule flexibility (Nakamura,
Sakakibara, & Schroeder, 1998). The core JIT practices will be described individually below.
3.12.1 Setup-time reduction
One of JITs most important principle is eliminating waste throughout the production system, and an essential step in eliminating such waste is by simplifying production processes. Requirements for setup-time reduction are the implementation of activities that support the reduction of setup times (Nakamura, Sakakibara, & Schroeder, 1998). To achieve the ideal lot size of one unit, the reduction of machines setup-time is required, and the machines have to be set up for producing smaller lot sizes frequently. Therefore, simplified and standardized setup procedures must be developed (Zhu, Meredith, & Makboonprasith, 1994).
3.12.2 Schedule flexibility
Usually, the master schedule is prepared every week. This could be converted into the material requirements plan on a daily basis. The product mix from lot to lot may have to be adjusted to execute the required quantities of the products that are being produced (Zhu, Meredith, & Makboonprasith, 1994).
3.12.3 JIT maintenance
One of the goals of JIT is to allow very little WIP inventory. Therefore, it can be very
disruptive with machine breakdowns. To provide a smooth production flow, it is preferable to have preventive maintenance, which should be considered a part of the job requirements for line workers as well as minor repairs (Zhu, Meredith, & Makboonprasith, 1994).
3.12.4 Specific equipment layout configurations
For a company to achieve JIT production as a continuous production system, the equipment layout must be able to accommodate work cells. The maintenance of the equipment must as far as possible be delegated to employees in the production so that most routine repairs can be performed immediately in place if needed (Nakamura, Sakakibara, & Schroeder, 1998).
19
3.12.5 Kanban systems
The term Kanban can both refer to Kanban cards and Kanban system. Kanban generally refers to a signal of some kind, and in production, it commonly refers to a card or tag. The utilization of cards is to manage the delivery or production of components, items or raw material (Wang & Sarker, 2006; Lage & Filho, 2010; Rahman, Sharif, & Esa, 2013). The card accompanies products throughout the plant, indicating the products name or serial number for identification, quantity, the required operation as well as the destination of the part or product (Kootanaee, Babu, & Talari, 2013). Kanban system was created to control inventory levels, the production and supply of components. It can be defined as a material flow control mechanism that controls the right quantity and products at the proper time. Kanban system can fulfil the specific needs of an organization, i.e. to work effectively under specific market conditions. There are some restrictions in certain conditions when Kanban systems are not suitable, i.e. in situations when the demand is unstable, unstable processing time, operations that are not stabilized and raw material supply uncertainty (Lage & Filho, 2010). It is a strategic operational decision to use Kanban systems in the production lines, and it can help to improve the organization’s
productivity and minimize waste in production (Rahman, Sharif, & Esa, 2013).
3.12.6 Pull Systems
To eliminate waste that is generated by inventory, an organization can use a pull system to supply their costumer or the next process in the flow with what they want, when they want it and in the right quantity (Liker, 2004). The only work that the organization should do should be based on the customer need and demand to ensure that the work performed is of value to the customer and organization (Martin, 2007). Though the goal is to have a one-piece flow, where the production only produces one product at a time based on the customer demand, there will be a need of work in progress inventory as well as finished products to create a levelled production. To be successful with a pull system, production planning should be updated daily instead of relying on computers to determine the production pace (Liker, 2004). Regardless of the level of demand, proper JIT management allows an organization to meet customer demand through the use of a pull system of production (Kootanaee, Babu, & Talari, 2013).
3.12.7 JIT supplier relationships
Under a JIT system, the most important criterion in vendor selection is the quality of the product and service of the supplier. Therefore, single-source suppliers are preferred for JIT practices (Zhu, Meredith, & Makboonprasith, 1994).
3.13 Implementation of Lean practices for SMEs
Successful implementations of Lean and its practices have been carried out several times. The majority of organizations that have implemented Lean has been large companies where the minority has been SMEs (Hu et al., 2015; Rose, Deros, & Rahman, 2011; Rymaszewska, 2014; Zhou, 2016). The lack of focus on SMEs has also been the case when it comes to studies and research regarding the subject implementation of Lean and Lean practices (Achanga et al., 2006; Hu et al., 2015; Rymaszewska, 2014; Zhou, 2016). The success of Lean for large companies has made Lean attractive for SMEs, and the success of large companies has forced SMEs to consider implementation. Even though there are differences between large companies and SMEs, both can benefit from an implementation of Lean (Zhou, 2016; Rose et al., 2011). For an SME to truly benefit from an implementation there need to be some adjustments to meet the needs of SMEs
20 and not just copy the implementation process that large companies may have used (Rymaszewska, 2014). One difference between large companies and SMEs is the influence they have on their supply chain related to their suppliers and other partners, where larger enterprises tend to have more power and influence than an SME (Achanga et al., 2006; Golicic & Medland, 2007; Hu et al., 2015; Rose et al., 2011; Rymaszewska, 2014).
3.13.1 Critical factors for a successful implementation of Lean for SMEs
For a successful implementation, Achanga et al. (2006) have presented four critical success factors which are leadership and management, financial capabilities, skills and expertise, and organizational culture. These critical success factors have been verified directly or indirectly by various other studies (Bakås, Govaert, & Van Landeghem, 2011; Belhadi, Touriki, & Elfezazi, 2018; Hu et al., 2015; Zhou, 2016).
Some studies argue that the most important critical success factor is leadership and management because of the involvement in the various areas of the organization (Achanga et al., 2006; Belhadi et al., 2018; Hu et al., 2015). The management needs to be determined in their leadership and have a clear strategy in its effort for implementation, without this, an implementation of Lean has almost no chance of succeeding regardless the type of organization (Bakås, Govaert, & Van Landeghem, 2011). Strong leadership and management should give a clear vision and strategy for the staff and create a culture at the organization that everyone can follow. This will help to spread the implementation effectively to different parts of the organization’s infrastructure. If leadership and management success in this, the result should be a more skilled and knowledgeable workforce (Achanga et al., 2006). The management must be ready and willing to change in their way of leading, thinking, and how they operate, otherwise, they can hinder the implementation (Zhou, 2016). SMEs are often managed by the founder and/or owner of the organization and have a great influence on, for instance, the strategy and how day-to-day work should be done. This may have a devastating problem for the implementation because of the risk of lacking management and leadership skills, which an implementation of Lean often requires (Achanga et al., 2006).
Because SMEs often have limited capital and financial capabilities, the possible implementation of Lean can seem too expensive and time-consuming(Achanga et al., 2006; Hu et al., 2015). It is often difficult for organizations to justify a large risk in operation like Lean production because of the incalculable result of such a shift. The financial aspect of an organization often determines the possible success of a major change; this is also true when it comes to the implementation of Lean. The transformation of the essential processes could, in some cases, stop the production and stop the organizations monetary flow from the customers (Achanga et al., 2006). SMEs compared to large companies, often chooses to implement Lean tools and practices that are characteristically inexpensive and are most likely to give a return on investment (Hu et al., 2015). According to Rymaszewska (2014), the financial capabilities of a SME have been identified to be a hindering factor when there is an inadequate amount of resources and that in some cases not enough resources has been given to the implementation due to the lack of belief in immediate profits.
Because of the constraints regarding the financial capabilities for SMEs, hiring of skillful, expert level employees is often difficult due to the more expensive salaries that such employees would require (Achanga et al., 2006; Bakås, Govaert, & Van Landeghem, 2011). SMEs often tend to employ lower skilled personnel because of the lower costs; this hinders the capabilities of the implementation because people with lower skill traditionally do not try to develop their own
21 skills and expertise. Technological development of a workplace is something that a low skilled workforce often does not favor over continuing their current work (Achanga et al., 2006). A challenging part of the Lean implementation is the organizational culture. To successfully create a Lean culture, there needs to have a high level of organizational skills. For an organization to succeed in its implementation of Lean, it needs an organizational culture where communication, sustainability and proactive improvement is evident. Therefore, it is vital for an SME that implements Lean to focus on communication, clear strategy, flexibility and long-term commitment if it seeks to be successful in its implementation (Rymaszewska, 2014). A common challenge for organization culture regarding SMEs is the fact that the culture is often directly determined by the owner or manager. This has the risk to be a problem for an implementation of Lean because of the need for change, these changes may be too demanding for the owner or manager and may hinder the implementation (Achanga et al., 2006). The development of a supportive organizational culture, where the workforce is empowered and takes part in decision making, is desirable if one seeks to implement Lean. There should be a focus on both the supportive organizational culture and not just the operational level because of the many problems that can be found in this area (Hu et al., 2015).
3.13.2 Lean practices favorable for SMEs
The aforementioned critical success factors can put SMEs in a difficult situation when it comes to implementation of some Lean practices, therefore, SMEs should focus their implementation on the internal processes which involve the workforce. The suggested Lean practices that focus on workforce involvement are 5S, visual management and quality control (Rose et al., 2011). These suggestions correlate to some extent with the findings from the surveys that Zhou (2016) conducted regarding Lean principles and practices that SMEs mostly used, where 5S was ranked the highest and quality related practices ranked second while visual management was ranked fourth.
3.13.3 Benefits of an implementation
To reap the full benefits of a Lean implementation, the organization needs to be tolerable and work towards long-term goals instead of chasing short-term goals. The organization should even be ready to sacrifice some of the short-term goals to complete the Lean implementation. If the organization does not see the Lean implementation as a long-term investment but rather just a tool to fix short-term problems, there is a major risk that the whole project will be abandoned long before the organization receives any benefits (Rymaszewska, 2014). SMEs often has a significant difference in their implementation, and which practices they had chosen to implement. The difference in practices that the SMEs choose to implement were strongly related to the performance of the organization. The primary of fourteen presented benefits that the SMEs received by implementing Lean practices were increased productivity and efficiency, increased customer satisfaction and less production- and inventory costs (Zhou, 2016). Bhasin and Burcher (2006) argue that the focus of a Lean implementation should be on the entire supply chain and not just the individual organizations, this could put SMEs in a challenging position if they seek to implement Lean.
22
3.14 Lean Start-up
Ries (2011, p. 8) defines a start-up as “a human institution designed to create new products and services under conditions of extreme uncertainty”. Many entrepreneurs that start a business has a just do it attitude, avoiding any forms of management, process, and discipline, but this attitude can lead to chaos rather than success. The Lean Start-up is an approach to prevent common failures that start-ups face, and it is designed to teach how to drive a start-up. The approach adapts the ideas of Lean thinking from the roots of Lean production that Taiichi Ohno credited when developing Toyota. The Lean Start-up approach can work in any size company as well as in any industry. A start-up is not just a product; it is an institution that calls for a new kind of management which is adapted within its context by extreme uncertainty (Ries, 2011).
Some important principles of the Lean Start-up approach are validated learning and the Build-Measure-Learn feedback loop. Usually, production progress is measured by high-quality physical goods production. Lean start-up uses a different unit of progress called validated learning, which uses scientific learning to identify and eliminate the sources of waste. Start-ups exist to learn how to build a sustainable business, which can be validated scientifically by conducting frequent experiments that makes it possible for entrepreneurs to test each element of their vision. Validated learning is a process of demonstrating empirically what valuable truths the business team has discovered about start-ups present, as well as future, business prospects. The process is more tangible, accurate and faster than traditional market forecasting or business planning. A start-ups central activity is to turn an idea into a product, measure customers respond to the product, and on the way learn whether to pivot or persevere that product. To accelerate that feedback loop, all successful start-up process should be geared. The Lean Start-up approach introduces a process called the Build-Measure-Learn feedback loop. Through this process, entrepreneurs can make constant adjustments and learn from it instead of making complex plans based on assumptions (Ries, 2011).
3.15 Lean Distribution
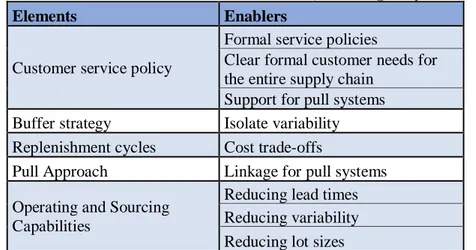
Lean distribution works as a continuation of the pull system that Lean production use, that is to only produce based on customer orders (Reichhart & Holweg, 2007). Lean distribution is a more flexible and simple method for distribution, which is achieved through the reduction of lot sizes and reduction of lead time as well as increasing reliability. This is a characteristically different approach to the distribution when compared to the traditional way to distribute, where rescheduling and inventory are the main ways to meet the ever-changing customer demand (Zylstra, 2005).
To utilize Lean distribution successfully, there are eight enablers based on practices from Lean production but altered to fit distribution rather than production. These eight enablers are categorized into five elements (Zylstra, 2005). The elements and their connected enablers are presented in table 5 below.