_ V I I r a p p o r t
324 A 1987
Laboratory methods for
determi-nation of the water susceptibility
of bituminous pavements
Experience gained in the Nordic countries
UIf Isacsson and Torbjorn Jorgensen
VHy-DC/l a k' Statens vag- och trafikinstitut (VTI) * 581 01 Linkoping
swedish Road and Traffic Research Institute * $-581 01 Linkoping Sweden L
l/TIra
324 A
1.987
Laboratory methods for
determi-nation af the water susceptibility
of bituminous pavements
Experience gained in the Nordic coun tries
Ulf Isacsson and Torbjb'rn Jb'rgensen
Vag- 00/7
Statens va'g- och trafikinstitut (VTI) - 58 7 07 Linkb'ping
l StItlltBt Swedish Road and Traffic Research Institute o 3-581 0 1 Linképing Sweden
INDEX
SUMMARY
1 INTRODUCTION
2 METHODS
2.1 - The rolling bottle method 2.2 The indirect tensile test
3 OPTIMISATION OF THE ANALYSIS METHODS 3. Rolling bottle method
Particle size of the aggregate Binder content
Density of the aggregate Testing temperature
Hardening time after mixing
Drying temperature for the aggregate Rolling rate for bottles
Indirect tensile test
Particle size distribution ofthe aggregate Binder content
Method of mixing
Method of manufacturing test specimens Method of saturating the test specimen Conditioning time Effect of freezing-thawing Testing temperature Heating time 0 Bar or plate? 1 \ o n i n b i o f o f N N N t h N h N N N N wh H h H p h h . C . . . . . vvxo o o 'wo xi n l r wwi
. . Width of the bar
4 RING ANALYSIS
4.1 The rolling bottle method
4.2 Indirect tensile test
5 DISCUSSION AND GENERAL CONCLUSIONS
6 ACKNOWLEDGEMENT
7 REFERENCES
VTI REPORT 324A
39 41 42
Laboratory methods for determination of the water susceptibility of bituminous pavements - experience gained in the Nordic countries by Ulf Isacsson
Swedish Road and Traffic Research Institute (VTI)
5-581 01 LINKOPING Sweden
and Torbjorn Jorgensen
Norwegian Road Research Laboratory N-O60ll OSLO 6
Norway
ABSTRACT
The water susceptibility of bituminous mixes has been studied using two different laboratory test methods, the "rolling bottle method" and the "indirect tensile test" respectively.
The work has been carried out in two stages. First, the two methods were "optimised" through studies of a number of parameters considered influential on the results. Following these studies, preliminary test instructions were produced. In the second stage of the project, a ring analysis was performed to determine the precision of the two methods.
In the optimisation experiments, the results have in many cases been difficult to interpret. In such cases, "practical regard" and "common sense" have had to determine the design of the test instructions.
The ring analysis has clearly shown that the precision of the two methods is unsatisfactory. A contributory reason for the large disper-sion in results is probably insufficient experience of the methods at several laboratories participating in the ring analysis. Continued usage of the methods will therefore probably improve precision.
Advantages and disadvantages of the two test methods are discussed.
No attempt has so far been made to determine the validity of the laboratory methods through field experiments. Such tests are time-consuming and it is difficult to draw definite conclusions from them, since many factors other than water susceptibility may influence pavement function. Nevertheless, it is necessary to perform such a validation if the two laboratory methods are to be "trustworthy".
1 INTRODUCTION
At the end of the 705, an abnormally high frequency of damage was observed on bituminous pavements in Sweden and Denmark, as well as in other countries. Discussions produced a number of conceivable explanations for this damage, one being insufficient adhesion between aggregate and binder in the presence of water.
Over the years, a very large number of laboratory methods (I, 2, 3)
have been proposed for determining the water susceptibility ofbitumi-nous pavements. The advantages and disadvantages of these methods
were discussed by the Nordic Committee on Binders at the beginning of
the 805. These discussions led to the selection of two methods (Section 2) whose suitability was to be evaluated in greater detail. To perform this work, a working group was appointed with representatives from Denmark, Finland, Norway and Sweden. The work was carried out in two stages. First, the two methods were "optimised" through studies of a number of parameters considered influential on the results. Following these studies, preliminary test instructions were produced. In the second stage of the project, a ring analysis was performed to determine the precision of the two methods. On the basis of experience from this analysis, certain modifications have beenmade to the test instructions. This work is described in References 4 and 5 and is summarised in this
report.
2 METHODS
In discussing suitable laboratory methods, these were evaluated among other things on the basis of the following aspects:
Nordic experience of the method
- Validity of the method, i.e. the method's capacity to predict what will happen on the road
- Simplicity of the method
The methods chosen, the rolling bottle method and the indirect tensile
test, are briefly described below.
2.1 The rolling bottle method
The aggregate in question is dry-sieved and the 5.6 - 8 mm fraction is washed and dried overnight at llOiSOC. The aggregate and binder are warmed to a suitable mixing temperature according to the hardness of
the binder; for B180 (penetration at 25°C 180 1/10 mm), for example, the mixing temperature is 150:50C.
The bottle (Fig 1A) is filled half full with distilled or deionised water at a temperature of 5°C, after which the bitumen-coated aggregate is inserted, one stone at a time. More water (at a temperature of 5°C) is added as far as to level A. The bottle is then sealed and placed in a refrigerator at 5°C until the tests are to commence. The procedure for adding the water at 5°C reduces the risk of agglomeration (see Section 3.1.1).
The bottles containing the samples are placed on a rolling table (Fig 1B) and rolled at room temperature at a speed of 40 rpm for 3 days. When testing adhesive agents, a speed of 60 rpm is used.
Screw cap, <D~30 rnrn
Rubber tube
Level A
Gloss rod, ¢> 6mm
&
J
Length 140 mm, <b~70 mm
Figure 1A Bottle in rolling bottle test.
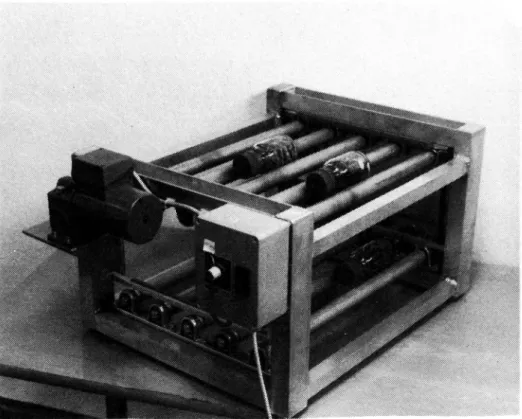
Figure 1B Rolling table.
With the rolling table used in the majority of the Nordic laboratories, up to 2!! bottles can be rolled simultaneously.
The degree of coverage, i.e. the proportion of the surface of the aggregate covered with bitumen, is assessed visually after about 5, 24, 48 and 72 h by 2 observers independently of each other. The same observers must perform all the assessments in one and the same rolling test and must not have access to earlier results from the particular test when performing the evaluation.
The mean degree of coverage (from 2 x 3 results) is calculated and entered in a diagram as a function of the rolling time (see Section 3 for
an example).
2.2 The indirect tensile test
A quantity of bituminous mix sufficient for 10 Marshall test specimens is manufactured in a laboratory mixer. Alternatively, sufficient mate-rial for one specimen at a time can be mixed by hand.
The aggregate must have a particle size distribution as shown in Fig. 2. For aggregates with a density of 2.65 g/cm2 the binder content must be
5.41 % by weight. If the density deviates from 2.65 g/cm3 the binder
content must be corrected.
0, 0.2 0,6 2 6 20 w L l l A l Ll lw -I L- ~L2 ' r' ~L - rL: : L -:L .:' -LL L: - II I :1 - I I LI: ' : 5 : L L .1 L L4 L. LIL L. .1 L. .L _ J L. :. r I -- ~: I -: - I' ~r r: :I r: : :L I -: :- LL I I I L I. I L I: L U L : L I L L L m. - L I L L I L LI L : : r : - L I : L: I -: : I L L: LL :I E LL _L_ I LL : LL I L .. .1 L L.I LL. L. L1 ._ _ L. .1 .. L L. l :L :L I :L :- I : :L L :I :_ L: tL I :L : : I L _. I _ L I : L L :I L L L I L : : 80 .L l .- L 7 L- I- »< I-1 L L L. Y I. L L I : : I : : I r : :I : E r I : : : I. -L LL .I LL L .1 _ .L- rL -.I L.L L. L .1 LL. :_ L I _ L I - : I - - L -I L : : I L : : I : : I : : I : : : :I : : : I : : : O! I -: :L I :L : IL :L : :L :IL : L: :. I L: -: :L I: I L L .1 L. -4 _ LL. L. LI __ L J _. L. _ .- I : ". I : : I : t: :I : E I : : : I n- I u- - _ F- D U) I L L I L L I L L - :I L L I - L L ,_ I L T L L ' L- - 7 L. L In 60. : L , : . , L - L L - . L : -U L L L L - L L L L L L L 1 :. L .1 L L .1 L LIL : ._ r. L .1 L. " L: Q- I L.I- .L ' tp- LI I II- > v -- I-b I-n Lp i -p p I-' LL . I ' v . ' h I- p I " b . L L L L L L L L L .. L L L -L. .. 'Y .. T L p L Y L L. c. l :L :L I :- : I :L : :I. EL EL : IL :L :- EL -- L .1 L t- .1 L r .1 .1 or, f L>- L.. , Lr- IL I IL rI *5 .,n :'p :-p r Ir :-I. .- :-. -. I h ,_ I .L 1.. . b l n b p p I .- D I m L. .. > L. I. I p I. . I. p .-I. L T L V .. L - L V L L 3 w I L L. ' L : l L. L - L .- : . L L I I. L. >- r- L. - I- I- .- - - ~ I Lh- Lp- .I Lpr LJ~ LI 1:.I- i >-L L L .1L LI- :-» :L > I L L. I L L- . L. . L' L l h I. I : : I : : I : : :I : : : I : r : D 30 I 'b : rI 'r IY : '.: ' :Ih' b -: :p I ~: : -* o E L 2 L L L I L I. L L I \ - L J .L- I... ~ 4: I. ..J - . .J .L p- , o I : : I L : I : L E El : : : l : : I I I I Z l I I 1'. :l : I I: l : 7: : Z . I L L. V L E! L L L T .. L L L p . - n - - F I 5 :: I L L I L _I : : L I : 5 : I1 L .1 I; L-.I 0 Z. LE L. :J :.. ._.. L .1 L. : __L_ I i : - I: c I - : : .I L L L I : L L '0 II ~40- . : - g: I L :L -: .r -:I : L: - I - L: I : L : '3 O' ' I I -: :L L: -:I : :- : J' I : r' " L -I| ' p J| .I L..- -h 1 ]b. I.I .I- L.p- . L.I Lp . .-; : : : r. : 7. : : : : t ' V r- h. ' P- b l. I '1 l l o I'YTYI IIYVYYH i ITW' T 1 1 7. 'YTYYTTVI Y T7 1T I 1 VT 1111 '1', t1
0.014 0515 0.25 0.5 1,0 2 4 5.6 8 11.3 16 20 25 32 50 64
Sieve openings, mm
Figure 2 Particle size distribution of the aggregate in the indirect tensile test.
Mixing must be performed at a temperature where the kinematic
viscosity of the binder is 1702120 mmZ/s.
The material is divided into 10 samples for analysis which are stamped into test specimens with the aid of a Marshall compaction. hammer. The number of blows on each side of the test specimen is 50. Compaction is performed at a temperature where the kinematic viscosity of the binder
is 280130 mmZ/s.
5 of the test specimens are placed in a desiccator with distilled water. The desiccator is evacuated so that a residual pressure of 50:2 mm Hg (approx. 6.7 kPa) is obtained within 10:1 min. This residual pressure is maintained for 3 h, after which air is allowed to enter so that
atmospheric pressure is reached. The test specimens must then be left
immersed in water for a further 0.5 h.
The saturated test Specimens are conditioned at 40:10C for 68:2 h.
The volume of the test specimens is measured with the aid of a vernier gauge after stamping, water saturation and conditioning.
The "dry" and "wet" test specimens are stored in a water bath for 4:1 h
at lOilOC, the dry specimens being sealed in plastic bags.
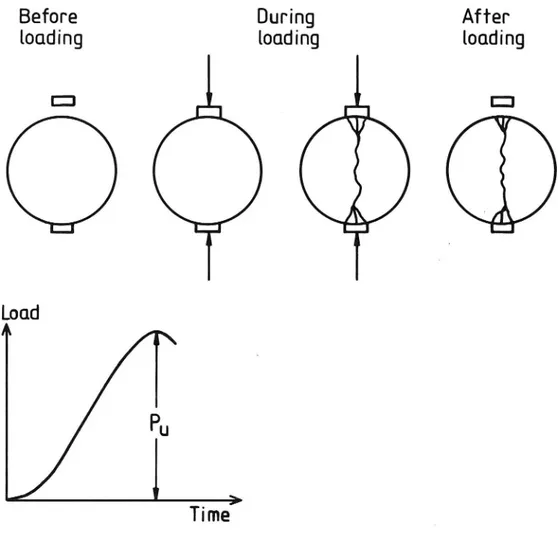
The test specimens are then placed on a steel bar and subjected to loading as in Fig. 3. The deformation rate is 50 mm/min. The tensile
strength, ST in kPa, is calculated as follows:
2000 P
.. _______LL
ST TE -d-D
where Pu = ultimate applied load, N d = thickness of specimen, mm D = diameter of specimen, mm
The adhesion coefficient, Q, is calculated as the ratio in % between the
tensile strength (mean) of the "wet" and "dry" test specimen. The
adhesion coefficient may be regarded as a measure of the water resistance of the particular bituminous mix.
Before
During
After
loading
loading
loading
[:1
_
I:
Load
4
Pu
Ti mer
Figure 3 Schematic diagram of the indirect tensile test.
3 OPTIMISATION OF THE ANALYSIS METHODS
Optimisation is defined here as determination of the effects of a number of test parameters on the results of the analysis. The para-meters investigated are shown in Table l.
Tablel Parameters investigated in optimising the rolling bottle
method and the indirect tensile test.
Rollig bottle method
Particle size of the
aggregate
Binder content
Density of the aggregate Testing temperature Hardening time after mixing
Drying temperature for the aggregate
Flask rolling rate
Indirect tensile test
Particle size distribution of
the aggregate Binder content
Method of mixing the material Method of producing test specimens Method of saturating test specimens
Conditioning time
Effect of freezing - thawing Testing temperature
Heating time Bar or plate Width of bar
The following is a summary of the results obtained in an investigation of each parameter. These are accompanied by reasons for the test conditions established in the preliminary test instructions, on which the later ring analysis (section 4) has been based. See Ref. 4 for a more
detailed description of the investigations. In some cases the results
have been difficult to interpret and earlier experience and "common sense" have had to' be relied on for determining the formulation of the
test instructions.
3.1 Rolling bottle method
3.1.1 Bagticlejize gf__t_he_agg_r_ega_t_e
Rolling bottle tests are performed with uniform aggregate; in this study the fractions 5.6 - 8.0 and 8.0 - 11.3 mm have beeninvestigated. The general results were the same in both cases, as shown in Fig. AL.
The 5.6 - 8.0 mm fraction was selected since it is considered that the risk of agglomeration with this fraction is less than with the 8.0 - 11.3 mm fraction. Agglomeration of the bitumen-coated particles into a large lump is not unusual in rolling bottle tests. The duration of the
lump varies from case to case (between 1h and 1 week). The fact that
the degree of mechanical action on the particles during rolling can influence the degree of coverage is not difficult to understand. A comparison between a test where the particles roll independently of each other and a test where the specimen remains as a lump during the whole test or part of it cannot therefore be made without reservation.
The lower agglomeration with the 5.6 - 8.0 mm fraction compared to the 8.0 - 11.3 mm fraction is due to the former having a smaller surface area where binding takes place and also a lower binder content.
100
5.6 - 8.0 mm
100
8.0 ~11.3 mm.
3A °/o by weight \0
3.0 % by walght
°\°
(9580
o
51180 .
" Ef; 60
§60- .
5 5§ 1.0
§w-U! GBANITE" CD GRANITE... 3 o /R0NNE 8 : /R5NNE20- / \GRANITE-
20
_
ZITE A DIABASE A ' g 0 ' T 1 0' ' 50 100 150 5.0 100 1 O Time,h Time,hFigurell Degree of coverage as a function of rolling time. Two
fractions (5.6 - 8.0 and 8.0 - 11.3 mm) from 4 different
aggregates. Binder B 180.
A binder content of 3.4% by weight for the fraction 5.6 - 8.0 mm
theoretically gives a thinner "binder film" than 3.0% by weight of binder with the 8.0 - 11.3 mm fraction. In order to further reduce the tendency to agglomeration it should therefore be possible to reduce the binder content. However, experience indicates that at the same time this reduces the capacity of the method to differentiate between aggregates, i.e. when the binder content is reduced, the difference in degree of coverage between "good" and "poor" aggregates also decrea-ses. One advantage of a larger particle size is that evaluation of the degree of coverage is facilitated.
Binder content
3.1.2
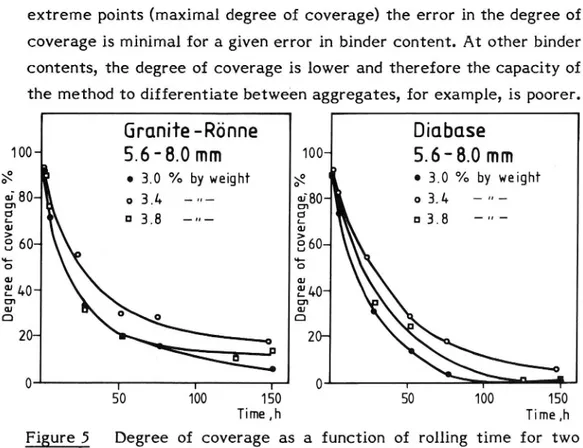
Three different binder contents have beenexamined (3.0, 3.# and 3.8% by weight for the 5.6 - 8 mm fraction and 2.6, 3.0 and 3.4% by weight for the 8.0 - 11.3 mm fraction). An illustration of the results obtained with the 5.6 8.0 mm fraction is given in Figure 5.
For the 5.6 8.0 mm fraction the binder content of 3.4% by weight has been chosen since the degree of coverage in this case is maximal. At extreme points (maximal degree of coverage) the error in the degree of coverage is minimal for a given error in binder content. At other binder contents, the degree of coverage is lower and therefore the capacity of the method to differentiate between aggregates, for example, is poorer.
Granite-Rome
Diobase
1004
5,6 -8,0 mm
100~
5.6- 8.0 mm
.\° o 3.0 °/. by weight °\° - 3.0 °/. by weight g80~ o 3.1. -~ 380a o 3.1. ~§
° 3-8 -~
g
a 3.8
-~
é
E60
5 5 OJ 0.! 8931.0-3
8
D D 20 o l l l 0 I I 50 100 150 50 100 150 Time.h Time ,hFigure 5 Degree of coverage as a function of rolling time for two different aggregates. Three binder contents and one fraction
(5.6 - 8.0 mm). Binder B 180.
10
3.1.3 Qegsity gf_the_aggregate
Variations in the density of the aggregate may influence the results of analysis for a given particle size of the aggregate and given binder
content (in % by weight).
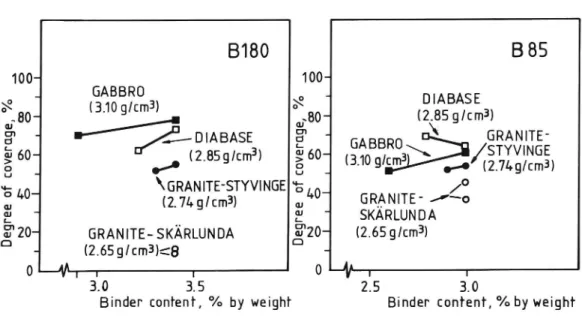
4 different aggregates (8.0 - 11.3 mm fraction) with densities in the range 2.65 - 3.10 g/cm3 and 2 binders (type B 180 and B 85 respec-tively) have been investigated. The binder content was 3.#% by weight
(for B 180) or 3.0% by weight (for B 85). In addition, binder content was
corrected for aggregate particle density so that the thickness of the "binder film" was the same for all 4 aggregates. The correction was made on the basis of the aggregate with the lowest particle density (2.65 g/cm3). If the binder content with this aggregate is 3.#% by weight the binder content with the aggregate with the highest particle
density (3.10 g/cm2) will be 2.9% by weight. The evaluation of the
degree of coverage was made after rolling for 214 h.
The results are illustrated graphically in Fig. 6. For the majority of
binder-aggregate combinations (excluding aggregate B binder B 85) a
small reduction in the degree of coverage is observed when the binder content is corrected (reduced) for increasing particle density. However, the effect of this correction is so small that it is accommodated within the "normal analysis error" (cf, for example, Fig. 6, Skarlunda granite
B 85).
The conclusion from this experiment is therefore that no correction in binder content for the particle density of the aggregate need be made.
ll
8180
B 85
100-
100-.0 - ($23523.
.80- /
x -
mag/cm»
8 -
U/E/DIABASE
8
GABBRO
'
GRANITE-e 60_
3
3W
\
STYVINGE
g _ .I. (2.859/cm) E (1109/0113 " (Zing/Ema)
-
\GRANITE-STYVINGE ~23 _
/0
31 0
(2. 7Ag/cm3)
who
GRANITE- / ~o
:2
:2
SKARLUNDA
§20-
GRANITE-SKARLUNDA
gzo
(2.659/cm3)
l (2.6Sg/cm3)<8
-0 V l l 0 v I l
3.0
3.5
2.5
3.0
Binder content, % by weight Binder content, % by weight
Figure 6 Degree of coverage as a function of binder content. The figure shows the effect of the particle density of the
aggregate (see text). 3.1.4 Testing temperature
One of many parameters considered as a possible influence on the water susceptibility of bituminous pavements is the hardness of the binder. The capacity of the water to repel the binder from the aggregate surface is considered to decrease with increased hardness of the binder
(6). Therefore the testing temperature may be regarded as influential
on the observed degree of coverage.
In order to eliminate the effect of binder consistency as far as possible, testing should be performed at the temperature corresponding to a certain hardness of the binder, e.g. a given number of degrees below the
softening point ("Ring and Ball") of the binder. However, this would
imply different testing temperatures for various hardnesses of the binder and would considerably complicate the analysis procedure.
Investigations have been made at 15, 20 and 25°C with 4 different aggregates and 2 binders of different hardnesses. No consistent
12
dency has been detected and room temperature (20:20C) has therefore been proposed as testing temperature.
Fig. 7 illustrates the results from rolling bottle testing at 200C with 3 different aggregates and 2 bitumens of differing hardness (B 85 and B 180). As can be seen, it has not been possible to demonstrate any effect of binder hardness in these tests. (Both bitumen samples are taken from the same crude oil source and bitumen supplier).
13
Degree of
covf/Euge Granite 'Skdrlundu
100
ZOOC
30 -* 60 -40 20 06
I21.
T 1 r#8
Time, h72
Degree ofcovfruge
. .
Quartzite - Ullerud
/O O
100«
20 C
80" 60- \ 40 . 88520-
d
B180
§
0
T
5
21.
'
£3
7'2
Time, h Degree ofcovfmge
Diabase - Forserum
/o o
100«
20 C
- \ x 0 '4 \ ao~ B180 40 20-0 T 1 ' TineJiFigure 7 Degree of coverage as a function of rolling time in testing with binders of differing hardness.
14
3.1.5 gardening ti_r_n_e_afte_r_mix_i_ng
Experience from Denmark (7) has indicated that the hardening time (time between mixing and testing) may influence the results of the analysis. To determine whether this is so, tests have been carried out with a hardening time of 16 and 184 h respectively at room tempera-ture.
The results indicate that hardening time is not a significant parameter
(see Fig. 8 for an example of the results). However, it should be noted
that the Danish experience mentioned above is based on investigations where the bitumen contained an adhesive agent, which was not the case in these investigations. With an adhesive agent in the bitumen, a considerable higher degree of coverage is obtained with specimens
hardened for 1 week compared to specimens hardened overnight (7).
Because of these results, it appears essential to standardise the hardening time in order to include tests where the binder contains an
adhesive agent. The specified hardening time ("overnight") has been
chosen for practical reasons; mixing is performed one afternoon and the rolling tests are started the following morning.
15
Degree of
coverage o -o GRANITE-SKARLUNDA STORAGE TIME 184 h °/. o -o ~ ~ 16h 100« H GRANITE-RONNE - u 131. h .____. u ll O I I I l T l 3 g 20 #0 60 80 100 120 140 160 Time, h Degree of
coverage
n o DIABASE STORAGE TIME 18L h
0/0 D D - n " -1001 H QJARTZITE u 184 h bi _ u " " " '_ h 80-60 40 20 0 l r l 20 A0 60 80 100 120 140 160 Time,h
Figure8 Degree of coverage as a function of rolling time. Two different hardening times and 4 different aggregates. Binder 885.
3 . l .6 eri g_t_e_mpeiatugejgr_the_agg£egat_e
Certain laboratory experiments (8) have indicated that the drying temperature for the aggregate may influence the results of rolling bottle tests. Differences in the degree of coverage have been measured with aggregate dried in the drying drum at the asphalt plant or with aggregate kept in storage for some months. In both cases, the aggregate
16
was dried at 150°C prior to testing.
In this project, a comparative investigation has been carried out with aggregate dried at 150 and #000C respectively. The latter temperature may appear extreme, but the aggregate surface may quite possibly attain a temperature of l£000C when it passes the open flame in the drying drum at the asphalt plant.
Normally a higher degree of coverage has been obtained when the material has been dried at the higher temperature, as illustrated in Fig. 9. The drying temperature is therefore significant for the results and should for this reason be standardised. For practical reasons, the aggregate is first dried overnight at 110:50C and is then heated to the temperature at which it is mixed with the binder. The mixing tempera-ture depends on the hardness of the binder (e.g. 150°C for B 180 and
165°C for B 85).
Degree of
o__o
o oGRANITE-SKKRLUNDA DRYING TEMP. 400'c
_.._
_..
150'c
@ij99
/.
o o GRANITE - RGNNE
,__.
- u
400°C
_., __
_... _
150'c
100
80 60 40-20'Figure9 Degree of coverage as a function of rolling time. Two different drying temperatures and 2 different aggregates. Bitumen B 180.
17
3.1.7 Bolling rate_f_or_bgtt_l§_s
The rolling rate for the bottles influences the mechanical action on the particles, which in turn may influence the degree of coverage.
The degree of coverage has been evaluated after rolling at 3 different
rates. Different combinations of aggregates and binders have been
studied.
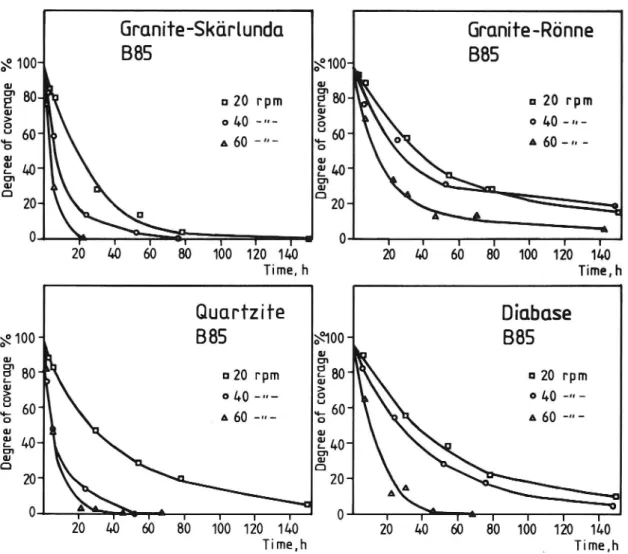
The general results are as expected; a high rolling rate normally leads to a low degree of coverage. An example of the results is given in Fig.
10.
At 60 rpm the degree of coverage is low for all the systems investi-gated. At this rate, it is thus difficult to rank the systems from the aspect of adhesion. In the test instructions, the rolling rate has been standardised at 40 rpm. However, nothing in the investigation indicates that this is a more suitable rate than 20 rpm. 40 rpm has been chosen because this rateis used in the majority of the tests performed so far with the rolling bottle method in various laboratories. Furthermore, it
may be assumed that the problem of agglomeration decreases with
increased rolling rate. In those cases where the binder contains an adhesive agent, a rolling rate of 60 rpm must be used. This means that when the effect of an adhesive agent is to be evaluated, also those
systems whose binders lack an adhesive agent must be rolled at a rate
of 60 rpm.
l8
Grunife-Sk'cirlunda
Grunife-Rdnne
g 100 885 gmo 885 0 & En a rpm 2 80 I: rpm 0 g E 8 60 0 -u-6 A -h-E 40*
92'40-3
8
D 20-
D
20-0 O l I I I I l I 20 40 6O 80 100 120 11.0 20 40 60 80 100 120 11.0 Time, h Time,hQuarfzife
Diabase
°\° 100 w
885
$100 -
885
cu 3» § 80* 1320 rpm $80 a 20 rpm%
040 -~-
§
040 -~
5 60 A 60 -~- 5 60 A 60 "" 81 8 r9 40- .940-20- . A A 0 A v I J l I 1 r 0 l l I ; l I I l 20 40 60 so 100 120 140 20 40 60 80 100 120 140 Time.h _ Time,hFigure 10 Degree of coverage as a function of rolling time. 3 rolling rates (20, 40 and 60 rpm) and 4 aggregates. Binder B 85.
19
3.2 Indirect tensile test
32.1
Earticiegizs Eistriéuiiemofthe aggregate
The particle size distribution of the aggregate is a vital parameter in assessing the water susceptibility of bituminous pavements. This para meter greatly influences the voids ratio in the pavement, which in turn affects penetration of the pavement by water.
The particle size distribution generally used in these investigations (see Fig. 2) has been chosen to give the Marshall test specimens such a high voids ratio that water can easily penetrate the specimens. If a system is chosen that provides an insufficient voids ratio of the test specimens, these cannot absorb water and the basic condition for determining the water susceptibility of the pavement is not fulfilled. In discussing the voids ratio, it is normal to speak of two types of voids, namely "open" and "closed". Closed voids consist of enclosed pores inaccessible to water. In a total voids ratio of 4% by volume, only about 10% is open space, according to American information (9), Le. approximately 0.4% of the volume of the test specimen would befilled with water. The effect of water on such a pavement would therefore probably be slight. To accelerate the effect, test specimens with a higher voids ratio
should be investigated.
4 different mixes of an aggregate and one bitumen have been investi-gated. In every case, the binder content was 5.4% by weight and the particle size distribution of the aggregate as in Fig. 11 (curves drawn on. the basis of the weighed quantities of the fraction; a certain crushing of the aggregate occurs during mixing and compaction).
The results are summarised in Fig. 12 where the mean adhesion coefficient is set against the mean voids ratio. A tendency to a reduction in the adhesion coefficient with increasing voids ratio can be seen. However, it should be noted that determination of the adhesion coefficient is accompanied by much uncertainty. Statistical analysis, for example, shows that the means for the adhesion coefficients represented by points I and 2 in Fig. 12 do not differ significantly from
20
each other (5% risk level). However, the difference between points 1 and 3 and l and 4 respectively is significant.
IOO
T.- .-I t >t :u y-t p. II .: T L p- » b I- b -p r h- .- h- h- h l-c : : : : : : I : OJ : r : : : : : l : > w : p p u p F- T D-CU ; . : : : : : : -Vi c.E L: :.: :L :.: L: t-c :-g i- r > >- b- > - p p P p \ p cu 60 _ . . . . 1: E : i E : E : T E 4 rt. : E'p -: L: LL r I,. c b- b- p u h C I h-an 70 c > b > h i' | ' ' C r hP rh .p bn hr- pi- r u L L L L L L > o '- v- r- » u- p In : ' ' ' ' I m L t : : : i i 5 c E : : . : : : a e :-i- :~» :-p :~F t~ :~- /I I- ». b I. h p v- I, .. r y. . . .. y b I u :1: EZ. :T. iL 1E. E _/P/ I Eq7. L p p- » t: I- t > w r p p r. > > 3 r l» .- . VI .- p .: : : : : : /: _' : L ,1 L I. L ' ~ I' L >* E :. :. :. :.. .. / cI . :» D 30 r h F " " A . 1 E :P :- i V --y 1 E \° 5- r. L E /: .I: I L o t E t , : / t ; r 20 . . : r :1 I v .' l : L p _ 7 > c P : : /: o 5." E : L i h L / I. I E | :" E i- r- : p. E '0 vp : :j : 7/:v : r. jY C : I : Ir..". : . 4? ~ 52-!" E : E I E P n- i a. u- > -- "' _-. oL-" ' E- P Feat-Junotloo _ : y: ; t o : : : IE : : [I C I a I It 7 TT iI*7 ?YTTi Tv 1 it n V l 1 Ti r l n ' l : 003010 on 0.2 0.35 0.40.5 to I: 2 b A 5 6 mil IS. 0m 0.25 5.6 8 II: M: Sieve openings, mm
Figure ll Particle size distributions Of the aggregate (see text).
Adhesion coefficient 1 °/o 80 I 60 40" w. . 20-l l I l T 2 l. 6 8 10
Voids rutio,°/o by volume
Figure 12 Adhesion coefficient as a function of the voids ratio (see
text).
21
3.2.2 §19d§r_cgn_t_en_t
The binder content may influence the water susceptibility of the pavement in at least two ways. First and foremost, the binder content influences the voids content of the pavement. For a given particle size distribution of the aggregate, increasing binder contents may also lead to a thicker "binder film" around each particle, which could hinder water from penetrating between the binder film and the aggregate.
4 different specimens of one and the same aggregate and binder
respectively but with varying binder content (4.6 - 6.8% by weight)
have been investigated. The particle size distribution of the aggregate
was in every case the "normal" one (see Fig. 2), Le. as used in the
standardised method.
The results are summarised in Fig. 13. The voids ratio of the test
specimen has been calculated from its height and diameter, the density
of the aggregate and the binder and the binder content. The results are interesting. Above a certain binder content, the adhesion coefficient appears to be "constant". An increase in "binder film thickness" above a certain value would not therefore bring any improvement to the water susceptibility of the pavement. Furthermore, a higher binder content leads to a lower voids ratio and theoretically also better resistance to water. However, it should be remembered here that the voids ratio has
been relatively high the whole time.
Further investigations are required before more definite conclusions can be drawn concerning the influence of the binder content on the water susceptibility of the pavement.
22
Adhesion Calculated
coefficient voids ratio
0/0 cyo volume 100 - -20
80_
/ Vonds ratio
0 \ 0 \ \0\ \ 60 4 \0 ~10 40 a .\Adhesion
coeffiuent
20 a o W l l l l 4.6 5.4 6.1 6.8Binder content (% by weight)
Figure 13 Adhesion coefficient and calculated voids ratio as a function
of binder content (see text).
3.2.3 Me_ c_h9_d_of mixing
When mixing binder and aggregate in the laboratory, a laboratory mixer
is normally used. The American standard (10) has earlier prescribed
manual mixing, but from 1981 onwards the use of a laboratory mixer is recommended (manual mixing is still permitted, however). Some labo-ratories in the Nordic countries also use manual mixing.
Both methods have their advantages. In the case of mixing in a laboratory mixer it is primarily the aspect of time that should be emphasised. Weighing, mixing and division of the material for 10 Marshall test specimens, for example, should take considerably less time than weighing and manual mixing of 10 different batches each giving 1 test specimen. The advantage of manual mixing is that the
23
need for division is avoided, which leads to test specimens with the same total composition (the test specimen need not for that reason be "homogeneous"). Furthermore, manual mixing has probably less mecha-nical effect on the aggregate than mixing in a laboratory mixer. However, this need not inevitably mean that the particle size distri-bution of the aggregate in a "manually mixed" test specimen is near the theoretical ("weighed in"). Considerable crushing of the aggregate may of course occur during compaction.
Does manual mixing of the material lead to better repeatability in the determination of indirect tensile strength than mixing of the material
in a laboratory mixer? A comparative investigation has been made in
order to throw some light on this question. Nothing in this investigation indicates that manual mixing would be advantageous compared to using
a laboratory mixer. (It should be noted that the statistical basis (4) for
this conclusion is very limited). The test instructions therefore recom-mend the use of a laboratory mixer since this procedure is probably less time-consuming than manual mixing, although the latter is still
per-mitted.
3.2.4 Method}; manufacturing _t_e_s_t_spegir_n_e_ns
All over the world, the dominating method of manufacturing test specimens of bituminous material is Marshall compaction. Many re-searchers have criticised this procedure, partly because the compaction that is achieved in a Marshall hammer does not resemble that produced under a road roller. That the Marshall procedure remains dominant, despite criticism, is because the equipment is relatively inexpensive and the procedure relatively simple.
Perhaps the simplest method of manufacturing test specimens is to statically load the bituminous material in a mould. However, the same criticism can be levelled against this procedure as against the Marshall procedure. The "static" method is used in one or two laboratories (l 1) when assessing the water susceptibility of a pavement. A load of 15 kN is applied "momentarily". The load is allowed to act for 5 minutes, after which the mould with the specimen is inverted and the loading
24
repeated. Water conditioning takes place with unpacked material. The advantage of this procedure is that exactly the same particle size distribution of the aggregate as in practice can be used in laboratory testing. The procedure with water conditioning of an unpacked material
is also used in another method for investigating stripping (12).
A variant of this "static" method has been investigated (it). However, nothing in the results indicates that it would be beneficial to use this
method, since there is no gain either in time or precision. 3.2.5 Method}: saturatigg_th_e_t_e_st specimen
When testing the water susceptibility of a pavement, the "open" voids of the specimen must first be filled with water. Normally, a vacuum is used to expedite this process.
The German standard contains a method for determining the quantity of
water that a test specimen can absorb (13). The method prescribes the
use of ice water to prevent a volume increase of the test specimen during saturation with water. This procedure will be referred to in the following as the "DIN method". The risk of volume change in the test specimen during water saturation under vacuum has motivated certain researchers in the U.S.A. (9) to question this procedure. Instead, a method has been proposed in which saturation is achieved by applying over-pressure. However, discussion in the U.S.A. seems to have led to a compromise. According to test instructions published in 1984 for determining the water susceptibility of pavements by indirect tensile test (14), water saturation can be achieved by "applying a partial vacuum such as 20 in. Hg for a short time such as 5 min."
The Danish Asphalt Industries' Research Laboratory for Road
Construc-tions (AOV) has used a simplified procedure for water saturation (7).
The mantle surface of the test specimen is first enclosed in a "rubber sock" after which water is sucked through the test specimen with the aid of vacuum applied to one end surface. The vacuum is produced by water suction equipment. The test specimen is assumed to be
25
saturated when water streams out of the specimen on its "vacuum side". The procedure is quick (normally 1 - 10 min.) and requires no advanced I equipment.
A number of investigations have been conducted at the AOV to compare the "DIN" and "AOV" procedures. The results are shown in Table 2. Two aggregates and one binder were used. After water saturation the test specimens were conditioned for 3 days at 40°C or 1 day at 60°C after freezing. The results are interesting. With some reservation for the relatively limited number of tests, the following conclusions can be
drawn:
- No significant difference in adhesion coefficient is obtained if the
test specimens are water saturated according to DIN and AOV procedure. With the open test specimens involved here, it would therefore be possible to use thesimpler Danish method.
On the other hand, different values for the adhesion coefficient are obtained when the water-saturated test specimens are conditioned in different ways. However, the results are not easily interpreted. For example, higher adhesion coefficients were obtained with gra-nite after freezing and storage for 24 h in 60°C than after storage for 72 h at 40°C. For quartzite the relation is the opposite.
26
Table 2 Adhesion coefficients obtained in tests on specimens water-saturated according to the "DIN" and "AOV" methods.
Aggregate Method of Method of Calculated Adhesion conditioning water- voids ratio* Coefficient
saturation % by volume 96 Granite- 72 h at 40°C AOV 12,9 63 Skéirlunda DIN 13 , l 64 Freezing + AOV 11,5 » 78 24 h at 60°C DIN 11,8 75 Quartzite- 72 h at 40°C AOV 12,4 89 Ullerud DIN 12,9 94 Freezing + AOV I4 ,2 49 24 h at 60°C DIN 15,6 45 *) mean of 3 specimens 3.2.6 _C_o_r1dit_i_ogi_qg_t_i_m_e_
The two factors that more than all others can influence the "stripping process" in conditioning of water-saturated test specimens are tempe-rature and time. In earlier experiments, it has been found that the reduction in tensile strength of the test specimen in water storage is slow if storage takes place at room temperature. After 7 days storage
the adhesion coefficient for the investigated system was still almost
100%. If, however, the temperature was raised to 40°C, the adhesion coefficient fell to about 50% after only 3 days. On the basis of these results it was not considered worthwhile to condition the water-satura-ted test specimens at a lower temperature than 40°C. At the same time, it was considered that higher temperatures, e.g. 60°C as proposed
by Lottman (15) among others, were "somewhat unrealistic" (such
temperatures hardly ever occur in pavements except at the surface in extreme cases).
The effect of storage time has been evaluated for storage at 40°C.
Tensile strength has been determined for test specimens stored for 16 h, 3 days and 7 days respectively. Two aggregates and two binders have been used. The results are shown in Fig. 14. With one exception the
27
results are unambiguous and predictable; the adhesion coefficient decreases with increasing storage time. No effect of binder hardness
can be observed. Adhesion coefficient as 100- 80- 60-40- . GRANITE-SKARLUNDA +885 0 GRANITE-SK/XRLUNDA +8180 20- I QUARTZ E-LKLERUD +885 0 QUARTZITE-ULLERUD +8180 0 I l l 16 72 168 Storage time, h
Figure 14 Adhesion coefficient as a function of conditioning time (see
text).
28
3.2.7 _E_ffeg_t__o_f_ freezingjhawing
Repeated freezing-thawing has been assumed by a number of re-searchers to influence the stripping process in a bituminous pavement and has therefore been included as a part of conditioning of the test
specimens in laboratory testing (15).
In order to gain an idea of the significance of repeated freezing-thawing a group of test specimens was exposed to freezing to -lO°C overnight (about 16 h). The test specimens were then placed in a water bath at #00C for one day. This freezing-thawing was then repeated, after which the specimens were frozen to -100C. Finally the specimens were heated to +lO°C for 6 h. A second group of test specimens was conditioned in the "normal" way (see section 2), i.e. 3 days at 40°C and then stored for 6 h at +100C.
The results are very difficult to interpret (4). The procedure with
freezing-thawing gives higher adhesion coefficients ("better water resistance") than the normal procedure. It is also interesting that in a visual assessment of the "degree of coverage" in the fracture surface, a tangibly higher degree of stripping was found in the test specimens exposed to "freeze thaw cycles" than in those conditioned in the "normal" way.
322.8
Testing temperature
The formula for calculation of tensile strength (see section 2) has been
derived under the assumption that the material in question is elastic. By choosing a low testing temperature and short loading duration (high deformation rate) it is possible to approach the elastic condition of the particular material.
In the indirect tensile tests described in this report the deformation rate has for practical reasons always been 50 mm/min. i.e. the rate specified for determining Marshall stability. The choice of another deformation rate would force most laboratories to purchase new and more advanced pressure equipment.
29
With regard to testing temperature, both room temperature and lower temperatures have been proposed. For practical reasons, it would of course be convenient to conduct testing at room temperature but for theoretical reasons (see above) lower temperatures are preferable. However, testing at lower temperatures requires special equipment and the lower the temperature used, the more advanced this equipment must be. Testing at temperatures below +5°C is therefore probably not
realistic other than in research laboratories.
Testing has been performed (4) where determination of the tensile strength (see Section 2) took place at 20, 10 and 5°C respectively. No
general trend can be traced in the results. In the test instructions
(Section 2), 10°C has been proposed as testing temperature. Testing at this temperature is easily performed in practice.
3.2.9 eating time
The necessary time for reaching the testing temperature has been investigated. Here, the temperature transmitter has been drilled into Marshall specimens of non-porous asphalt concrete. Figure 15 shows that a test specimen at +40°C requires at least 3 h to attain a temperature of 10°C if placed in a water bath at this temperature.
3.2.10 _B_a£ gr_pla_t_e:?_
Certain researchers, e.g. Lottman (15) use a plate instead of a bar when
pressing test specimens. This procedure increases the contact area between the plate and the test specimen during pressing, which is not
the case when the bar is used. In calculating indirect tensile strength,
Lottman has introduced a correction for the increase in contact area.
A comparison between bar (width 10 mm) and plate has been made (it).
The Marshall test specimens consisted of sand asphalt (85% by weight sand, 0-2 mm, 10% by weight of limestone filler and the rest bitumen B 85) with a voids ratio of about 20% by volume. The test specimens, which had been hardened at 60°C for 117 days prior to testing, were
investigated in dry condition after storing overnight at 5 and 10°C
30
respectively.
Nothing in this investigation indicates that higher measuring precision would be achieved with a [plate than a bar. However, it should be emphasised that here 0 - 2 mm material has been used while the
"normal method" (Section 2) prescribes material 0 - 12 mm. In addition,
no water-conditioned test Specimens have beeninvestigated.
1+0 :
a 30* G) 23'C(room temperatureI OLO C
L
\@
Q) AO'C c-10 C
9. 20. -10'c - 1.0T 3 _ o _. 00 49: ® ® 10 C 1 C a 10 Ja E ,1 .0
\o
10 . , ' 1 2 3 Time,hFigure 15 Temperature/time relation in tempering test specimens (see text).
3.2.11 idth gf_the_bar
In determining indirect tensile strength, bars with a width of 12.7 mm, i.e. 0.5 inch, are often used outside the Nordic countries. An adaption to the 51 system would be desirable, i.e. the 10 mm width would be more appropriate from this aspect. Other reasons for choosing the
10 mm width may also be cited. In deriving the formula for calculating
sectional strength (see Section 2) it has been assumed that the relation between the width of the bar and the diameter of the test specimen is
$0.1, i.e. for Marshall test specimens with a diameter 5.10 cm the width
of the bar should be at most 10 mm.
Comparative investigations with bars 12.7 and 10 mm in width (4) have
31
been performed. The results are difficult to interpret. With 10 mm bars a certain depression (2 3 mm) of the bar was observed in the test specimen. A bar with awidth of 12.7 mm has therefore been proposed
in the test instructions.
4 RING ANALYSIS
Preliminary test instructions for the rolling bottle method and indirect tensile test (ll) have been drawn up on the basis of experience from the investigations described in the preceding sections.
The precision of the methods has been evaluated through aring analysis (5), in which a total of 9 laboratories in Finland, Denmark, Norway and Sweden participated. According to ASTM C 802, which describes how a ring analysis is to be planned and conducted (16), at least 10' labora-tories should participate in the ring analysis if a good estimate of the precision of the method is to be achieved. In this particular ring analysis only 8 laboratories participated in each method. Since a larger member of materials and analysis specimens than specified as a minimum in ASTM C 802 were investigated, the ring analysis should nevertheless lead to representative measures of precision.
6 different aggregates (2 granites, l quartzite, l diabase, l gabbro and l limestone) and l binder (B 180) were included in the ring analysis.
54.1 The rolling bottle method
Each laboratory examined 3 analysis samples (3 bottles) of each aggregate (5.6 - 8.0 mm fraction). Working independently of each other, three observers assessed the degree of coverage at 4 different occa-sions during a 3-day period. In the statistical evaluation, the 3 analysis values for the same sample recorded by each observer were combined
into one result.
Fig. 16 shows graphically how the mean of the degree of coverage varies with rolling time for the 6 aggregates in 2 of the laboratories. As
32
can be seen, the pattern of results is not the same in the two
laboratories.
Fig. 17 illustrates the laboratories' means for the degree of coverage for the 6 aggregates after #8 h rolling. As can be seen, the variation in the ranking of the aggregates by the laboratories is tangible. The dispersion between the different laboratories is especially great for
quartzite and diabase (see below).
The mean degree of coverage for all laboratories as a function of rolling time for the 6 aggregates is shown in Fig. 18. The dispersion
(standard deviation) around the mean (within one laboratory and
be-tween the various laboratories respectively) is also given in the figure
for two of the materials.
Table 2 gives measures of the dispersion (standard deviation and coefficient of variation re5pectively) in an analysis according to the rolling bottle method when the analyses are performed in one labora-tory and in several laboratories respectively.
33
Degree of
Laboratory No. 4
coverage CI DIABASE FORSERUM
%
A QUARTZITE ULLERUD
o GRANITE SKARLUNDA
100
- GRANITE STYVINGE
-\
v LIMESTONE HEJDEBY
\
- GABBRO KALLAX
80 . 604 40-4 20-0 T l 7 76
24
1.3
72 Time, h
Degree 0
Laboratory No. 6
coverage
%
1oo
80a 60" 40 20" 1 6 21+ 48 72 Time, h
Figure 16 Degree of coverage as a function of rolling time at 2 different laboratories. 6 different aggregates.
34
De ree of
covgemge Rolling firne 48h Laboratory
0/o 1 oO. 100 2 a 3 A m4 0 0 6 o 7 I 60" 8 ' 9 O AO~ 201 0 T T T T I
(mums GRANITE oumr- GABBRO DIABASE LIMESTONE sxAR- srvv- Z'TE KALLAX FORSE- HEJDEBY LUNDA INGE uuenun RUM
Figure 17 Degree of coverage (mean of 9 analysis results) after 48 h rolling. 8 different laboratories and 6 different aggregates.
35
Degree of
All laboratories
coverage (Within laboratory)
%
n DIABASE FORSERUM
A QUARTZITE ULLERUD
100
o GRANITE SKARLUNDA
0 GRANITE STYVINGE v LIMESTONE HEJDEBY 80 ' GABBRO KALLAX 60-40_ 20-0 l , I I6
24
48
72 Time, h
De ree of _mirage
All laboratories
°/° (Between laboratories) 100-I 72 Time, h 0 : Nb It CD
Figure 18 Mean degree of coverage (all laboratories) as a function of rolling time for 6 different aggregates. Dispersion (standard
deviation) within the laboratory (upper figure) and between the laboratories (lower figure) is also given for two of the
aggregates.
36
Table 2 The rolling bottle method. Estimated precision at different
degrees of coverage.
Degree of Precision Precision
coverage (within a laboratory) (between laboratories)
% Standard Variation Standard Variation deviation* coefficient* deviation* coefficient*
6 32 11 65 <30 2-10 15-56 #- 19 29-114 10 23 17 #0 30 60 7-16 13-28 9-26 24-66 8 10 18 24 >60 4-10 5-16 11-28 12-46
* mean and range of variation respectively
The results show that the standard deviation is in general the same at
different degrees of coverage while the coefficient of variation varies with the degree of coverage. The standard deviation is therefore the more suitable measure of precision for the rolling bottle method.
Figures 16 - 18 and Table 2~also show that uncertainty is very great in rolling bottle testing. One reason may be the subjective assessment of the degree of coverage. Light-coloured aggregates such as quartzite may be rated too low a degree of coverage, while darker aggregates such as diabase may be overrated. Certain aggregates, of which quartzite is again an example, may demonstrate a tendency to agglome-ration. This in turn gives less "mechanical action" in rolling than if the individual particles were able to move independently of each other. Thus the "adhesion characteristics" of the particular aggregate may be
overrated.
The large dispersion in the results of testing with the rolling bottle method indicates that this is at most suitable for a rough assessment of water susceptibility of various combinations of bitumen and aggregates. Eventually, it may be possible to divide aggregates into 3 groups
("poor", "normal" and "good") with regard to water susceptibility after
testing with the rolling bottle method.
37
The rolling bottle method should also be usable for evaluating the
effect of different types of adhesive agent. However, it should be noted
that the present test instructions apply to passive adhesion, since the aggregate is dry when mixed with bitumen.
4.2 Indirect tensile test
8 laboratories participated in this ring analysis. Testing was performed in the way described in Section 2; however, water saturation took place at a residual pressure of 20 mm Hg instead of 50 mm Hg.
Fig. 19 shows the laboratories' means for the adhesion coefficient with the different aggregates. As can be seen, the laboratories can be divided into 2 groups. Closer study reveals that the laboratories (Nos. 1, 2, 6 and 7) which reported low adhesion coefficients also reported comparatively high volume increases in the test specimens during water saturation and conditioning. This volume increase may have led to lower tensile strength, which may in turn have reduced the adhesion
coeffi-cient.
The mean adhesion coefficient for all laboratories is shown in Fig. 20, where the dispersion (standard deviation) within a laboratory and between the laboratories is indicated for each aggregate. Fig. 20 indicates that the precision of the method depends on the type of aggregate; for example, the dispersion in the results between different laboratories is greater for quartzite than for the other aggregates.
38
Adhesion
coefficient
0
LaboratoryNo.
/0 1 o 100~ 2 a 3 A 80g 4 0 5 o 6 I 60 7 ' 9 o 40- 20-0 l 1 I T i l
GRANITE GRANITE QUART- GABBRO LIME- DIABASE
ZITE
ULLERUDKALLAX STONE FORSERUMHEJDEBY
STYV-INGE SKAR-LUNDA
Figure 19 Adhesion coefficient (means) for 6 different aggregates in 8
different laboratories. v Adhesion coefficient A T T +Between 100 I I I laboratories
I
L . .
30- I T Ir : Wlfhln I , laboratoryiT
Ir
2
n
60 q T
T
IL
F
I. '
r * I
I
°
r l
if I ' I l
I
l l
20- .I. I 0 I l l l l IGRANITE GRANITE QUAR'T- GABBRO LIHE- DIABASE SKAR- STYV- ZITE KALLAX STONE FORSERUM LUNDA INGE ULLERUD HEJDEBY
Figure 20 Adhesion coefficient (mean for all laboratories) for 6
different aggregates. The dispersion (standard deviation) within the laboratory and between the laboratories is also given.
39
Table 3 summarizes the dispersion that may be expected in indirect tensile test. The given dispersions (standard deviations and coefficients of variation) have been calculated on the basis of all the aggregates investigated.
Table 3 Estimated precision of the adhesion coefficient in indirect tensile test.
Indirect Standard deviation Variation coefficient
mean range of mean range of
variation variation
Within laboratory 8 5-12 14 12-18
Between laboratories 33 18-52 61 45-95
From the results it may be interpreted that the precision of the method in analysis within a laboratory is "reasonable", while the precision between laboratories is completely unsatisfactory.
What has been said about the validity of the rolling bottle method
(Section #.1) is in general. also applicable to indirect tensile test.
5 DISCUSSION AND GENERAL CONCLUSIONS
The investigations described in this report have been aimed at evalua-ting two laboratory methods - the rolling bottle method and indirect tensile test - with regard to their capacity for predicting the water susceptibility of bituminous pavements. Both methods demonstrate advantages and disadvantages as testing methods. Testing with the rolling bottle method, which is a variant of the dynamic immersion test, is relatively simple to perform. However, disadvantages may also be pointed out, the most tangible being visual assessment of the water susceptibility of the combination of materials, i.e. subjective assess-ment, which contributes to great uncertainty of the analysis results. Attention should also be paid in this context to the difficulty of making an "objective" assessment of the degree of coverage of light and dark
4O
aggregates respectively; there is a risk that the degree of coverage in these cases will be either underrated or overrated. Finally it should be noted that particles of certain aggregates (e.g. quartzite) display a
tendency to agglomerate into large lumps. In this case, the mechanical
action to which the specimen is exposed during rolling is less than if the bitumen-coated particles roll independently of each other. The water susceptibility of such materials may therefore be underestimated in rolling bottle tests.
Among the disadvantages of the indirect tensile test is the fact that it is considerably more time-consuming to perform than the rolling bottle method. However, indirect tensile test must be regarded a somewhat more "realistic" test than the rolling bottle method, at the same time as it is also "objective" in the sense that it measures a physical characteristic of the specimen (tensile strength). According to current methodology (Section 2) specimens are investigated with predetermined particle size distribution of the aggregate. The method would of course be more generally applicable if there were no such limitation. Standar disation of testing of a porous pavement is intended to allow water to penetrate the specimen throughly and the risk of a volume increase at water saturation (in vacuum) is probably lower than for test specimens
of dense asphalt concrete. In the ring analysis performed (Section 1+) the v
volume increase at water saturation has in some laboratories been so great that it has probably influenced the results in the determination of tensile strength, despite the high voids ratio. By introducing a predeter-mined particle size distribution of the aggregate, indirect tensile test cannot provide a clear idea of the water susceptibility of a given pavement. What this test offers (in the best case) is information on the adhesion properties in the presence of water for the material combina-tion investigated.
In the optimisation experiments (Section 3), the results have in many cases been difficult to interpret. In such cases, "practical regard" and "common sense" have had to determine the design of the test
instruc-tions.
The ring analysis (Section ll) has clearly shown that the precision of the
41
two methods is unsatisfactory. A contributory reason for the large dispersion is probably insufficient experience of the methods at several laboratories participating in the ring analysis. Continued usage of the methods will therefore probably improve precision.
In the Nordic countries, no attempt has so far been made to determine the validity of the laboratory methods through field experiments. Such tests are time-consuming and it is difficult to draw definite conclusions from them, since many factors other than water susceptibility may influence pavement function. Nevertheless, it is necessary to perform such a validation if the two laboratory methods are to be "trustworthy".
6 ACKNOWLEDGEMENT
The authors would like to thank the Committee on Binders in the Nordic
Association for Road Engineering (NVF) Committee 33 (Pavements) for
initiating this project and others, who have actively participated in this work. Particular mention is given to Johan Sandvik of the Asphalt Industries Laboratory in Norway, Erik Nielsen of the Danish Asphalt Industries' Information Office for Road Research, Petri Peltonen of the National Technical Research Centre, Finland, and Martti Leinonen of Neste Oy, also in Finland.
10.
ll.
42
REFERENCES
Magizadeh and F.N. Brovold. "Effect of water on bitumen
aggre-gate mixtures". HRB, Special Report 98 (I968).
A-M Ajour. "Le probléme de l'adhésivité liants hydrocarbonés
granulets". RICEM Cahiers 17 BM/no 3 (1979).
U. Isacsson. "Vidhéiftning i bituminosa belaggningar. En litteratur-utredning". Statens véig- och trafikinstitut, Linkoping, Sweden. Meddelande No. 6. In Swedish.
"Laboratoriemetoder for bedomning av bituminosa belaggningars vattenkanslighet - inflytande av olika forsoksparametrar". Nordiska Véigtekniska Forbundet, Utskott 33 "Asfaltbelaggningar".
Binde-medelskommitten. Rapport 11 (1983). In Swedish.
"Nye vedheftningsmetoder". Nordisk Vegteknisk Forbund. Utvalg 33
"Asfaltbelegninger". Rapport No. 4 (1985). In Norwegean.
D. H Mathews. "Adhesion of bituminous road materials: A survey of
present knowledge". 3. Inst. Petrol. M (1958) 423.
E. Nielsen. Danish Asphalt Industries Information Office for Road Research. Hvidovre, Denmark. Personal communication.
J. Bjorkbom. Armerad Betong - Végforbattringar, Stockholm,
Sweden. Personal communication.
D. Smith. NAPA Annual Convention, San Francisco, Feb. 1982.
Contribution to discussion.
ASTM D1559. "Resistance to plastic flow of bituminous mixtures using Marshall apparatus".
J.F. Christensen, Skanska, Lomma, Sweden. Personal
communica-tion.
12. 13. l4. l5. 16. 43
A. Zvejnieks. "Fett- och hartsaminer som tillsatser till bituminosa
bindemedel". Statens Véiginstitut, Stockholm. Meddelande nr 89 (1956). In Swedish.
DIN 1996, Blatt 8. "Priifung bituminoser Massen fiir den Strassen-ba'u und verwandte Gebiete. Bestimmung der Wasseraufnahme".
D.G. Tunnicliff and R.E. Root. "Use of Antistripping Additives in Asphaltic Concrete Mixtures. Laboratory Phase" NCHRP Report 274 (1984).
R.P. Lottman. "Asphalts, Asphalt Mixtures and Additives", "Labo-ratory test method for predicting moisture induced damage to asphalt concrete". Transportation Research Record 8143.
ASTM C 802 "Conducting an interlaboratory test program to determine the precision of test methods for constructing
mate-rials".