Supervisors:
Peter Helin, ABB crane systems
Stefan Löfgren, Mälardalen University
Examinator:
Mats Björkman, Mälardalen University
Fredrik Linder
flr11002@student.mdh.se
Thesis for the Degree of Bachelor of Science in Engineering - Computer Network Engineering 15.0 hp
IDT (academy for Innovation, Design and Technology) Mälardalen University
Västerås, Sweden 2015-11-15
ABSTRACT
Nowadays, more information and services are migrated into computers using a network as the carrier for data communication. One example of this is the migration from PROFIBUS to PROFINET. The big problem is that there are no network monitoring solution
implemented, despite the significance of the network. The drawback of not having a network monitor solution are many. This includes areas within security, availability, control and troubleshooting. The goal is to find a solution to this problem with providing a complete network monitor solution in ABB’s existing environment. The work was divided in four different parts, research, design, implementation and verification. Information from the World Wide Web (WWW) pointed towards that CentOS (operating system) together with OMD (network monitor software) would be the best choice for this task. The design phase described how all devices should be able to communicate with each other. The implementation part mostly were configuration of devices, such as servers, monitor software, switches and security. The configuration were made by using the built in user interface in each device. The verification part proved that all functions worked as expected, such as security and notifications. Rest of the verification could be seen in the web interface. The result is a complete solution demonstrated in ABB crane system’s lab, which includes a complete set of network devices that exist on sites all around the world.
1 ABBREVATION LIST 3 2 EXPLANATION OF TERMS 4 3 INTRODUCTION 6 3.1 BACKGROUND 6 3.2 PURPOSE 7 3.3 DELIMITATIONS 7 3.4 RELATED WORK 7 3.5 PROBLEM FORMULATION 7
3.6 ANALYSIS OF THE PROBLEM 8
3.7 METHOD 8 4 RESEARCH 9 4.1 OPERATING SYSTEMS 9 4.2 MONITORING SOFTWARE’S 11 5 DESIGN 14 5.1 OMD DESIGN 14 5.2 SNMP 15
5.2.1 INFORMATION EXCHANGE PROCESS 15
5.2.2 VALUATION OF SNMP VERSIONS 16 5.2.3 COMMUNICATION 18 6 IMPLEMENTATION 20 6.1 NETWORK 20 6.1.1 IP-ADDRESSING 20 6.1.2 VLAN 21 6.1.3 NAT 22 6.2 IMPLEMENTING OMD 24 6.2.1 INSTALLING OMD 24 6.2.2 SETTING UP OMD 24 6.2.3 OMD COMMANDS 24
6.2.4 CONFIGURING OMD(WITH WATO) 24
6.2.5 CONFIGURE NAGVIS 29
6.3.1 STARTUP SCRIPT 31 6.3.2 AUTOMATIC LOGIN 32 6.4 CONFIGURE SNMP 32 6.4.1 LINUX 32 6.4.2 WINDOWS 33 6.4.3 WESTERMO SWITCH 34
6.5 ALERT & NOTIFICATIONS 34
6.5.1 EMAIL MESSAGE FORMAT AND NOTIFICATION SETTINGS 34
6.5.2 EMAIL SERVER 35
6.5.3 EMAIL CLIENT 36
6.6 SECURITY 36
6.6.1 NETWORK HARDENING 36
7 TESTING AND VERIFYING 39
7.1 NOTIFICATION TESTING 39
7.2 RESTRICTION TESTING 39
7.3 BASIC NETWORK EXPLOIT TESTING 40
7.3.1 ACTIVE NETWORK ATTACKS 40
7.3.2 PASSIVE NETWORK ATTACKS 41
8 PROBLEMS AND SOLUTIONS 43
8.1 SNMP REQUEST/RESPOND PROBLEM 43
8.2 PING RESTRICTION PROBLEM 44
9 RESULT 45
10 CONCLUSIONS AND DISCUSSION 47
11 FUTURE WORK 49
11.1 DECISION OF MONITOR SOLUTION & POLICY 49
11.2 TEMPERATURE CHECK 49
11.3 EXTERNAL SENSORS 49
11.4 ANDROID APPLICATION 50
11.5 MORE SECURITY TESTING 50
REFERENCES 51
Abbrevation List
ACL Access List AD Active Directory
ASC Automatic Stacking Crane
CentOS Community Enterprise Operating System CMS Crane Maintenance System
CPU Central Processing Unit Email Electronic mail
GUI Graphical User Interface
ICMP Internet Control Message Protocol NMS Network Management Station
OS Operating System
PLC Programmable Logic Controller RAM Random Access Memory RCM Remote Connection Manager
RCS Remote Control Station REHL RedHat Enterprise Linux REPO (Software) Repository
SIM Simulator
SMS Short Message Service
SNMP Simple Network Management Tool STS Ship To Shore crane
VLAN Virtual Local Area Network WATO Web Administration Tool
1
EXPLANATION OF TERMS
AC 500 PLC:
The AC 500 PLC can be located inside every crane, RCS and RCM. The PLC is used as a control system to handle for example signals and communication.
AC 800 PLC:
The physical size of theAC800 is slightly larger than theAC500 PLC. More and more sites are migrating to AC500, but at the moment is a hybrid solution used where the AC500 and AC800 PLC are working together.
ASC:
Stacking crane are used to stack containers in blocks, where multiple ASC cranes works. Those cranes are automated, but can be manually controlled remotely with the RCS. Total height of an ASC crane is about 20-30 m. The devices that will be monitored in the ASC are; AC500 PLC, XCC, CMS, process panel and switch.
CMS:
Is an application which is running on a windows computer. The computer takes in data gathered from the PLC’s and represent this in ABBs program called CMS8.
Monitor server:
Virtual VMware server which is running a software that gathers data from hosts such as bandwidth, CPU and RAM usage.
Process panel:
The process panel is a touch screen that is used in RCS and cranes. The purpose of the process panel is for the users to be able to change settings in the RCS or crane. This includes for example camera views, work orders, spreader size and flippers.
RCM:
The RCM handles the connection(s) between cranes and RCS. The devices that will be monitored in the RCM are; AC500 PLC, CMS and switch.
RCS:
RCS is a remote table, which is used to control the cranes. The devices that will be monitored in the RCS are; Video PC, CMS, AC500 PLC and switch.
SIM :
The simulator is used to train workers to control a crane using a RCS. It’s also used internally for demonstration and development testing. The devices used in the SIM are; AC500 PLC, AC800 PLC, XCC, CMS, switch and servers.
STS:
STS is cranes standing on the quayside, where the task is to unload the ship with containers. Those cranes are semi-automatic for safety reasons. The operator remotely controls the crane
from a RCS, where the operator can control the crane when necessary such as pick up/down containers. Total height of an STS crane is about 70-100 m. The devices that will be
monitored in the STS are; AC500 PLC, AC800 PLC, process panel, XCC, CMS and Switch. Switch:
ABB uses Westermo switches which are used as endpoint for every crane and RCS towards the customer’s network. Those switches carry traffic such as PROFINET, Video, and management traffic to communicate with other devices.
VIDEO PC:
Is an application which is running on a windows computer. The task is to show video feed from cameras located on the cranes.
XCC:
XCC is a compact computer which has the task to translate incoming messages from ships and translate them into something that the crane system can understand.
2
INTRODUCTION
This thesis is the final step in the examination process of the Bachelor Program in Computer Science - Network Engineering. The thesis should be done within the knowledge area of the network engineering program. The thesis was carried out in collaboration with ABB Crane systems in Västerås, Sweden.
ABB Crane systems are the leading company to create automated crane software. With this automated solution, workers can safely control the cranes from land through a PROFINET network. This increases the production efficiency, wealth and safety of workers around the globe.
2.1
Background
More and more manual systems migrate to automated digital systems. To do so, a network is required to carry the information from one location to another. As the business grows, the network does not only grow in complexity and size, but also in value and significance. If an outage in the network would occur, the production would stop and profit would decrease for every minute. This outage time could be decreased or prevented by using good planning together with a monitoring solution.
ABB are today using PROFINET, which is a standard for industrial automation that uses TCP/IP and Ethernet. This means that all communication between the cranes and remote tables will be sent through Ethernet links, using the TCP/IP standard. Also other devices as example computers can communicate on the same Ethernet medium. This makes the
Ethernet medium very business critical for outages. If an outage would occur, it´s important that error is located and fixed as soon as possible to contain good productivity. By using network monitoring can the system automatically notify when an outage occur. This gives the administrator a description on what service/ host that is not working properly and which device that has this error. The error can therefore be resolved as fast and efficient as possible. Network monitoring of ABB’s customer’s production network generates:
Minimum downtime which gives more satisfied customers Easier troubleshooting
Find bottlenecks on devices and links Find devices with high respond time Gather data for optimization
2.2
Purpose
The purpose of this thesis is to examine network monitor solutions for ABB Crane systems. The devices that will be monitored are CMS, video computer, XCC, PLC, process panel and switches. This must be done by using SNMP, or by using the internet control message protocol (ICMP) for devices that does not support SNMP. The solution demands that it is easy to setup, easy to migrate, easy to overview and highly scalable.
2.3
Delimitations
There already exist a redundant VMware server solution on site, where the monitor server will be implemented, therefore the server hardware and redundancy solution already been done. ABB connects all units such as cranes and RCS together with the customer’s network and because of this can’t all devices be controlled. Devices that can be controlled are “end devices” which ABB has access to configure.
2.4
Related work
ABB is currently developing a software for monitoring computer resources and services. The software is in an early stage and it lacks some useful network abilities.
There are many external companies that provide network and device resource monitoring software’s for both Windows and Linux.
There is also a thesis student that has integrated SNMP into an OCP server [13]. This simple implementation can show data such as duplex mode and interface speed.
2.5
Problem formulation
At this point, there is no finished overall solution to monitor ABB’s customer’s production network. As mentioned in previous sections, network monitoring is required because it can be hard to troubleshoot without proper knowledge and software when a problem occurs. The task is to implement a network monitor server that presents host status on an easy
understandable overview.
Other issues that will be discussed and evaluated in the report includes: Which solution is most suited for this problem?
How much extra bandwidth will this solution use?
2.6
Analysis of the problem
It’s known that a network monitor server is required to solve this problem. To determine the best solution, different software’s and operating systems is needed to be evaluated.
The presentation in the software is also important in order to get a good overview understanding, where the hardware must be thought of. The hardware used for example screens must have good brightness and clear colors.
The presentation on the screen should be easy to read, so the user interface must be good. That means that settings should be easy to find and change. The output should also be able to be represented in many different modes, example as graphs, gauges and numbers.
How the administrator will be contacted by the server when a fault occurs, must also be examined. First of all, the server must warn through the graphical user interface (GUI). When the administrator is not watching on the monitor GUI, then the administrator must still get the fault information. Therefore, the software must support either short message service (SMS) or electronic mail (Email).
To optimize and save bandwidth, protocols need to be examined more closely. The TCP/IP protocol size is fixed, but the monitor protocol SNMP has several versions where the version of SNMP can range in size and function. This extra overhead size must be compared with the benefits of the functions.
2.7
Method
The first phase of the thesis project was to examine the problems. A mind map was made to try to examine and pinpoint all problems and everything that needs to be done in the project. A rough Gant-scheme time plan was also made during the first week of the thesis project. The main points of this project where:
Evaluate different software’s
Determine how the server and clients should communicate Plan how the information should be represented
Conclusions and recommendations for future work Documentation and report
Most of the time will be used to search for information about network monitor software’s and what kind of operating system distribution that should been used. Other important things to think about is compatibility, overview, scalability and installation process.
Documentation is very important in larger projects, therefore will a logbook be written. The logbook can be used in the future to solve known problems and is also a good reference for the report.
3
RESEARCH
3.1
Operating systems
A market share analysis of server operating system (OS) was made to determine the popularity. This is important, because more market share often means greater support, documentation and knowledge inside the company. Apple OS X Server will not be compared in this chapter, this is because Apple OS X Server is not very common at companies, and this also include ABB.
Windows has a big market share advantage over other Linux/Unix distributions. Linux top two distributions are Debian and Ubuntu, because they have easy navigable GUI and good support on the internet. They are mostly used by home users/ small offices for smaller server environments. Community Enterprise Operating System (CentOS) and Red Hat on the other hand are true server distributions, and are targeted towards enterprises/larger offices. The market share of each OS can be seen in Figure 1.
Figure 1, Market share in percentage of public accessible web server OS [1] As was seen in Figure 1, Windows has a big market share advantage. ABB uses Windows in the infrastructure on site for example the CMS and Video computer. If a Linux/UNIX distribution is used beside those Windows machines, then the support between the Linux/UNIX distribution and Windows must be as good as possible. If the support is not needed today, then maybe it will be needed in the future.
In Figure 2 is a comparison between the most popular Linux/UNIX distributions. These distributions are compared against support with different Windows server functions. UNIX is old and hasn’t the same update phase as modern Linux and therefore will UNIX not be used. SUSE, CentOS and Ubuntu have the best support against Windows, but SUSE has low market share and the server edition costs a yearly subscription. This leaves to Ubuntu and CentOS, both have free server versions and Ubuntu also has free desktop version. Both distributions are in the top of both Windows support (Figure 2) and popularity (Figure 1); this means that
34,4 33
11,8 8,5
7,6
2,9 1,8 UnknownWindows Debian Ubuntu CentOS Other Red Hat
a closer comparison needs to be made to determine the best Linux distribution for this purpose.
‘
Figure 2
The server must be easy to navigate and manage (easy navigable GUI), because most ABB employees are not familiar with Linux. The End-Of-Life and stability are also very important because this server will be powered on for many years without getting updated. The End-Of-Life period is the double on CentOS compared to Ubuntu server. End-Of-End-Of-Life must be considered because it’s much work to merge to a newer distribution version.
CentOS are also known to be very stable because it’s built on RedHat enterprise linux (REHL), where the most critical and stable patches is released. Ubuntu on the other hand uses newer updates which, in some cases are not as tested and stable as CentOS updates (known as bleeding edge).
The software repository (REPO)feature are considered for scalability and security. A REPO is a storage location where software packages can be downloaded and installed from. This solution becomes very scalable because multiply REPOs can be used. By design, its malware free thanks to that REPOs are digitally signed. Rest of the comparison is shown in Table 1.
Operating system CentOS Ubuntu Server
Easy navigable GUI
End-Of-Life ~ 10 years ~ 5 years
Stable /
Compatible with REHL
Compatible with Windows*
Repository (REPO)
GPLv2 licens (free)
Table 1, *only compared functions seen in Figure 2 [2], [3]
The operating system that will be used is CentOS because as mentioned earlier it’s free, stable, has a long End-Of-Life span and many other great features. This CentOS is also used in the crane simulator. This means that some knowledge about CentOS already exists in ABB. Therefore is CentOS the best Linux distribution choice for this case.
3.2
Monitoring software’s
It exist lots of monitoring software’s for both Windows and Linux at the moment. The monitoring software’s ranges between cost, functions, design, amount of monitored nodes and much more. Some monitor Linux solutions comes in bundles or modified distributions. This new concept of bundles is to simplify the process which makes it much easier to install and setup. As example, OMD bundle contains over 20 software’s, where all software’s has its own part, working together to create a complete monitoring solution. The OMD bundle, only takes a few commands to install. This can be compared to setting up those software’s one by one, making it much more time consuming and complex.
Interesting monitoring solutions: Windows standalone software:
o Pandora FMS o PRTG
o Solarwinds network management software & network tools o Splunk o WhatsUpGold o Jennifersoft Linux Standalone: o Centreon o Icinga o Nagios (core) o Opsview o Zabbix o Zenoss (core) Linux Bundle: o Centreon enterprise o FAN o OMD
First of all where the Windows standalone software’s tested and compared. Most of the software’s on Windows has a subscription cost. A yearly subscription can range from hundreds of euro to thousands of euro depending on software, functions and amount of nodes monitored. Pandora FMS and Splunk has a free version, but with restricted functionality compared against the paid version.
ABB can’t deliver monitor solutions where the payment model consists of a subscription cost. The only payment model that can be used is a one-time purchase. Linux monitoring solutions are free, yet not losing any important functions which the expensive Windows monitoring software’s has. None of the Windows standalone software’s are recommended for ABBs monitor solution. This is because the flexibility of the monitor software, payment model and the expensive price vs functionality compared to Linux.
Second tested where the Linux standalone monitor software’s. All of the Linux standalone software’s uses GPLv2 license, which is free. There are also payment subscriptions, but then it’s for support, some plugins and functions. The popularity of each Linux standalone software can be seen in Figure 3.
As seen in Figure 3, both Nagios and Zabbix are very popular compared to the rest, therefore will those two be examined closer.
Nagios is the leader and industry standard in enterprise-class monitoring solutions [4]. Nagios is out of the box hard to configure, because all configuration needs to be done in text files. There are no features to create own graphs or other need-to-have features. Nagios is simply said, basic and very stable.
Zabbix is a complete monitor solution, much like Centreon enterprise, FAN and OMD. Although Zabbix has a good web interface, but is hard to setup all host and services that’s wanted. A great feature such as flapping detection is also missing together with good customable overview feature like Nagvis plugin for Nagios.
Nagios is a great tool but it lacks too many need-to-have features. Zabbix on the other hand is very good candidate that can be used for ABBs monitor solution. But there are still the Linux monitor bundles to examine.
Last to examine are the Linux monitor bundles. FAN (Fully Automated Nagios) runs on a Linux light version of CentOS 4. Because it’s based on an old distribution, the support has expired, making it unsafe. The tools in FAN are outdated and its only CLI based. Because of those big drawbacks, FAN will not be used.
Centreon Enterprise also runs on a version of CentOS. The features are restricted and only subscripted payments will unlock those features. The graphing tools, overview and GUI are not as good as expected.
The OMD Project was founded 2010 and are developed by well know Nagios community members and Nagios addon developers. This includes the creator of Check_MK, NagVis, pnp4nagios and more [5].
OMD is a complete bundle of more than 20 software’s. It can be downloaded through OMD’s website or added as a REPO and downloaded through the terminal.
The bundle consists of [6]: Nagios
o Monitoring Plugins (Former known as Nagios-Plugins) o nsca o check_nrpe Icinga Shinken NagVis pnp4nagios rrdtool/rrdcached Check_MK MK Livestatus Multisite Dokuwiki Thruk Mod-Gearman check_logfiles check_oracle_health check_mysql_health jmx4perl check_webinject check_multi
As mentioned earlier, Nagios is stable but lacks need-to-have features. OMD completes Nagios where Nagvis addon is used to easily create overview topologies of sites. Rrdtool and pnp4nagios is used to create graphs from data that Nagios collect, these graphs can easily be exported with a single click to a .pdf or .xml file. The hardly configured Nagios is now easily configured with Check_MK. Check_MK uses a user friendly GUI and is highly configurable. MK Livestatus uses a livesocket, which removes the bottleneck from the Nagios poller. The stability of Nagios together with highly useful addons makes the OMD monitor solution very good. All those pros compared to all the other monitor software’s shows that OMD is the best monitor solution that fit what ABB demands.
4
DESIGN
4.1
OMD design
The conclusion from the last chapter was that CentOS 7 will be used together with OMD monitor bundle. The design of how all the software’s will work together to communicate, gather and present data [7] is shown in Figure 4.
Devices: PLC XCC CMS PC Video PC Server Switch Router Process panel Syslog: Temperature Moisture Water External sensors:
NAGIOS Monitoring Core Engine
Mail Web GUI Phone-App SNMP, TCP, ICMP SNMP Trap Alarm: Nagios PNP4Nagios Nagvis Check_MK Web GUI: SMTP, HTTP Input Input Core Core Output Output Livecheck Livestatus Event - Daemon Core Core Check_MK Acronis Backup 11.5 & localhost OPTIONAL (Can also send
SNMP Trap)
4.2
SNMP
Simple network management tool (SNMP) is a network management protocol used to gather information from network devices that support SNMP. SNMP communicate between Agents (devices) and Managers (server), also known as NMS. The manager in this case is the CentOS 7 server, which collects information from multiple Agents. How the information is stored and presented is decided by the NMS software [8].
4.2.1
Information exchange process
1. SNMP sends a get request, asking for specific information, example as CPU utilization. Instead to ask for CPU utilization, the manager instead specifies this question by an OID. The tree structure is called MIB, where the OID are the leaves, and organization/companies are branches [8].
Example how the snmpget command can look like can be seen below; where A specifies the SNMP command, B specifies which SNMP version to be used, C specifies which community to use, D is the IP-address of the SNMP Agent, E is the OID to the information that should be requested.
snmpget –v2c -c public 127.0.0.1 1.3.6.1.2.1.43.5.1.1.1.1.0
A B C D E
2. The Agent gathers information (specified by the OID) and sends back a response to the manager. How the packet frame of SNMP v2c looks like can be seen in
Figure 5
.UDP
IP
Packet
Ethernet
Frame
SNMP Message
Ethernet frame handle MAC addresses (layer 2 in OSI model). IP packet handle IP addresses (layer 3 in OSI model). UDP specifies which port that the hosts will communicate on (layer 4 in OSI model). The SNMP message includes all information for request/reply (layer 7 in OSI model).
4.2.2
Valuation of SNMP versions
SNMP together with UDP, Ethernet frame and IP packet are the protocols that will be used to monitor all devices. Those core protocols need to be examined further to determine which version that will suit this implementation. UDP, Ethernet frame and the IP packet are fixed and can’t be optimized any further, but SNMP has three different versions that need to be examined further (seen in Table 2). SNMP v1 is the oldest version and is not considered to be used in the implementation. This is because SNMP v2c exist, which is very much alike SNMP v1 but has improved performance, security, confidentiality and manager-to-manager
communications [8]. SNMP v3 on the other hand is simply SNMP v2c with authentication, Encryption and user based security (can be seen in Table 2). The best choice is to compare SNMP v2c and SNMP v3 closer such as package size and amount of sent packages. This is because the package size impacts the network bandwidth, and the amount of packages impact the CPU and therefore the process time on the switches that SNMP runs through. Higher process time means that packets takes longer time to process, meaning increased round-trip-time.
A test was setup to measure the package size and amount of packages. This was done to set up one SNMP Agent and one SNMP Manager, where the manager would use a SNMP
request. The Manager sends a SNMP request asking the Agent a question, and in this test the Manager asked “what’s your MTU size?”. The SNMP Agent will then answer with a response saying “My MTU size is 1500” (this value is in bytes). The communication between the SNMP Agent and SNMP Manager was captures in software called Wireshark, which can be seen in Figure 6-7. Function SNMP v1 SNMP v2c SNMP v3 GET request GET-NEXT request SET request GET-BULT request Trap notification INFORM notification
Community based security
User based security
Message Authentication
Message Encryption
(privacy)
SNMP v2c:
Figure 6, SNMP v2c output SNMP v3:
Figure 7, SNMP v3 output
As can be seen in Figure 6, SNMP v2c sends two packages, as explained above. SNMP v3 on the other hand sends the double amount of four packages (seen in Figure 7). This is because two packages are for the SNMP information exchange and the other two packages are for the encryption. One other thing that’s also different is that SNMP v3 has a slightly larger package size than SNMP v2c, this is because SNMP v3 uses a different header layout than SNMP v2c. It’s hard to grasp how much this will impact the site’s network. Therefore will a calculation be made so see how much extra bandwidth and packages that will be send every minute.
The values are estimated because none of those values are fixed. Values:
Send interval: 60 seconds (default value).
Length of packages: taken from the test in Figure 6 and Figure 7. Amount of packages: taken from the test in Figure 6 and Figure 7.
Amount of units on site; 80 cranes or RCS (big site) that have the average of 3 sub devices (switch, CMS, RCS also have Video PC x2). The XCC and PLC uses ICMP and will not be included in the calculation. Amount of devices are therefore estimated to 2.5 monitored devices per unit (using SNMP).
Average of services per device: 5 services per device.
This gives: 80 cranes/RCS * 2.5 sub devices as average gives 200 monitored devices. 200 monitored devices * 5 services monitored on every device gives 1000 services. SNMP v2c:
Size for one packet:
Package length (send and receive): 87+89 bytes = 176 bytes. Amount of packages: 2 packets.
Size on site:
Package lengths (send and receive): 176 bytes* 1000 services monitored gives 176 000 bytes/minute which is about 172 KB/min (~2.9 KB/s).
Amount of packages: 2 * 1000 services monitored = 2000 packages/minute (~33 packages/s).
SNMP v3:
Size for one packet:
Package lengths (send and receive): 106 +146 +173 + 175 bytes = 600 bytes Amount of packages: 4 packets.
Size on site:
Package lengths (send and receive): 600 bytes * 1000 services monitored gives 600 000 bytes/minute which is about 586 KB/min (~9.8 KB/s).
Amount of packages: 4* 1000 services monitored = 4000 packages/minute (~67 packages/s).
As calculated above, SNMP v3 uses about three times more package length (size) and sends the double amount of packages compared to SNMP v2c. The traffic sent by the two versions is still very small compared to the traffic flowing through the site’s network. As example, one RCS sends about (in average) when connected to the video cameras, 2600 KB/s (download), 33.2 KB/s (upload) and 5000 packages/s (measured by the average flow on outbound
interface on RCS in a simulated environment). This huge number can be compared to
2.9KB/s (1.45KB/s upload & 1.45KB/s download) and 33 packages/s that SNMP v2c will use. One more drawback on SNMP v3 accept the big overhead is that Windows does not have support for SNMPv3. To get support for SNMPv3, third-party software needs to be installed where some of the software’s require a purchased license. One other drawback with SNMP v3 is that most monitor software’s doesn’t support SNMP v3.
The drawback on SNMP v2c is that it is less secure. The solution is not to add security to the specific protocol, but onto the entire virtual local area network (VLAN) that SNMP will flow on. With a separate VLAN and restricted access rules, it’s actually not required to have encryption and authentication, because security can be added on other layers and places. Therefore will SNMP v2c be used in this implementation. More about security can be read in 6.6 Security.
4.2.3
Communication
There are multiply companies that provide SNMP OPC servers. So why use the existing OPC server and build SNMP support? The question is simple, scalability and expensive license cost. If a new OPC server must be installed on all CMS computers, it would bring much work. Also running multiple separate instances of different software’s is not optimal. For
troubleshooting and making it as easy as possible, one OPC server would therefore be the best solution for this case. In 3.4 Related Work was a solution mentioned, where another thesis student had implemented SNMP into an OPC server. The Windows solution should use a similar technique as the thesis student did. An example of a RCS how the connection should look like can be seen in Figure 8.
All devices in the RCS (PLC, switch, Video1, Video2, Process panel and CMS) will use SNMP to be able to communicate with the CMS OPC server. This information will be stored at the CMS and showed locally for that specific remote table. The database will also be transferred to a site database with a regular interval. This site database will then be used to overview all the resources of all the devices monitored. Optionally, all the sites databases can be stored at ABB’s system for further monitoring, seeing health and common problems for all sites. This will make it easier for optimizing and troubleshooting the devices in the future.
Switch Video2 Video1 CMS MYSQL Database
RCS
Site Network Overview of site CMS8 output Process panel PLC Figure 85
IMPLEMENTATION
As described, only one solution should be implemented and demonstrated. The
implementation will therefore describe technique behind the Centos 7 running OMD as monitoring software bundle. The Westermo web interface will be used to configure the switches. This is because mostly all configurations are done in the web interface on ABB.
5.1
Network
5.1.1
IP-addressing
The private IPv4 address space is used. The address space that is used was chosen from the known C-class range 192.168.0.0 – 192.268.255.255 [10]. Only the last 4 C-network addresses will be used for the implementation. Using supernetting (CIDR) gives the range 192.168.252.0 – 192.168.255.255 with subnet mask of 255.255.252.0 (binary /22), where the first 22 bits is for the network and the last 10 bits is for the hosts (of total 32 bits).
11000000.10101000.11111100.00000000 (192.168.252.0) – Start of address space. 11000000.10101000.11111101.00000000 (192.168.253.0)
11000000.10101000.11111110.00000000 (192.168.254.0)
11000000.10101000.11111111.11111111 (192.168.255.255) – End of address space.
A /22 mask gives 1024 addresses, where the first (network address) and the last (broadcast address) can’t be used. This gives therefore 1022 usable addresses. This value was calculated from the amount of devices from a large site. The amount can be around 100 cranes and RCS (counted together). Taking 100 multiplied with the average of 5 sub-hosts on each crane or RCS. The total IP-addresses used will be around 500 addresses, and together with servers, other switches and so on will even more IP-addresses be used. To be sure that the IP-address space is enough for the future, 100% of the amount that is used on site will be added for future expansion. This means that around 511 addresses are used and 511 are for future use. An IP-address for every switch interface can be added through the Westermo web interface. This is done in Configuration->Interface, where the IP-address and Subnet mask is added (seen in Figure 9). IP-addressing for the thesis can be seen in Appendix O.
Figure 9
5.1.2
VLAN
A separate (management/monitor) VLAN was created, where all the monitor traffic will flow on. The ID of the VLAN is 999 and is typically known as a management VLAN. To add a new VLAN on the switch, simply login through the web browser and navigate to Configuration->VLAN and press on “Add new VLAN”. Only the incoming trunk port will need to be checked as tagged (in this case port 2/1 & 2/2). Only one port will be tagged because NAT is used, which can be read more in 6.1.3 NAT. How the configuration screen looks like can be seen in Figure 10.
5.1.3
NAT
NAT is used to solve a problem, where the monitor server uses VLAN 999 and the internal RCS/STS/ASC devices uses the internal VLAN 30. Using different VLANs means that the server and the devices are using separate networks. The Management network and the devices inside the RCS/STS/ASC can therefore not communicate.
VLAN 30 is only used internally of every RCS/STS/ASC switch. For best design, NAT should be implemented on the RCS/STS/ACS switch and not on the site network switch. This design will also make it easier to use distribute on site, because all RCS/STS/ACS types uses the same internal configuration. Only the IP-addresses will need to be changed in order to work when distributed on site. An overview of how the problem looks like can be seen in Figure 11.
To be able to communicate, NAT must be used on the RCS/STS/ASC switch (seen in Figure 11). First of all will the switch look at the packet, then at its NAT translations if there are any matches. If it’s a match then the switch will change IP address, and therefore also change VLAN. When the device responds, the same process will be made on the same switch for that device. With NAT on the RCS/STS/ASC switch handling all IP translations, they are now able to communicate as they were on the same VLAN. How the translations looks like in the switch can be seen in Figure 12.
Monitor Server Switch Switch Device Site Network 192.168.252.41->192.168.100.81 192.168.100.81->192.168.252.41 . . . NAT BOX RCS/STS/ASC Virtual server
Vlan 30 Trunk Vlan 999
Vlan 999 -> 30 (request) Vlan 30 -> 999 (reply)
Figure 11
Figure 12, NAT BOX from Figure 14s’ switch inside the RCS/STS/ASC
As seen in the NATBOX (in Figure 12), the one-to-one NAT technique is used to
communicate with the Monitor server. The monitor uses the IP-address 192.168.252.10, which sends a request to 192.168.252.41, the IP-address is then translated into the internal 192.168.100.81. The device then reply with 192.168.100.81 which is translated back into 192.168.252.41, which is sent to the server.
To configure this on the RCS/STS/ACS switch, following configuration must be made; Locate configuration->Firewall->NAT in Westermo web interface
“New NAT Rule” is selected to add a new NAT rule “Type: 1-to-1” is selected
“Incoming interface: VLAN 999” is selected
On Destination address, the Monitor address space of VLAN 999 is added New destination address, the internal address of the device is added
/32 subnet mask is used on both translations, this states that only the specific inside address can use the specific outside address. Example; only 192.168.252.41 will translate into
192.168.100.81 and the other way around
“Automatic Packet Filer Rule” and “Proxy ARP” ticked in
The connection will be tested with example ping or a SNMP request from Monitor server
One NAT rule will need to be added for each device on the inside network. When done, it should look something like in Figure 13.
5.2
Implementing OMD
5.2.1
Installing OMD
The installation is done in Linux terminal logged in as root; this can be done by entering “su” in terminal and type in the root password. The OMD package is downloaded with the
command; “# wget
http://files.omdistro.org/releases/centos_rhel/omd-1.20.rhel7.x86_64.rpm”. To install the downloaded package, the command; “#yum install omd-1.20.rhel7.x86_64.rpm” is used. Other packages required will be downloaded and installed automatically. It can take some time depending on internet connection speed and server hardware.
5.2.2
Setting up OMD
After the installation, configurations will need to be made on the OMD installation. OMD uses multisite, where multiply instances of OMD can be created on one server. Depending on the site name, the instances created can be found in the web browser at
“http://hostaddress/sitename”. When logged in as root, a new site can be added with the command “# omd create ABBsite” in terminal. This command will create an instance called ABBsite and also a Linux user with the same name. This user will have limited access to the system and can’t for example create new instances. To log in to this new site user, the command “# su - ABBsite” is issued. When logged in to the user, the “root” will have changed to “ABBsite”, showing that the user is currently logged in.
5.2.3
OMD commands
The OMD installation will bring additional commands to the Linux system. These commands are used to manage the OMD server. With the command “# omd help” will all OMD
commands existing be displayed and simply explained. The OMD site user has limited user rights and can therefore only use show commands together with changing service state (start, stop, restart, reload and status service). The root user on the other hand can use all
commands, which can be seen in Appendix A.
5.2.4
Configuring OMD (with WATO)
All configurations for the Monitor server can be done at
“http://192.168.252.10/ABBsite/check_mk”. “http://192.168.252.10/ABBsite/” will show a collection page for all web interfaces, including Check_mk. Therefore can that page also be used for navigation to example Check_mk.
5.2.4.1.
WATO
The group of configuration tools in Check_mk is called “web administration tool” (WATO). Below WATO exists all tools needed to configure new hosts & services, access rules,
thresholds, groups, notifications and much more. The configuration process is highly scalable and very user friendly. The WATO panel can be found on the left hand side in Check_mk web user interface.
5.2.4.2.
Check_MK Agent
The Check_MK Agent is a software that can be downloaded from the mathias-kettner.de webpage. This piece of software can be installed on Linux or Windows OS. This agent will fetch data with TCP, for the same purpose SNMP is used. The agent can be good to use if SNMP can’t be enabled on a specific computer or if the port SNMP uses is closed. Minimum configuration is needed for it to run. This agent was implemented on the Linux monitor server for test purpose. The installation command for installing Check_MK Agent on Linux (CentOS) is; “rpm –I check_mk-agent-1.2.4p5-1.noarch.rpm”. To verify that the Check_MK works, the command “check_mk_agent” is used. The verification can also be seen through the Check_MK webpage (seen in Figure 15).
5.2.4.1.
Add a new host
A new host is added by navigating to WATO->Hosts->New host. It exist different agent types such as SNMP, Check_MK Agent, PING and so on. Tags such as criticality and network segment tell the administrator what should be expected from that device. Example; Network segment is set to WAN, then it’s known that the ping may be higher compared to a local network. The criticality tells the administrator how critical the device is to the business if it goes down. The settings page for hosts can be seen in Figure 14.
Figure 14
When pressing on “Save & Test” (seen in Figure 14) then the server will automatically test the connection to the host with PING, Agent and SNMP. If the communication is successful, then the box will become green otherwise the box will become red (if unsuccessful). When
everything looks good, then it’s time to write the configuration to Nagios. This is done by pressing on the orange button seen in Figure 15.
Figure 15
The changes that has been made, but not yet saved will be shown. Those changes are saved by pressing “Activate Changes!” (seen in Figure 16).
Figure 16
If the configuration was successfully written to Nagios, then the Progress bar will show “OK” together with status string “Configuration successfully activated” (seen in Figure 17).
Figure 17
5.2.4.2.
Add services to host
Adding services in Check_MK is very easy. This is done by navigating to WATO and pressing properties-> Services. Check_MK will then automatically scan the host and display the suited services. This can take a few seconds depending on hardware and total amount of services scanned. When the services that Check_MK & Nagios should monitor is ticked in, the
services is saved by pressing on “Save manual check configuration” button (Figure 18). These changes are then activated by pressing “Activate Changes!” (Figure 16).
Figure 18
5.2.4.3.
Structure of naming, hosts & services
Structure and sorting is very important, especially in large networks. Folders inside Check_MK can be created to store sub-folders and hosts. By using a standardized naming and folder structure will make it easier and more efficient to find the desired host. The root View of all folders in Check_MK can be seen in Figure 19.
Figure 19
The standard tree structure created for ABB’s monitor solution exists of multiple folders and sub-folders. In the root view will the units be sorted which are; cranes, remote tables,
simulators and servers. The folder within those units will be sorted further because there are many different crane types, such as; STS, ASC and so on. Within for example the STS crane folder will more folders be added to distinguish cranes of the same type with numbers and/or letter combinations. Below the crane folder will the monitored host exist such as example the CMS and PLC. The naming standard of the host exist of <folder path>_<device> (with some exceptions). How the tree structure looks like can be examined closer in Appendix F.
5.2.4.4.
Rules for devices, services and groups
Rules in Check_MK needs to be added to change attributes such as threshold, host groups, checks and so on. Those rules can be placed on folder or host level. If the rule is placed on the
top level folder, then this rule will also be applied to all underlying folders/hosts as well. This makes the rule sets very flexible, scalable and powerful.
Hosts placed in the same folder will not automatically form a host group. To form a host group, a new host group is needed to be created in WATO->Host Groups. Then by pressing on Rules and “Edit this rule” on the host group which was created. A folder where the host group should be applied must be selected. This will make all underlying hosts member of that host group automatically. How the host grouping rule setup looks like can be seen in Figure 20. Host groups can also be created for which type of Agent, Network segment, SNMP type, Check_MK Agent and so on. Overview topology’s can easily be created by adding example all cranes to one group and displaying it in Nagvis.
Figure 20
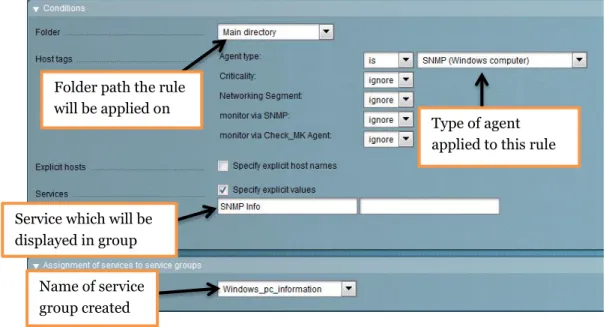
Adding services to service groups uses more or less the same technique as adding host to host groups. Instead of adding to specific folders, the rule is added on root level. The sorting will occur on host tags, (explained further in 6.2.4.5 Host tags) rather than on folder level. The agent type is added in the creation process of the host. The service which should be displayed can be specified by the service name (seen in Figure 21).
Figure 21
Folder path the rule will be applied on
Host group that should be applied to that folder
Folder path the rule will be applied on
Type of agent applied to this rule
Service which will be displayed in group
Name of service group created
5.2.4.5.
Host tags
A host tag is a function in Check_MK which adds attributes (tags) to a device. This gives the administrator better understanding of that device and also used to sort services. New host tags can be added in WATO-> Host Tags. New tag groups can be created by pressing “New Tag group”. This group will hold multiply entries of host tags, which is added by pressing on “Edit this tag group”. These tags can then be added to the host in the creation process or by edit an existing host.
5.2.5
Configure Nagvis
Nagvis uses a separate web interface than Check_MK and can be located at:
http://192.168.252.10/ABBsite/nagvis/. No additional configurations are required to get the connection between Nagvis and Nagios & Check_MK to work. When installing a new site in OMD, then these configurations will automatically be created. These configurations include paths to Nagvis, Host and service (group) URL. The backend is also created, which is the connection (using a socket) to Nagios/Check_MK. All other values are created by Nagvis and are set to default values, which of course can be modified later on in “Options-> General Configuration”.
First of all in order to setup a topology, a map needs to be created at “Options-> Manage Maps”. The input parametrs seen in Figure 22 specifies;
Map name: specifies the name of the map that is being created
Map Iconset: specifies the layout of the icons by default. These icons can be changed manually for every host
Background: The name of the background image, by leaving this line blank will create a white background. New backgrounds can be added by navigating to “Options-> Manage
Backgrounds” and upload a new background. Compressed .JPG format is used due to low size compared to .PNG and higher quality compared to a .GIF picture
Figure 22
5.2.5.1.
Adding host & service (groups)
The information from the monitor server can be represented by different types of animations in Nagvis, which are:
Icons Lines Gauges
Weathermap lines (show arrows with bandwith usage)
Those animations can represent information from: Hosts Services Hostgroups Servicegroups Dynamic groups Other Maps
For example can host group Crane01_LS be represented by an icon by navigating to “Edit Map-> Add Icon-> Hostgroup”. The host group can be individually configured with all settings showed in Appendix G.
When the icon is created it can be modified and moved by unlocking it with a right click and selecting unlock. When satisfied the icon can be locked with a right click by selecting “lock”. All icons can be locked/unlocked by clicking on “Edit Map-> Lock/Unlock all”.
5.2.5.2.
Map rotation
Map rotation in Nagvis is a feature that automatically changes between maps defined in a map pool. The interval between changing to a new map can be defined as well. This is done by opening the textfile in the monitor server located in:
/opt/omd/sites/ABBsite/ext/nagvis/nagvis.ini.php. Locating the “Rotation pool definitions”, where:
maps= defines which maps that should be added to the pool. Interval= defines the rotation interval between maps (in seconds). Output from nagvis.ini.php:
; --- ; Rotation pool definitions ; ---
maps="SiteOverview1080P, SiteBandwith1080P, UnitOverview1080P, NetworkOverview1080P" ; rotation interval (seconds)
interval=15
The new pool will be displayed in Nagvis after the changes have been saved.
5.3
Linux server implementation
First of all where Centos 7 installed with GUI (gnome) and SNMP support. The packages which were installed and configured include:
SELinux Management OMD and required software’s
Changes was also made, this includes: Static IP-address (192.168.252.10)
Joined domain LOCALMNS.net (same as AD & Mail server) Changed hostname to sevasser02
Disabled SELinux
HTTP port was open in the firewall to gain access to the server web interface. This was made with this command in Linux terminal;
[root @sevassrv02 /]# sudo iptables -I INPUT -p tcp --dport 80 -j ACCEPT
For the changes to take effect, the firewall (iptables) will need to be saved and restarted.
[root @sevassrv02 /]# sudo service iptables save [root @sevassrv02 /]# sudo service iptables restart
5.3.1
Startup script
When starting up the server, then the server will not automatically start OMD monitoring service. Without the script, the administrator needs to start OMD manually during every startup of the server. A bash script in Linux can automatically execute command such as start a service or execute a program. To do so were Gedit used as program for the programming. The code looks like following:
#!/bin/sh
# Startscript for ABBsite Network monitoring (“#” means comment, uncomment to make the command work) #echo "##### Starting OMD monitoring ABBsite #####"
omd start ABBsite service iptables restart pkill -u usermonitor #omd status ABBsite
#echo "##### Done, ABBsite is ready to use! #####"
The script was saved with extension “.sh”. An execution right was added to the script with the command:
[root @sevassrv02 /]# chmod +x /opt/omd/ABBsiteStartupScript.sh.
How the script looks like when executed manually with all commands uncommented (accept pkill –u usermonitor) can be seen in Appendix H.
Adding the script to startup is done by adding the line opt/omd/ABBsiteStartupScript.sh to the /etc/rc.d/rc.local file. The line specifies the search path to the script which will be executed at login. The /etc/rc.d/rc.local file will be activated when the user has execution rights, therefore must the command [root @sevassrv02 /]# chmod +x /etc/rc.d/rc.local be issued.
5.3.2
Automatic login
From previously 6.3.1 Startup script a script was created. The script uses the command pkill -u -usermonitor. This command is used to logout the user when everything has been executed on the server. A new user can be created with the command: useradd usermonitor –G users. This command will add a new user named “usermonitor” to the group “users”, which has limited access. To make this user to automatically login into the system, the file
/etc/gdm/custom.conf needs to be configured. This by adding “AutomaticLoginEnable =true” and “AutomaticLogin=username” below “[daemon]”. Output of the
/etc/gdm/custom.conf file: # GDM configuration storage [daemon] AutomaticLoginEnable=true AutomaticLogin=usermonitor [security] [xdmcp] [greeter] [chooser] [debug]
5.4
Configure SNMP
5.4.1
Linux
Linux with NetSNMP supports SNMP v1/v2c/v3, but for the implementation will version 2c be used. The configuration of SNMP in Linux is done in four steps. The location to SNMP configuration file is; /etc/snmp/snmpd.conf. First step maps the community name into a security name, where IP-addresses can be restricted. Second step maps the security name into a group name. Third step creates a view, which the groups have right to access. The view “.1” means that the group has access to all OID’s, where for example “.1.3.6.1.2.1.25.1.1” only gives access to a branch and everything below it. The last step is to give groups access to views created in step 3.
Output from snmpd.conf (“#” means comment):
1. # First, map the community name "public" into a "security name" # sec.name source community
com2sec notConfigUser 127.0.0.1/32 public 2. # Second, map the security name into a group name:
# groupName securityModel securityName group notConfigGroup v1 notConfigUser group notConfigGroup v2c notConfigUser
3. # Third, create a view for us to let the group have rights to:
# Make at least snmpwalk -v 1 localhost -c public system fast again. # name incl/excl subtree mask(optional)
view systemview included .1
4. # Finally, grant the group read-only access to the systemview view. # group context sec.model sec.level prefix read write notif access notConfigGroup "" any noauth exact systemview none none
When the configuration is done then the SNMP service must be restarted in order for the configuration to take effect with the command:
[root @sevassrv02 /]# sudo service snmpd restart
5.4.2
Windows
Windows supports SNMP v1/v2c. SNMP is enabled by navigating to Control
Panel\Programs\Programs and Features -> Turn Windows features on or off. The “Simple Network Management Protocol (SNMP)” box is then checked in.
SNMP is configured in the service that will be created when SNMP is enabled. This is done by open services by typing “services.msc” in run box. In services is the service called “SNMP Service” opened. In general tab, “Startup Type:” is selected to automatic. In security tab is a community string added with read only rights. The host will only accept SNMP packets from the monitor server and localhost, this can be seen in Figure 23.
Figure 23
5.4.3
Westermo switch
Westermo supports SNMP v1/v2c/v3. SNMP version 2c is enabled in Configuration ->SNMP. The checkbox must be checked in order to enable the service together with a read
community. The switch will then be reachable from the server, using the IP-address of the interface, which is defined in the IP-plan Appendix O. How the implementation of SNMP looks like in the switch can be seen in Figure 24.
Figure 24
5.5
Alert & Notifications
5.5.1
Email message format and notification settings
The email message format can be change in WATO-> Global settings-> Notification. Changes can be made for host notifications, service notifications and both host & service notifications. The host & service notifications commonly use the same variables such as hostname, alias and IP-address. State, command, output and prefdata are defined by different variables and are therefore different for hosts and services. Own variables can be added to the output by typing the variable name, example for hostname “Host: $HOSTNAME$”. The default output of the notification message that is sent by the monitor server can be seen below.
Host: <hostname> Alias: <alias>
Address: <IP-address>
State: <state on host/service>
Command: <service that change state> Output: <why state changed >
Perfdata: <output of service that fails>
How the notification format message looks like when a host goes down (network cable unplugged), can be seen in Appendix C. Also how the notification message format looks like when the host comes up (network cable plugged in), can be seen in Appendix D.
To configure the connection where the monitor server send an email, can be made in WATO-> Users-WATO-> properties on the user. Fill in correct name and email address below “Identity”, where the email uses <accountname>@<domain>. In the test is the user “monitoralert” used in the domain “localmns.net”, which gives monitoralert@localmns.net as email address. Below the tab “Notifications” can the host and service events be handled, meaning which events that should and shouldn’t be sent to the email server.
5.5.2
Email server
ABB does not deliver email server solution to sites, therefore will the email server not be used in a real case scenario. But for testing purpose, like how the server handles information from Check_MK until it’s in the email client’s mail basket are on the other hand important. With an implemented test email server, things like message layout, how it works, how to setup and that the mail function actually works can be verified. For most realistic simulation, the operating system Windows server 2012 r2 Datacenter was installed on a server along with Microsoft Exchange 2013. The combination of a Windows server OS and Microsoft Exchange where implemented because, as described in 4.1 Operating systems, Windows OS is the most common OS used by companies & organizations. Therefore is it most likely that ABBs
customer’s uses similar systems in their internal network. The services that were installed on Windows server 2012 are:
Active Directory (AD)
Domain Name System (DNS) Microsoft Exchange 2013
o Mailbox o Client Access
Microsoft Internet Information Services (IIS) SMTP
SNMP agent
VNC server (for remote access) Same for host and Service
email body notifications
Different for host and Service email body notifications
5.5.3
Email client
Windows 10 Technical Preview (Build 9841) was installed as OS on a desktop that should act as an email client. Windows recently released this “test version” for users to evaluate. The idea is to use the built in email-app that exist on Windows 8, Windows 8.1, Windows 10, Windows tablets and Windows phones. This implementation is newer, more unique and better looking than third party software’s such as Microsoft Outlook or Thunderbird. The Windows app can also show notifications on desktop and lock screen, therefore can the monitor user discover the email notification more quickly (seen in Appendix B).
By default is a Microsoft Account needed to log into the system and the mail-app. This is not scalable or wanted, because AD exists with Exchange (for computer and mail user
credentials). This problem can be solved by creating a registry entry in the Windows 10 computer. The search path to registry is:
HKEY_LOCAL_MACHINE\SOFTWARE\Microsoft\Windows\CurrentVersion\Policies\Syst em
Once navigated to that registry path, a new DWORD (32-bit) value with the name “MSAOptional” is created with the value “1”.
One more thing needed to be able to connect to the email server (and also AD) is to add the computer to the same domain as the server. When done, the user should now be able to log in to the computer, using the credentials created in AD. The users created in Microsoft Exhange 2013 should also be able to login to the email-app. The computer will also have access to the email server’s web mail (seen in Appendix E), using the same login credentials as the email-app.
5.6
Security
5.6.1
Network hardening
SNMP v2c does not have any security implemented into the protocol and it’s therefore very important to secure the network where SNMP is used (on VLAN 999). Restrictions will be implemented on all local endpoint switches, which exist on all cranes and RCS. The restriction will be implemented at that location, because if a host (Host 2) wants to access another host (Host 1), then the packet will need to travel across the entire network until it’s dropped (seen in Figure 25). This uses extra bandwidth and load on switches and routers which is totally unnecessary. The other thing that the design brings is that all rules can be created and applied to the switch image, and with few IP-address modifications can the image be applied on site. How the restricted communication looks like can be seen in Figure 25.
Restrictions that will be implemented on all the local endpoint switches are; Restrict access to web interface on Monitorserver
Restrict so only the monitor server and the localhost has access to execute and read SNMP from that device
Restrict ICMP, such as PING command on VLAN 999, where only localhost and monitor server should have access to that device
Restrict remote desktop access to the monitor server
These restrictions will only be applied to VLAN 999, which leaves the rest of the ABB’s network untouched. Implementing these rules is done in Configuration-> Firewall-> Packet Filter. One rule is created for every network and protocol, which can be seen in Figure 30. The first two rules specified, says that all ICMP and SNMP (UDP port 161) traffic that the server sends to the local crane/ RCS network should be allowed. Packets that do not match any of these rules will be dropped. The return traffic will be dynamically allowed by the switch, only if the incoming traffic was allowed in the first case.
The last two rules are for the switch, because NAT translation is not used for the switch and can therefore not use the same rules as VLAN 30. Instead of adding the switch to the NAT translation, then these rules must exist in order for the monitor server to be able to establish a connection to the switch.
Monitor Server Switch 0 Switch 1 Site Network Hosts 1 Switch 2 Hosts 2
Restrict hosts with an access list (ACL), only allowing return traffic to monitor server, rest will be dropped.
Figure 26
For management users will ICMP, SNMP, http and remote desktop be allowed. This can either be done by allowing more rules or allowing all traffic.
6
TESTING AND VERIFYING
6.1
Notification testing
The notification test will show that an email is sent together with Check_MK and Nagvis GUI notification when a host goes down. The process will look like following;
Pulling out the network plug on a device
Check_MK and Nagvis indicate that the host is down (seen in Appendix I, K, L)
An email is sent to the email client, saying that the state has changed from up -> down (see
Appendix C)
Putting the network cable back will remove error from Check_MK and Nagvis GUI
An email is sent to the email client, saying that the state has changed from down -> up (see
Appendix D)
6.2
Restriction testing
In 6.6.1 Network hardening were restrictions implemented where only the monitor server had access to the clients. The task was to test if the restrictions were successfully
implemented to VLAN 999. A ping command was tested on the CMS, trying to ping the monitor server (192.168.252.10), and the switch which the CMS is connected to
(192.168.252.40). The test output from the CMS’s command prompt can be seen in Figure 27 where both ping where unsuccessful.
Figure 27
Looking from the monitor server perspective, where both the switch (192.168.252.40) and the CMS (192.168.252.42) were successfully pinged. The ping test from the monitor server can be seen in Figure 28.
Figure 28
The same will happen for SNMP, where the server can access the client, but the client can only access itself (localhost) and no one else.
6.3
Basic Network Exploit testing
The server has access to all cranes and RCS existing on a site. The exposure if the monitor server gets compromised is high, and therefore has the network been restricted. The test will be done from a CMS computer which exists on every crane/ RCS. ABB has only access to its own devices, where workers use those devices. This means that the threats that ABB can help the customer to prevent are originated internally.
“According to 2004 E-Crime Watch Survey, published by the United States Secret Service and the CERT Coordination Center, 29 percent of identified attackers were actually from internal sources, including current employees, contractors, and prior employees” [11]. In the tests has only VLAN 999 been activated, the rest has been deactivated in order to detect exploits specifically for VLAN 999. The OS used for the test is a Linux penetration test distribution named Kali (successor of Backtrack).
6.3.1
Active Network attacks
An active network attack is when the intruder modify, transmit or replying packages. Attacks such as smurf attack, Man in the middle and ARP spoofing will not be tested, because the exposure of a successful attack is very low [12].