ICAE 2012, Jul 5-8, 2012, Suzhou, China Paper ID: A10779
PROBLEMS AND POSSIBILITIES WITH THE IMPLEMENTATION OF
SIMULATION AND MODELING AT A BIOGAS PLANT
Johan Lindmark1, Eva Thorin1, Rebei Bel Fdhila1,2, Erik Dahlquist1
1 School of Sustainable Development of Society and Technology, Mälardalen University, P. O. Box 883, SE-721 23 Västerås, Sweden
2 ABB AB, Corporate Research, SE - 721 78 Västerås, Sweden Johan.lindmark@mdh.se
+46(0)21-107044
ABSTRACT
Advanced models are being developed for the anaerobic digestion (AD) process. These models can be used to control and optimize industrial size biogas plant to reach their full potential. There are many models available for different types of implementations. However, many of the published models demands extensive chemical analysis that might not be practically and economically viable in industry.
Sampling routines at six Swedish biogas plants was compiled for comparison with the demand of input in published modeling approaches. The gap between the models and practices in industry has to come together through model simplification and extended sampling routines. Chemical oxygen demand (COD) for example is not a commonly used analysis in Swedish biogas plants but which is regularly used to model the AD. Knowledge of the biochemical processes in AD built in to a model can help operators increase the biogas yield of the plant without jeopardizing the production.
There is a lack of robust online measurement equipment today to be able to have reliable online models for operational support but near infrared spectroscopy (NIR) is a promising technology for online measuring of a series of different characteristics that could make modeling more interesting for the AD industry.
The mixing has as of yet not been devoted much attention to when modeling the process.
Keywords: Anaerobic digestion, biogas, modeling, substrate characterization, pre-treatment
NONMENCLATURE
Abbreviation
AD Anaerobic Digestion
ADF Acid Detergent Fibre ADL Acid Detergent Lignin
ADM1 Anaerobic Digestion Model No.1
ANN Artificial Neural Networks
COD Chemical Oxygen Demand
CODp Particulate COD
CODs Soluble COD
CSTR Continuously Stirred Tank Reactor
FS Fixed solids
IWA International Water Association MSW Municipal Solid Waste
NDF Neutral Detergent Fibre NFE Nitrogen Free Extract NIR Near Infrared Spectroscopy Norg Total Organic Nitrogen OrthoP Ortho-Phosphate PLC Partial Least Squares
RF Raw Fibre
RL Raw Lipid
RP Raw protein
S cations Total alkalinity
TAN Total Ammonia Nitrogen TIC Total Inorganic Carbon TOC Total Organic Carbon
TP Total Phosphorous
TS Total Solids
VFA Volatile Fatty Acids
VS Volatile Solids
RMSEP Root Mean Squared Error Of Prediction Symbols
R2 The Coefficient Of Determination
1.
INTRODUCTION
The development of biogas plants have started with solely the courage, the experience and the illumination of some individuals who used mainly their engineering sense and some simple design and operating rules that have proved to work. Today biogas plants are larger and need to satisfy competition rules with high requirements on the
efficiency and environment. To achieve the desired optimum performance level advanced simulation and modeling tools are used. These tools are generally speaking based on theory and can in no way represent the imperfection of the biogas process, non-uniformity of the feed and substrate composition, time dependency of several characteristics e.g. the density, no temperature control, etc.
To fit the process particularities, these tools and models have to be calibrated and adapted with the plants own data. They are then used to design, predict, operate and optimize the process. However, due to the tremendous condition change in terms of feed, operations and used methods and technologies, their implementation is still difficult.
Anaerobic digestion is a biological process were organic matter is broken down by microorganisms in a series of biological reactions to produce the energy rich gas methane and carbon dioxide, in an entirely oxygen free environment. Much is known about the biochemical and physicochemical processes in the AD process and many models have been developed for the purpose of control and prediction of the biogas production, above all in waste water treatment. However, there are problems associated with the implementation of many of these models outside the lab environment.
The Anaerobic Digestion Model No.1 (ADM1) was released in 2002 [1] by the International Water Associations (IWA) task group for Mathematical Modeling of Anaerobic Digestion Processes to be a common platform for simulation and modeling of the AD process. The ADM1 has since then been used by many researchers to model different anaerobic processes [2, 3] but the large amount of input data has been pointed out as a barrier for its use [4, 5]. Many researchers also make use of values from literature to try to circumvent some of these problems [6, 7] when setting up the model, for good and bad.
Many models focus around rate-limiting steps in the AD process. However, pre-treatments of different sorts as well as the status of the digestion processes itself also have an impact on the rate of biogas production from the substrate which can complicate the implementation of the models. For the ADM1 model Batstone et al. [1] point out that the physicochemical solid-liquid processes is not described because of their complicated nature.
Parallel to the research on modeling, research on pre-treatments of substrate to enhance the rate of biogas production are carried out which can have a big impact on the biogas yield. Mechanical size reduction [8] of different sorts, thermal [9] and chemical treatments [10] among others have been studied for their application in the biogas process but their physical effects on the substrate itself are not as well described as the resulting gas yield from the treated substrate.
In this paper problems specific to the implementation of models in the Swedish biogas industry are studied and discussed by comparing the practices in industry today with published literature.
2.
MATERIAL AND METHODS
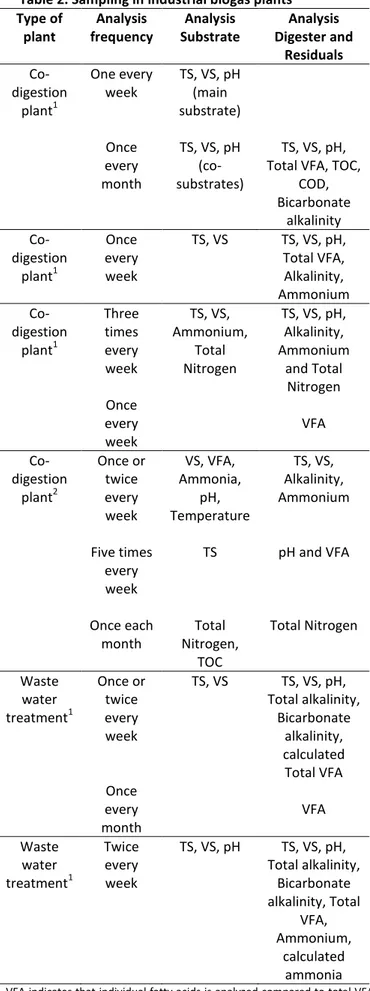
Data has been gathered from different biogas plants in Sweden about their sampling routines. To be able to set up a model and use it in the operation of the plant data needs to be collected through chemical analysis of substrate and the digester as well as from online measurements. Table 1 summarizes some of the data collected from six different biogas plants, four co-digestion plants and two biogas plants connected to waste water treatment plants, of which all six are continuously stirred tank reactors (CSTR).
In the table a number of sampling schedules for Swedish biogas plants can be seen which shows the main data that is available to work with today. Sampling for analysis of metals, plant nutrient and harmful microorganisms are also conducted at some of the plants depending on what the digestion residues should be used for. The samples are taken on a regular basis but from a modeling point of view they are basically random samples of a continuously changing process. In addition to the sampling at the plant data for different flows (mass or volume) of feed and digestion residues, temperature and the produced biogas are often measured online.
Interesting to note here is only one of the biogas plants that analyzed the chemical oxygen demand (COD) in their regular sampling schedules which is one of the most common input for AD modeling and according to the review of Donoso-Bravo et al. [12] the most common of-line measured variable but this might be country/region dependent.
The data collected is then compared with published modeling approaches to evaluate the possibility to model these processes.
Table 2. Sampling in industrial biogas plants Type of plant Analysis frequency Analysis Substrate Analysis Digester and Residuals Co-digestion plant1 One every week Once every month TS, VS, pH (main substrate) TS, VS, pH (co-substrates) TS, VS, pH, Total VFA, TOC,
COD, Bicarbonate alkalinity Co-digestion plant1 Once every week TS, VS TS, VS, pH, Total VFA, Alkalinity, Ammonium Co-digestion plant1 Three times every week Once every week TS, VS, Ammonium, Total Nitrogen TS, VS, pH, Alkalinity, Ammonium and Total Nitrogen VFA Co-digestion plant2 Once or twice every week Five times every week Once each month VS, VFA, Ammonia, pH, Temperature TS Total Nitrogen, TOC TS, VS, Alkalinity, Ammonium pH and VFA Total Nitrogen Waste water treatment1 Once or twice every week TS, VS TS, VS, pH, Total alkalinity, Bicarbonate alkalinity, calculated Total VFA Once every month VFA Waste water treatment1 Twice every week TS, VS, pH TS, VS, pH, Total alkalinity, Bicarbonate alkalinity, Total VFA, Ammonium, calculated ammonia VFA indicates that individual fatty acids is analyzed compared to total VFA which is one total value.
1
Data collected through personal communication.
2
Published data [11].
3.
THEORY
3.1
Biogas production
The production of biogas is a complex process which is handled by a number of different groups of microorganisms during four distinct faces, (I) hydrolysis, (II) acidogenesis, (III) acetogenesis and (IV) methanogenesis.
The substrates vary in composition and structure but are all made up of proteins, carbohydrates, lipids and inerts in different combinations. The C/N (Carbon/Nitrogen) ratio is an important factor for the process and should be kept around 16-25:1 for an optimal digestion process. A to high ratio has an impact on protein formation of the bacteria and a too low ratio leads to an increased ammonia production which in turn can inhibit the process. In addition a minimum amount of trace elements are also needed to keep the process going. [13]
In the first phase (hydrolysis) the complex structure are broken down to monomers (Amino acids, Fatty acids, Glycerine and Short chained sugar) by extra cellular enzymes. During the acidogenesis these monomers are taken up by bacteria and degraded to short chained organic acids, alcohols, hydrogen and carbon dioxide. In the following phase (acetogenesis) the fatty acids and alcohols are broken down again to form hydrogen as well as carbon dioxide and acetic acid. The methanogenic organisms and the microorganisms active during acetogenesis have a special symbiosis relationship to each other called the inter species hydrogen transfer which means that the acetogenesis is dependent on the hydrogen removal by the metanogenes and vice versa. During the metanogenesis acetic acid, carbon dioxide and hydrogen from phase two and three are used to produce the energy rich gas methane, which is the main component of biogas.[13, 14]
3.2
Modeling approaches
2.1.1 Statistical or Data Driven Models
A statistical or data driven model is formed by mathematical equations that describes how the different parameters and variables is stochastically related to each other. The models have no connection to the physical laws so variations outside normal parameters will be handled in the same way as all parameters.
Statistical models like artificial neural networks (ANN) and Partial least squares (PLC) regression are designed from online process data (quantitative) combined with lab data (qualitative). The model can only be used for the process which it has been designed for and within the process conditions which are included in the data. Because model is built on actual process data it can only function within that data space or domain. That is why it is very important to have a good experimental design to get a good spread in
the data set, especially when using the model in an online application. The model can be updated by running it with new data.
2.1.2 Physical Models
A Physical model is based on physical laws and known physical relationships and mass balances between the different parameters and variables. Depending on how well the phenomena modeled is known the model can vary in complexity. Simplification of the physical relationships can also be made to shorten calculation times.
A physical model has no direct demand of process data to be built, in principle, but data is needed for tuning the model and parameter estimation. This data can be collected through experiments. A physical model is more general and could be used on any similar process even though the parameter estimation might need to be updated. Sensors can be used to tune the model for online applications.
3.3
Implementations
The purpose for modeling the AD process can vary a great deal depending on what kind of support is needed. A model can be built in the planning phase of a biogas plant to help design the new process and to find optimal solutions. A model could also be used for testing different scenarios, e.g. testing a new substrates, or just as a training simulator for the operators.
During operation a model can be used for monitoring the process, giving rise to alarms when problems are identified, and in some instances help control the process. Models for process optimization, production planning and to help avoid process problems might be the main interest of most industrial biogas plants. Deublein and Steinhauser [13] list a number of operational disturbances, acidification, foaming, varying gas quality and odor which could be avoided with a better control system.
Indirect support in form of models for risk management, data reconciliation and tools for diagnostics of the plant is also a possibility.
3.4
Modelling
There are many models available for studying the AD process with varying complexity and use. According to Spriet [15] a model should be as simple as possible, built on the relevant cause and effect relationships, identifiability of unknown parameters and that the predictive power should be consistent in time and during alternative conditions.
Analyzing the kinetics of the process can be done by experiments with continuous digesters or using data from already running continuous systems and in some cases literature values can be available. To evaluate the kinetics of a continuous digester the system is fed at different dilution rates or with more rapid substrate pulses to identify the responses and to decouple the ongoing processes of the AD
[16]. These experiments cannot be made in full scale since it will take the AD process to its limit with the risk of crashing. Donoso-Bravo [12] summarizes a number of models and there kinetic parameter identification process in his review.
Parameter estimation is a complicated process but it is isolated to the modeling stage and is of less concern for the industries which will use the models. Input data, quality of data and frequency of sampling is important factors for the biogas plants implementing them since the predictive power of the model is only as good as its input. However, operational factors are rarely addressed in the publications.
By cross validating the model against data with large variations in the feed the predictive power of the model can be evaluated. This type of variations in the system input is important to use during cross validation of the model so that the model has not been over calibrated to the data in the validation set but still have the possibility to predict sudden changes in the operation.
2.4.1 ADM1
The ADM1 model has had a large impact on the research community and many researchers have used it to simulate different type of applications.
The ADM1 model is based on the today known process mechanisms (physical/chemical/biological) and cause and effects relationships within AD. ADM1 is a structured model built as a biochemical kinetic matrix. The decomposition of organic material is separated in the disintegration step, hydrolysis, acidogenesis, acetogenesis and methanogenesis of which the disintegration step is a non-biological conversion step of the composite material to inerts and particulate lipids, protein and carbohydrates.
The large amount of parameters needed for the model has spawned many attempts to try and simplify the method, developing add-on models or have suggested modifications to it. Transformation models to simplify the substrate characterization of ADM1 have been published in many forms, of which some are shown in Table 2.
Table 2. Models (Add-On models) implemented to simplify the substrate characterization of ADM1.
Input: Substrate characterization Reference
COD, TOC, Norg and Alkalinity [4] CODp, CODs, VFA, TOC, TIC, Norg, TAN, TP, ortoP, S cations, FS
[3]
TS, VS, COD, VFA, pH, Ammonium, RP, RF, RL, NFE, NDF, ADF, ADL
[7]
These articles [3, 4, 7] all have the goal to increase the usability of the model by developing the characterization step for different substrates and [4] has taken it down to a level where it can start being useful for industry. Even though the model was mainly intended for waste water treatment it has a wide usage for solid substrates like energy crops [17, 18, 19, 20].
3.5
Costs and Benefits
Performing chemical analysis or installing new sensors for online measuring is both time consuming and adds to the cost of the plants operation. A viable investment demands a reasonable payback time or a clear benefit to the plants operation. Generally more data means that a better model can be built but it also adds to the cost of the application, to the total operational cost of the plant, and the question is if this extra cost can be justified by increased profits or as the operator support that it could provide? However, since the conversion process of organic substrate to biogas is so complex, model simplifications are often needed.
The final goal of these types of support systems is to be able to operate at the optimum level for the digester without risking a process breakdown that can take month to recover from. This will of course demand a very accurate model since there might not be much room for errors. The models could directly give information if there is or will be any problems down the line caused by the way the plant is operated.
3.6
Online Measurements
For many applications some types of online measurements are needed, at least for the most basic parameters.
In the AD process the amount of substrate going in and out of the system (Volume, flow or weight), temperature and gas production are often measured online. The main benefit of online measurements for modeling is their availability, to constantly get updated information about the process, but also their low operational costs compared to conducting multiple standard chemical analysis. The high frequency of the data collection made by online sensors can in most cases be viewed as continuous. The capital costs of these types of equipment vary but for many of the advanced measuring equipment the cost can be very high and thus not suitable for installation from an economic point of view.
Some Industrial processes can often have large amounts of data being measured online and it is important that these sensors are calibrated with even intervals so the information is reliable and accurate. If large quantities of data is available through online measurements care should be taken to identify which measurements that can be relied upon. The sensors need to be mounted correctly for the measurement needed and be easy to dismount for cleaning and calibration. The liquid digestate and feed can be very corrosive and abrasive to sensor equipment so sensors that do not demand direct contact to the material are preferred.
A Swedish report published in 2010 [11] evaluates different online measurement techniques and compiled a list of online measurements needed in the biogas industry for substrate characterization and for optimized digester operation. Sensors to analyze the Total Solids (TS), organic content (COD, VS and TOC) and to give information on the
composition of the composite materials (lipids, proteins, carbohydrates and soluble organic materials like VFA) were suggested for substrate characterization. In the digester specific and total VFA, Ammonium and alkalinity is of great importance.
Techniques tested included impedance, near infrared spectroscopy (NIR; 760-2500 nm) and microwaves. All these techniques demand statistical data for correlation model development.
Impedance could be used to analyze the dissolved fraction of TS in laboratory experiments and microwaves showed potential to analyze the TS online but because of technical problems with the equipment a full evaluation could not be conducted. Another sensor to analyze the TS already installed at the plant where the experiments were conducted is measuring how light is scattered by the particles in the liquid but it had problems with wear and needed to be calibrated very often.
NIR have been used for online measuring of the content of lipids, protein, TS, VS and fibers [21, 22] before which makes it a potential technology for the biogas process. Norberg et al. [11] reported promising results using NIR for analyzing VS (R2 = 0.78), propionate (R2= 0.92; RMSEP = 0.39 g/L) and ammonium (R2 = 0.90; RMSEP 0.18 g/L).
For pulp digesters in the paper industry, models predicting ingoing amount of lignin, cellulose and water has been evaluated [23]. NIR spectra have been correlated to many components, determined at lab, for wood species like Eucalypus, Pine, Akazia, Birch, Spruce, Maple and others and this type of technic could perhaps be made to include also other substrates like agricultural crops, grass, waste water treatment sludge and similar to get a possibility to predict the chemical composition of what goes in to the biogas plant. In the fiber line at Korsnäs, Gävle, Sweden, the reactivity was predicted to optimize the operating conditions in the digester [24].
4.
RESULTS AND DISCUSSION
Substrate characterization is one of the recurrent issues addressed in literature as a hard and complicated phase in the modeling process due to the large number of chemical analysis needed and a lack of tools for online measurements. Here there is an obvious gap between measured data in industry and the models constructed. 3.6.1 The biogas industry
In AD industry today the chemical analysis conducted are mainly focused on evaluating the status of the digester to make sure that the levels of inhibitory substances are kept in check and by doing so avoiding a process disturbance or crash. Some analysis is also made on the incoming substrate.
At the Swedish biogas plants (Table 2) TS and VS are the most common chemical analysis made on the ingoing substrate but also pH, ammonia and total nitrogen analysis are conducted largely depending on what substrate is used.
The digestion process is monitored by analyzing TS, VS, pH, VFA, alkalinity and ammonium in most cases and these measurements are supplemented with the total nitrogen, again for specific substrates. Analyzing the individual VFA values compared to the total VFA is expensive and complicated but is performed at some of the biogas plants. The VFA propionate has been suggested as a good indicator for process imbalance and indicator for process failure [25].
The data being collected today in the biogas industry works well for monitoring the process stability and to get a rough estimate of what the substrate is containing but is not extensive enough for most of the models available since the incoming material is not characterized to the extent demanded by most models and that the frequency of the measurements is too low for any type of online monitoring. 3.6.2 Chemical characterization
One of the main parameters used in AD process and modeling to characterize the substrate is inconsistently used internationally/regionally, and that is the measurement of organic content. VS, TOC and COD are basically three ways of measuring the organic content.
Lübken et al. [7] proposed that COD should be replaced by VS when analyzing substrates as manure and energy crops. COD is predominantly used in waste water treatment and for other types of substrate as manure, VS is most commonly used method of describing organic content. A correlation between COD and VS was formulated in this work to make it compatible with ADM1. Other authors have done similar correlations from VS to COD [4, 7, 18, 26, 27] as well as correlating particulate lipids, particulate inerts, particulate proteins and particulate carbohydrates from kg TS to kg COD for its use in ADM1 [28, 29]. Weender analysis was performed using NIR to analyze the content of raw protein, raw lipids and raw fiber (carbohydrates) in these studies [30]. Good correlation between TOC and VS values has also been noted [11].
Since the composite materials are so complex and the composition (of mainly lipids, protein, carbohydrates and inerts) varies between substrates, within a single substrate and with time (depending on the substrate), a fast and simple method (standard) is needed to differentiate between the different components in the substrate. The method could be direct or indirect but it needs to be simple, fast and cheap. The method could be direct by analyzing the chemical component in question or it could be indirect by analyzing some other quantity or property, either by some type of chemical analysis or by online measurements of some sort (section 3.6), which can be correlated to the component in interest like the Weender analysis [31].
Analyzing COD and TOC can be problematic with some types of substrate since they demand a certain amount of homogenization, but COD has the benefit of being correlated directly to the production of methane (0.35 m3 methane/kg COD) [11].
The substrates used can be pure with a homogenous composition making it easy to characterize or
heterogeneous making it harder to produce good input data for the model. Some substrates are very heterogeneous and this leads to problem when sampling, because most analysis are conducted on a small amount of the total material but should still be valid. So care must be taken to get an as representative samples as possible as the quality of the data available for the model will of course also set a limit to its usefulness in different types of implementations.
Municipal solid waste (MSW) is an example of a heterogeneous substrate which can be challenging to analyze. However, after size reduction and homogenization at the biogas plant the suspended substrate or feed will make the sampling easier.
Which chemical properties the characterization should contain is different depending on the model implemented and this makes the implementation more complicated. Different analysis to calculate and obtain information on the amount or proportion of carbohydrates, protein, lipids and inerts in the substrate is one of the predominant paths used to model AD. The fractions of the different components in the composite material can then be used as predefined values in the model or could be analyzed continuously in the process as model input. Kleerebezem and van Loosdrecht [4] modeling approach to simplify the input for ADM1 for industry use is commendable and hopefully there will be more of these approaches in future publications. 3.6.3 Implementation of the models
The implementation of the models published is rarely addressed since their focus is on model structure, parameter identification and validation. The input needed to run the model and the function that the model could supply in the AD process is often lacking or non-existing.
One problem associated with using statistical models at a biogas plant is the time delay that is built into the system. For example, the gas production from one gram of substrate can in reality span over a number of days which makes it complicated when it comes to allocation. However, there are many examples of data driven models being used for prediction of gas production [32, 33, 34].
The physical models are dependent on good and reliable input since the gas production is directly affected by the substrate composition. Online measuring equipment is the only solution if these kinds of operational supports are to be wide spread within the biogas industry. NIR is a technology that seems to be able to handle a number of different analyses. However, there is a lot more research and development needed on develop accurate and robust sensor technology.
Most models for continuously stirred tank reactor (CSTR) are modeled under the assumption that the mixing is perfect which it is clearly not [35, 36, 37, 38] but little attention has been devote to this even if there are some exceptions [39].
Pre-treatment of substrates for biogas production is also a popular area of research but how can these positive effects on the substrate be integrated in the modeling phase without having to re-calibrate the model?
4.1
Conclusions
The identified problems associated with implementing modeling the AD process in Sweden:
1. The characterization needed for many of the models are too extensive for use in industry. 2. The use of COD measurements in AD modeling is
not compatible with the data collection scheme of Swedish biogas plants which measures the organic content in VS. COD is traditionally used in wastewater treatment and not to characterize solid substrates.
3. There is a lack of robust online measurement equipment today to be able to have reliable online models for operational support.
4. The mixing has as of yet not been devoted much attention to when modeling the process.
The identified potentials associated with implementing modeling the AD process:
1. The knowledge of the biochemical processes in AD built in to a model can help operators increase the biogas yield of the plant without jeopardizing the production.
2. NIR is a promising technology for online measuring of a series of different characteristics that could make modeling more interesting for the AD industry.
3. There are many models available for different types of implementations.
ACKNOWLEDGEMENT
This study was funded by the European Regional Development Fund through the project Regional Mobilizing of Sustainable Waste-to-Energy Production (REMOWE) which is a part of the Baltic Sea Region program. We would also like to thank all the participating biogas plant for their feedback.
REFERENCE
[1] Batstone, DJ.; Keller, J.; Angelidaki, RI.; Kalyuzhnyi, SV.; Pavlostathis, SG.; Rozzi, A.; Sanders, WTM.; Siegrist, H.; Vavilin, VA. Anaerobic Digestion Model No. 1, Scientific and Technical Report No.13, London: IWA Publishing, 2002. [2] Blumensaat F, Keller J. Modelling of two-stage anaerobic digestion using the IWA Anaerobic Digestion Model No. 1 (ADM1), Water Research 2002;39:171-183.
[3] Zaher U, Li RP, Jeppsson U, Steyer JP, Chen SL. GISCOD: General Integrated Solid Waste Co-Digestion model, Water Research 2009; 43:2717-2727.
[4] Kleerebezem R, Van Loosdrecht MCM. Waste characterization for implementabon in ADM1, Water Science and Technology 2006; 54: 167-174.
[5] Daels T, Willems B, Vervaeren H, Dejans P, Maes G, Dumoulin A, Van Hulle SWH. Calibration and statistical
analysis of a simplified model for the anaerobic digestion of solid waste, Environmental Technology 2009;30:.1575-1584.
[6] Derbal K, Bencheikh-Iehocine M, Cecchi F, Meniai AH, Pavan P. Application of the IWA ADM1 model to simulate anaerobic co-digestion of organic waste with waste activated sludge in mesophilic condition, Bioresource Technology 2009;100:1539-1543.
[7] Lübken M, Wichern M, Schlattmann M, Gronauer A, Horn H. Modelling the energy balance of an anaerobic digester fed with cattle manure and renewable energy crops, Water Research 2007;41:4085-4096.
[8] Lindmark J, Leksell N, Schnürer A, Thorin E. Effects of mechanical pre-treatment on the biogas yield from ley crop silage. Applied Energy 2012 (In press)
[9] Bougrier C, Delgenès JP, Carrère H. Impacts of thermal pre-treatments on the semi-continuous anaerobic digestion of waste activated sludge. Biochemical Engineering Journal 2007; 34(1): 20-27.
[10] Xie S, Frost JP, Lawlor PG, Wu G, Zhan X. Effects of thermo-chemical pre-treatment of grass silage on methane production by anaerobic digestion. Bioresource Technology 2011; 102(19): 8748-8755.
[11] Nordberg Å,Hansson M, Kanerot M, Krozer A, Löfving B, Sahlin E. Robusta mättekniker on-line för optimerad biogasproduktion. Waste Refinery rapport WR11; 2010; URL:
http://www.wasterefinery.se/SiteCollectionDocuments/Pub likationer/Rapporter/Slutrapport_Robusta_mattekniker.pdf (in Swedish)
[12] Donoso-Bravo A, Mailier J, Martin C, Rodríguez J, Aceves-Lara CA, Wouwer AV. Model selection, identification and validation in anaerobic digestion: A review, Water Research 2011; 45 (17): 5347-5364.
[13] Deublein D, Steinhauser A. Biogas from waste and renewable resources - an introduction, Weinheim, Wiley-VCH Verlag GmbH & Co. KGaA, 2008.
[14] Jarvis Å, Schnürer A. Mikrobiologisk handbok för biogasanläggningar. Rapport SGC 207; 2009; URL: http://www.sgc.se/display.asp?ID=1266&Typ=Rapport&Me nu=Rapporter (in Swedish)
[15] Spriet JA. Structure characterization e an overview IFAC Proceedings Series (7) 1985:749-756.
[16] Batstone, D.J., Pind, P.F., Angelidaki, I., 2003. Kinetics of thermophilic, anaerobic oxidation of straight and branched chain butyrate and valerate. Biotechnology and
Bioengineering 84 (2), 195e204.
[17] Wolfsberger A. Modelling and Control of the Anaerobic Digestion of Energy Crops. PhD thesis 2008; University of Natural Resources and Life Sciences: Vienna: Austria. [18] Koch K, Lübken M, Gehring T, Wichern M, Horn H. . Biogas from grass silage – measurements and modeling with ADM1. Bioresour. Technol 2010; 101: 8158–8165.
[19] Gavala HN, Skiadas IV, Ahring BK, Lyberatos G. Thermophilic anaerobic fermentation of olive pulp for hydrogen and methane production: modelling of the anaerobic digestion process. Water Sci. Technol. 2006; 53: 271–279.
[20] Rojas C, Uhlenhut F, Schlaak M, Borchert A, Steinigeweg S. Simulation des anaeroben Prozesses bei der Biogaserzeugung. Chem. Ing. Tech. 2011; 83: 306–321. [21] Ozaki Y, McClure WF, Christy AA. (Eds.) Near-Infrared Spectroscopy in Food Science and Technology; Wiley 2006. [22] Dould M, Andree H, Hügle T. Continuous Analysis of liquid pig manure with near-infrared spectroscopy (NIRS). Landtechnik 2005; 60(1): 32 – 33.
[23]Tomas-Aparicio E, Dahlquist E, Widarsson B and Jansson J: Energy savings through process efficiency improvements using simulation models. Third International Conference on Applied Energy - 16-18 May 2011 - Perugia, Italy.
[24] Aparicio Tomas E., Dahlquist E. and Jansson J.: Physical models, NIR spectroscopy and multivariate data analysis for improved process control of fiber lines. Paper at Control Systems/TAPPI conference in New Orleans, USA, April 22-25, 2012.
[25] Nielsen HB, Uellendahl H, Ahring BK. Regulation and optimization of the biogas process: propionate as a key factor. Biomass Bioenergy 2007; 31:820–830
[26] Wichern M, Lübken M, Koch K, Gehring T, Horn H, Fischer K, Schlattmann M, Gronauer A. Eignung des Anaerobic Digestion Model No. 1 (ADM 1) zur Prozesssteuerung landwirtschaftlicher Biogasanlagen (Suitability of the Anaerobic Digestion Model No. 1 (ADM 1) for process control of agricultural biogas plants), in: Fachagentur Nachwachsende Rohstoffe (FNR) (Ed.) 2007; Messen: Steuern: Regeln bei der Biogaserzeugung: Gülzower Fachgespräche: 172–194.
[27] Wichern M, Gehring T, Fischer K, Andrade D, Lübken M, Koch K, Gronauer A, Horn H. Monofermentation of grass silage under mesophilic conditions: measurements and mathematical modeling with ADM 1. Water Res.2009; 100: 1675–1681.
[28] Cimatoribus C. Simulation and nonlinear control of anaerobic digestion. 2009; PhD Thesis: Stuttgart University: Stuttgart; Germany.
[29] Huete E, de Garcia M, Ayesa E, Garcia-Heras JL. ADM1-based methodology for the characterisation of the influent sludge in anaerobic reactors. In: the first international workshop on the IWA Anaerobic digestion model No. 1 (ADM1). 2005; International Water Association: Lyngby: Denmark, 185–192.
[30] Naumann C, Bassler R. Die chemische Untersuchung von Futtermitteln,
third ed. VDLUFA-Verlag: Darmstad:, Germany; 1976. [31] Zhou H, Löffler D, Kranert M. Model-based predictions of anaerobic digestion of agricultural substrates for biogas production. Bioresource Technology 2011; 102: 10819– 10828.
[32] Ericson E, Thorin E, Yan J. Exploring the possibility of using a simple neural network for the prediction of biogas production of a solid waste digester, poster presentation at 12th World Congress on Anaerobic Digestion, Guadalajara, Mexico, October 31st – November 4th , 2010
[33] Ericson E, Lindmark J, Thorin E, Yan J, A simplified model for anaerobic digestion of solid waste using real data from a full-scale biogas plant, Venice 2010 -Third
International Symposium on Energy from Biomass and Waste, Venice, Italy, November 8-11, 2010
[34] Abu Qdais H., Hani KB, Shatnawi N. Modeling and optimization of biogas production from a waste digester using artificial neural network and genetic algorithm. Resources. Conservation and Recycling 2010; 54 (6): 359-363.
[35]Lindmark J, Bel Fdhila R, Thorin E. On Modeling the Mixing in a Digester for Biogas Production, MATHMOD 09, 6th International Conference on Mathematical Modelling, Vienna, Austria, 2009
[36] Lindmark J, Bel Fdhila R, Thorin E. Retention time and nutrient tracking inside a digester for biogas production, 52nd International Conference of Scandinavian Simulation Society SIMS 2011, September 29-30, Västerås, Sweden, 2011
[37] Karim K, Varma R, Vesvikar M, Al-Dahhan M. Flow pattern visualization of a simulated digester, Water Research 2004;38,17:3659-3670
[38] Karim K, Thoma G J, Al-Dahhan MH. Gas-lift digester configuration effects on mixing effectiveness, Water Research 2007;41,14:3051-3060
[39] Keshtkar A, Meyssami B, Abolhamd G, Ghaforian H, Khalagi Asadi M. Mathematical modeling of non-ideal mixing continuous flow reactors for anaerobic digestion of cattle manure. Bioresource Technology 2003; 87: 113–124