DEGREE PROJECT IN THE BUILT ENVIRONMENT, SECOND CYCLE, 30 CREDITS
STOCKHOLM, SWEDEN 2017
Remote Sensing and Geographic
Information Systems for Flood
Risk Mapping and Near Real-time
Flooding Extent Assessment in the
Greater Accra Metropolitan Area
PRISCILLA ADJEI-DARKO
2
Acknowledgements
First and foremost, I would like to thank the good Lord for seeing me through the degree programme. I would like to thank my examiner, Prof. Yifang Ban, for her help and assistance during the entire process of finishing this master thesis. I am eternally grateful to my supervisor, Osama A. Yousif for his considerable technical support and insights, which extremely improved this thesis. I would also like to thank Arthur Akanga who helped to download satellite data from ESA. Finally, I would like to thank my family for all their support and understanding during this time.
March 2017
3
Abstract
Disasters, whether natural or man-made have become an issue of mounting concern all over the world. Natural disasters such as floods, earthquakes, landslides, cyclones, tsunamis and volcanic eruptions are yearly phenomena that have devastating effect on infrastructure and property and in most cases, results in the loss of human life. Floods are amongst the most prevalent natural disasters. The frequency with which floods occur, their magnitude, extent and the cost of damage are escalating all around the globe. Accra, the capital city of Ghana experiences the occurrence of flooding events annually with dire consequences. Past studies demonstrated that remote sensing and geographic information system (GIS) are very useful and effective tools in flood risk assessment and management. This thesis research seeks to demarcate flood risk areas and create a flood risk map for the Greater Accra Metropolitan Area using remote sensing and Geographic information system. Multi Criteria Analysis (MCA) is used to carry out the flood risk assessment and Sentinel-1A SAR images are used to map flood extend and to ascertain whether the resulting map from the MCA process is a close representation of the flood prone areas in the study area. The results show that the multi-criteria analysis approach could effectively combine several multi-criteria including elevation, slope, rainfall, drainage, land cover and soil geology to produce a flood risk map. The resulting map indicates that over 50 percent of the study area is likely to experience a high level of flood. For SAR-based flood extent mapping, the results show that SAR data acquired immediately after the flooding event could better map flooding extent than the SAR data acquired 9 days after. This highlights the importance of near real-time acquisition of SAR data for mapping flooding extent and damages. All parts under the study area experience some level of flooding. The urban land cover experiences very high, and high levels of flooding and the MCA process produces a risk map that is a close depiction of flooding in the study area. Real time flood disaster monitoring, early warning and rapid damage appraisal have greatly improved due to ameliorations in the remote sensing technology and the Geographic Information Systems.
Key words: Natural disasters; Floods; Remote sensing; Geographic information system
Sammanfattning
Katastrofer, naturliga eller konstgjorda har blivit en fråga av växande oro över hela världen. Naturkatastrofer som översvämningar, jordbävningar, jordskred, cykloner, tsunamis och vulkanutbrott är årliga fenomen som har förödande effekt på infrastruktur och egendom och i de flesta fall resulterar i förlust av människoliv. Översvämningar är bland de vanligaste naturkatastrofer. Hur ofta översvämningar inträffar, deras storlek, omfattning och kostnaden
4 för skador är eskalerande hela världen. Accra, huvudstad i Ghana upplever förekomsten av översvämningar årligen ödesdigra konsekvenser. Tidigare studier har visat att fjärranalys och geografiska informationssystem (GIS) är mycket användbara och effektiva verktyg i översvämnings riskbedömning och riskhantering. Denna avhandling forskning syftar till att avgränsa riskområden översvämnings och skapa en översvämningsrisker karta för Greater Accra Metropolitan Area genom att använda fjärranalys och geografiska informationssystem. Multikriterieanalys (MCA) används för att utföra bedömning av översvämningsriskerna och SAR-baserade kartläggning översvämning används för att fastställa huruvida den resulterande kartan från MCA processen är en nära representation av översvämningsbenägna områden i studieområdet. Resultaten visar att alla delar inom det studerade området uppleva någon form av översvämningar. Urban Land täcker erfarenheter mycket hög, och höga nivåer av översvämningar och MCA processen ger en karta som är en nära skildring av översvämningar i studieområdet. Realtidsövervakning översvämningskatastrofen, tidig varning och snabba skador bedömning har förbättrats avsevärt på grund av ameliorations i fjärranalys teknik och geografiska informationssystem. .
Nyckelord: naturkatastrofer, översvämningar; Fjärranalys; Geografiskt informations-system
5
Table of Contents
Acknowledgements ... 2 Abstract ... 3 Sammanfattning ... 3 LIST OF FIGURES ... 7 LIST OF TABLES ... 8 Acronyms ... 9 1. INTRODUCTION ... 10 1.1 BACKGROUND ... 10 1.2 FLOOD RISK ... 111.3 REMOTE SENSING AND GEOGRAPHIC INFORMATION SYSTEM FOR FLOOD RISK MAPPING AND FLOODING EXTENT ASSESSMENT ... 14
1.4 RESEARCH OBJECTIVE ... 15
1.5 STRUCTURE OF THESIS ... 15
2. LITERATURE REVIEW ... 16
2.1 FLOOD DISASTER MANAGEMENT ... 16
2.1.1 VULNERABILITY ANALYSIS ... 16
2.1.2 CLIMATE FORECASTING ... 16
2.1.4 FLOOD PLAIN MANAGEMENT ... 16
2.1.5 ENFORCEMENT OF STANDARDS AND CODES ... 17
2.2 TYPES OF FLOODS ... 17
2.2.1 PLUVIAL (SURFACE) FLOODING ... 17
2.2.2 RIVERINE FLOODING ... 19
2.2.3 GROUNDWATER FLOODING (GROUND FAILURE) ... 19
2.2.4 COASTAL FLOODING ... 19
2.3 METHODOLOGIES FOR FLOOD RISK MAPPING ... 20
2.3.1 HISTORIC APPROACH ... 20
2.3.2 GEOMORPHOLOGIC APPROACH ... 21
2.3.3 MODELLING APPROACH ... 22
2.3.3.1 GIS WITH HYDRAULIC/HYDROLOGICAL APPROACH ... 23
2.3.3.2 GIS WITH REMOTE SENSING APPROACH ... 24
2.4 REMOTE SENSING FOR FLOOD DAMAGE ASSESSMENT ... 25
3. STUDY AREA AND DATA DESCRIPTION ... 26
3.1 GEOGRAPHY ... 27
3.2 GEOLOGY AND SOILS... 27
6 3.2.2 SOIL ... 27 3.3 CLIMATE ... 28 3.4 DRAINAGE ... 29 3.5 DATA SOURCE ... 32 4. METHODOLOGY ... 35
4.1 SPATIAL DATA PREPROCESSING ... 36
4.1.1 THE STREAM NETWORK (FLOW ACCUMULATION) ... 36
4.1.2 ELEVATION AND SLOPE ... 37
4.1.3 LAND USE/COVER ... 39
4.1.4 RAINFALL (PRECIPITATION) ... 40
4.1.5 GEOLOGY (SOIL TYPE) ... 41
4.2 MULTI CRITERIA ANALYSIS ... 42
4.2.1 THE ANALYTIC HIERARCHY PROCESS ... 43
4.2.1.1 PAIRWISE COMPARISON METHOD ... 44
4.2.2 THE WEIGHTED OVERLAY PROCESS ... 46
4.2.2.1 WEIGHTED OVERLAY ANALYSIS ... 46
4.3 SENTINEL-1A SAR IMAGERY FOR FLOOD DAMAGE ASSESSMENT ... 47
4.3.1 IMAGE PRE-PROCESSING ... 47
4.3.1.1 IMAGE CALIBRATION ... 48
4.3.1.2 GEOMETRIC CORRECTION ... 48
4.3.1.3 SPECKLE FILTERING ... 48
4.3.2 BINARIZATION ... 49
5. RESULTS AND ANALYSIS ... 51
5.1 MULTI CRITERIA ANALYSIS RESULTS ... 51
5.2 SAR-BASED FLOODING EXTENT MAPPING ... 65
5.3 DISCUSSION ... 69
6. CONCLUSION ... 70
7
LIST OF FIGURES
Figure 1: World Risk Index [15] ... 12
Figure 2: An open drain in Accra choked with rubbish and waste. Source: News Ghana 2015 ... 18
Figure 3: Greater Accra Metropolitan Area ... 26
Figure 4: GAMA 2015 Precipitation graph ... 28
Figure 5: GAMA 2015 Temperature graph ... 29
Figure 6: Multi Criteria Analysis (MCA) flow chart ... 35
Figure 7: Flow chart for watershed and stream network delineation ... 36
Figure 8: slope classification ... 38
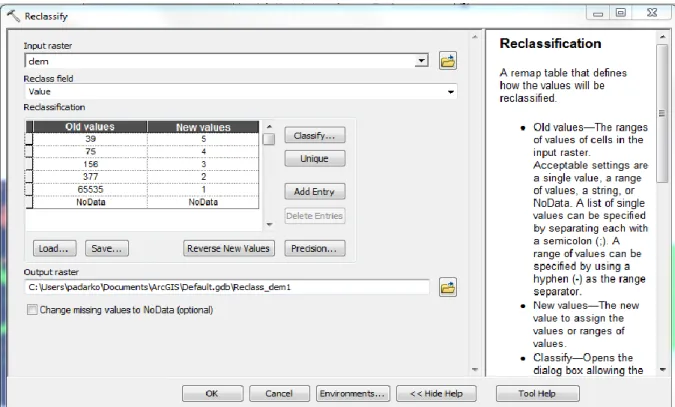
Figure 9: reclassification process ... 39
Figure 10: land cover statistics ... 40
Figure 11: Flow chart for digitizing geological map ... 42
Figure 12: The AHP process ... 44
Figure 13: Radar flood mapping flow chart ... 47
Figure 14: Radar image processing ... 48
Figure 15: Image A; Sentinel – 1A C-band SAR imagery acquire 12/06/2015 ... 49
Figure 16: Image B; Sentinel – 1A C-band SAR imagery acquire 06/06/2016. An example flooded area is highlighted in the red circle ... 50
Figure 17: Stream network of study area ... 52
Figure 18: Reclassified stream network ... 53
Figure 19: Slope of Study area ... 54
Figure 20: Reclassified slope ... 54
Figure 21: Study area elevation map ... 55
Figure 22: reclassified DEM ... 55
Figure 23: land cover map ... 56
Figure 24: reclassified land cover map ... 56
Figure 25: Random Points Map ... 58
Figure 26: Rainfall interpolation surface ... 60
Figure 27: Reclassified Rainfall interpolation surface ... 60
Figure 28: Geological map ... 61
Figure 29: Reclassified geological map ... 62
Figure 30: Flood Hazard Map ... 63
Figure 31: Extracted water map from SAR image A in chapter 4 ... 65
Figure 32: Extracted water map from SAR Image B in chapter 4 ... 66
8
LIST OF TABLES
Table 1: Flood hazard categories [17]. ... 13
Table 2: 2015 GAMA Precipitation values. GMET (2015) ... 28
Table 3: 2015 GAMA Temperature values. GMET (2015) ... 29
Table 4: Densu-Sakumono Basin ... 31
Table 5: Korle-Chemu Basin ... 31
Table 6: Kpeshie Basin ... 32
Table 7: Songo-Mukwoe Basin ... 32
Table 8: Table of Data ... 33
Table 9: Flow Accumulation ranking ... 37
Table 10: Slope ranking ... 38
Table 11: DEM ranking ... 39
Table 12: Land cover ranking ... 40
Table 13: Land Cover Statistics ... 40
Table 14: Station data ... 41
Table 15: Precipitation ranking ... 41
Table 16: Soil rankings ... 42
Table 9: The fundamental scale of absolute numbers (Saaty [47]) ... 43
Table 18: pairwise comparison matrix C ... 44
Table 19: random consistency index [46] ... 46
Table 21: Normalized Matrix ... 51
Table 22: Value for random points ... 58
Table 23: error matrix ... 59
9
Acronyms
AHP: Analytic Hierarchy Process
ASTER: Advanced Space borne Thermal Emission and Reflection Radiometer DEM: Digital Elevation Model
GIS: Geographical Information System GAMA: greater Accra Metropolitan Area GMET: Ghana Meteorological Agency
HEC-RAS- Hydrologic Engineering Center River Analysis System MCA: Multi Criteria Analysis
OLI: Operational Land Imager SAR: Synthetic Aperture Radar SNAP: Sentinel Application Platform
10
1. INTRODUCTION
1.1 BACKGROUND
Disasters, whether natural or man-made have become an issue of mounting concern all over the world. Natural disasters such as floods, earthquakes, landslides, cyclones, tsunamis and volcanic eruptions are yearly phenomena that have devastating effect on infrastructure and property and in most cases, results in the loss of human life. Disasters can be classified in these subdivision; Natural disasters, Man-made disasters and Human-induced disasters. Natural disasters are incidents which are caused essentially by natural phenomena and bring destruction to human societies such as hurricanes, earthquakes, volcanic eruptions; Man-made disasters are incidents which are created by human actions such as air pollution, industrial chemical mishaps, major armed clashes, nuclear mishaps, oil slicks; and Human-induced disasters are natural disasters that are hastened/intensified by human influence [1] Over the years, the number of reported natural disasters has steadily been on the rise and the severity and impact of these natural disasters to the global economy and environment has increased noticeably. In developed countries, the impact of natural disasters is significantly reduced due to the existence of a comprehensive strategy for disaster management but this is a novelty in developing countries.
The United Nations Disaster Relief Organization, which is now known as the United Nations Office for the Coordination of Humanitarian Affairs, describe disaster management as comprising of five steps which is grouped into two phases. Phase one happens before the occurrence of the disastrous event and phase two happens after the event. Phase one comprise of mitigation/prevention and preparedness. Phase two comprise of disaster relief, rehabilitation and reconstruction. These five steps are known as the disaster management cycle [2]. In a flood disaster management cycle, one of the activities carried out at the preparedness stage is the development of maps that details out flood-prone areas and outline impacts.
Floods are amongst the most prevalent natural disasters. The frequency with which floods occur, their magnitude, extent and the cost of damage are escalating all around the globe. Jeb and Aggarwal [3] describe flooding as a general impermanent condition of incomplete or complete inundation of normally dry areas from overspill of inland or tidal waters or from unusual and rapid buildup or runoff. According to the oxford dictionary [4], flooding refers to an overflow of a large amount of water beyond its normal limits, especially over what is normally dry land. There are different types of floods these include coastal flooding [5] flash
11 flooding [6], flooding due to rising of ground water [7] and flooding due to the opening of a dam. In 2007, the European Commission [8] indicated that floods were natural occurrences which could not be avoided. However, there is an escalation in the probability and adverse impacts of flood events due to some human undertakings such as growing human settlements and economic resources in floodplains and a decrease of the natural water retention by land use coupled with climate change.
On June 3rd 2015, the Greater Accra Metropolitan area, the capital city of Ghana, experienced severe flooding which lead to the loss of about 205 lives, loss of several businesses and residential buildings. Accra has been experiencing severe perennial flooding every year during the rainy season since
1.2 FLOOD RISK
What is risk? There are a number of definitions for risk. Different Authors give different definitions to risk but the three most significant definitions of risk as pertains to floods are “Total risk means the expected number of lives lost, persons injured, damage to property and disruption of economic activity due to a particular natural phenomenon, that is, the product of elements at risk and specific risk [9]. Total risk can be expressed in pseudo-mathematical form as: Risk (total) = Hazard * Elements at Risk * Vulnerability” [9].
“Risk is a combination of the chance of a particular event, with the impact that the event would cause if it occurred. Risk therefore has two components – the chance (or probability) of an event occurring and the impact (or consequence) associated with that event. The consequence of an event may be either desirable or undesirable. In some, but not all cases, therefore a convenient single measure of the importance of a risk is given by: Risk = Probability * Consequence.” [10].
“Risk’ is the probability of a loss, and this depends on three elements, hazard, vulnerability and exposure”. If any of these three elements in risk increases or decreases, then risk increases or decreases respectively [11].
Words that are common to these definitions are Vulnerability, exposure and Hazard.
Vulnerability is the capability of or susceptibility to being physically hurt or damaged. In flooding, there is always the probability of the economy, infrastructure and life being vulnerable. Factors that have influence on vulnerability to flood are land cover and land use, nature of population (age, health, mobility), degree of built up areas and type of buildings and the ability to forecast and strategize for imminent hazardous event [12]. This implies although the level of exposure and the risk to flooding may be the same in a selected flood hazard area,
12 there may be different levels of vulnerability based on the stated factors. Mishra [13] classifies flood vulnerability into four categories namely physical vulnerability, economic vulnerability, infrastructure vulnerability and social vulnerability. As indicated in the World Risk report [14], the level at which countries are affected by natural disasters are not the same. Different factors such as stated above have a lot of influence on the level of vulnerability. Figure 1 shows the index of vulnerability of 171 countries to natural disasters as calculated in the world risk report. Vanuatu, a pacific island state is at the highest risk for natural disasters. At lowest country at risk for natural disasters is Qatar. Ghana, with a ranking of 46 and a percentage index of 8.77 is among the countries at vulnerability risk to natural disasters.
Exposure can be defined as a state in which people and livelihoods, environmental services and resources, infrastructure, economic, social, or cultural assets are in places that has no protection and could be harmfully affected [15]. Exposure and vulnerability are not static but rather dynamic in nature. These two vary across time and space, and are very dependent on environmental, social, financial, topographical, demographic, ethnic and governmental factors. The rate at which communities and Individuals are exposed and vulnerable during floods are based on educational and financial inequalities, infirmity and fitness status, as well as other cultural and social characteristics such as sex, class and age.
Figure 1: World Risk Index [15]
Hazard is the likelihood that an extremely possibly destructive natural phenomena occurs that instigate earth movements and windstorms which affect an area in a given moment [16].
13 CSIRO [17] refers to the severity of flood hazard as “being a function of the size (magnitude) of flooding; depth and velocity (speed of flowing water); rate of floodwater rise; duration of flooding; evacuation problems; effective flood access; size of population at risk; land use; flood awareness/readiness; effective flood warning time” and suggests four degrees of hazard; low, medium, high and extreme. Table 1 describes the categories of flood hazards as defined by CSIRO.
Table 1: Flood hazard categories [17].
HAZARD CATEGORY BASE FLOOD EVENTS CHARACTERISTICS
Low 100yr Areas that are inundated in a 100yr
flood, but the floodwaters are relatively shallow (typically less than 1m deep) and are not flowing with velocity, adult can wade.
Medium – Wading Unsafe 100yr The depth and/or velocity are sufficiently high that wading is not possible, risk of drowning.
High - Depth 100yr Areas where the floodwaters are deep
(> 1m), but are not flowing with high velocity. Damage only to building contents, large trucks able to evacuate.
High - Floodway 100yr Typically areas where there is deep
water flowing with high velocity. Truck evacuation not possible, structural damage to light framed houses, high risk to life.
Extreme 100yr Typically areas where the velocity is >
2m/s. All buildings likely to be
destroyed, high probability of death.
Flood risk management is the procedures for planning, executing, and assessing measures, policies and schemes to promote flood risk reduction and transfer, improve the awareness of flood risk and foster regular enhancement in flood disaster readiness, reaction, and rehabilitation practices, with the explicit purpose of increasing human security, well-being, quality of life, resilience, and sustainable development.
Ghana, and in particular Accra, has been plagued with seasonal floods since 1955 [18]. The strategy for flood management by the government is to compensate individuals of the affected areas after flood occurrence. Very little has been done in formulating a plan to mitigate and prepare for flood disasters
In mitigating and preparing for flood events, one practical activity that aids itself to successful management of flood disaster is the production of a flood hazard map, that is, the mapping of
14 areas susceptible to flooding. Flood hazard mapping is a means for evaluating data for a geographic location affected by a flood event and determining the effect or possible effects of the flood event. The production of flood hazard maps requires large amounts of multi -temporal spatial data. Detailed knowledge about the magnitude of the event, characteristics of the event and the frequency of occurrence is required. Remote sensing provides a means of acquiring the needed data. Direct information about a flood event, floodplain topography etcetera, can be derived from remotely sensed image
The volume of data needed to be processed to produce a flood hazard map for integrated planning of flood management, is too much to be handled by manual methods in an effective and timely manner.
1.3 REMOTE SENSING AND GEOGRAPHIC INFORMATION SYSTEM
FOR FLOOD RISK MAPPING AND FLOODING EXTENT
ASSESSMENT
Remote sensing and Geographic information system (GIS) are very useful and effective tools in flood risk assessment and management. Real time flood disaster monitoring, early warning and rapid damage appraisal have greatly improved due to ameliorations in the remote sensing technology and the Geographic Information Systems. Remote sensing is the science technology and art of obtaining data about an object or an area without coming in to physical contact with the object or area of interest [19]. Remote sensing captures information over large areas at short time intervals. Remotely sensed images can be used in delineating flood plains, mapping flood prone areas, land use mapping, flood detection and forecasting, rainfall mapping, evacuation planning and damage assessment. Remotely sensed data, such as satellite imageries, have large synoptic overview which can be used for several applications which include the mapping of a variability of terrain properties needed for flood analysis [19]. GIS is a computer-based system that offers the capabilities for inputting, managing, analyzing and manipulating the huge amounts of data captured for flood risk assessment and management. GIS offers a wide range of tools for modelling flood affected areas and for determining or forecasting flood prone areas. In recent years, remote sensing technology together with GIS application has become a vital means for monitoring floods. In phase one of flood disaster management, GIS and remotely sensed data can be used for warning and monitoring natural disasters and developing disaster risk maps enabling preparedness. In phase two of flood disaster management, remotely sensed data and GIS can be used effectively to assess impact and severity of damage due to a disastrous event and direct relief efforts and search and rescue operations in areas where it is difficult to find one’s bearings.
15
1.4 RESEARCH OBJECTIVE
On the backdrop of the 160 fatalities suffered on the June 3rd 2015 flooding event in Accra Ghana, the overall objective of my thesis research is to demarcate the flood risk areas and create a flood risk map for the Greater Accra Metropolitan Area using remote sensing and Geographic information system. The additional objective of this research is to assess flood damage using remote sensing. In the course of the research, some of the vital tasks to be undertaken for the thesis project include:
1. To derive drainage patterns and watershed areas and model the areas and extent of possible inundation.
2. To derive land cover information from Landsat-8 OLI imagery
3. To understand the causative factors and the dynamics of the Accra perennial flooding. 4. To examine the factors such as rainfall, drainage topography and land use for the flood
risk assessment and determine their relative importance 5. To assess flood damage using Sentinel-1A SAR data
The creation of a flood risk map will assist the government and the local general public to develop effective long term methods of reducing flood-related damage in the region. Land use within the flood risk areas can be controlled using measures such as building codes, zoning regulations and subdivision by-laws. This can lead to limiting the extent of flood damage if flood plains are reserved for uses that are less susceptible to damage from flooding such as parking lots, recreational areas, agricultural activities and etcetera.
1.5 STRUCTURE OF THESIS
This thesis has been organized into 5 chapters. Chapter 1 presents the introduction, the concepts of flood risk, vulnerability, exposure and hazard, and defines the objective of the thesis. Chapter 2 presents a literature review on the different categories of floods and the approaches for flood hazard mapping and Flood disaster management. Chapter 3 presents the study area, the data source and data processing. Chapter 4 presents the methodology and approach employed for this research. Chapter 5 presents the results and analysis. Chapter six presents the conclusion.
16
2. LITERATURE REVIEW
2.1 FLOOD DISASTER MANAGEMENT
In the management of flood disasters, flood hazard/risk mapping is one of the vital steps undertaken to prepare for and mitigate the effects of a flooding event. Some of the other vital steps may include vulnerability analysis, climate forecasting, flood plain management and enforcement of standards and codes [1] [2] [20].
2.1.1 VULNERABILITY ANALYSIS
The population and structures within areas delineated as flood-prone are looked at during a vulnerability analysis. During the vulnerability analysis, the potential costs of flooding are evaluated as pertaining to damage of critical infrastructure such as utilities, bridges roads, buildings and crops. Because vulnerability analysis detects the population at utmost risk, it can also be used to determine the emergency responses that may be essential such as temporary shelters and evacuation parameters [10] [20].
2.1.2 CLIMATE FORECASTING
Based on identified changes in the patterns of ocean and atmospheric circulation, the magnitude of a storm can be forecasted and this information can help in emergency response preparedness. This information can be used to reduce the severity of flooding when it occurs by creating awareness, increasing food storage and management of fresh water [5] [20].
2.1.4 FLOOD PLAIN MANAGEMENT
Activities within areas identified as flood prone can be managed so as to minimize flood damage to existing infrastructure. The measures undertaken to manage activities can be grouped into two; structural and nonstructural measures. Structural measures deals with the construction of protective works such as flood storage reservoirs, storm channels and embankments to carry water away from the flood area. Nonstructural measures help in controlling development in flood prone areas at a low cost. Land-use planning, Zoning of flood-prone lands, Redevelopment of flood-flood-prone areas, Compensation, incentives and Insurance are some of the nonstructural measures that can applied [7] [20].
17
2.1.5 ENFORCEMENT OF STANDARDS AND CODES
Standards and codes for flood-prone areas should be enforced to help minimize the impact of flood events. Enforcement procedures should be simple enough to aid the implementation of penalties with regards to noncompliance to the standards and codes. Regular emergency response drills should be undertaken to ensure that flood prevention measures still work [20].
2.2 TYPES OF FLOODS
Several types of floods occur but based on the geomorphology of a location, only a few may be experienced in that particular location. The following are the classifications that floods are generally grouped into and some of these flood classifications encompasses several flood sub types [12];
1. Pluvial (Surface) Flooding 2. Riverine flooding
3. Groundwater flooding (Ground failures) 4. Coastal flooding
[12] Pluvial, riverine flooding and ground failure are usually affected by surface water runoff. When rain falls onto the surface of the earth, the following happen concurrently; the water either permeates the soil, evaporate or runs over the surface i.e. the hydrological cycle.The magnitudes of each of these actions is greatly dependent on the ground cover which can be built up areas (residential areas, offices and business areas), pavements (parking lots, roads) and open space (grassland, agricultural lands etcetera). When the rate of evaporation and the permeation capacity of the soil is exceeded by the intensity of rainfall or the ground cover is impervious, surface runoff occurs [21].
As population density increases and more areas become urbanized, the amount of impervious areas increases whiles the amount of natural terrain that can absorb rainfall decreases and this in turn leads to an increase in flooding associated with surface water runoff.
2.2.1 PLUVIAL (SURFACE) FLOODING
When heavy rainfall produces a flooding event exclusive of an overflowing water body, it is referred to as pluvial flooding [21]. The most common type of pluvial flooding is urban drainage.
In undeveloped locations, nature provides the drainage system but once an area is built up, it becomes necessary to find ways and means of eliminating excess water which cannot infiltrate
18 the ground due to impervious surfaces [12]. The idea of urban drainage is the use of a closed passage system to contain and dispose of excess surface runoff water after rainfall. This philosophy implies that no matter how heavy the rainfall or how long it last, the drainage system should be able to contain and get rid of the runoff [21].
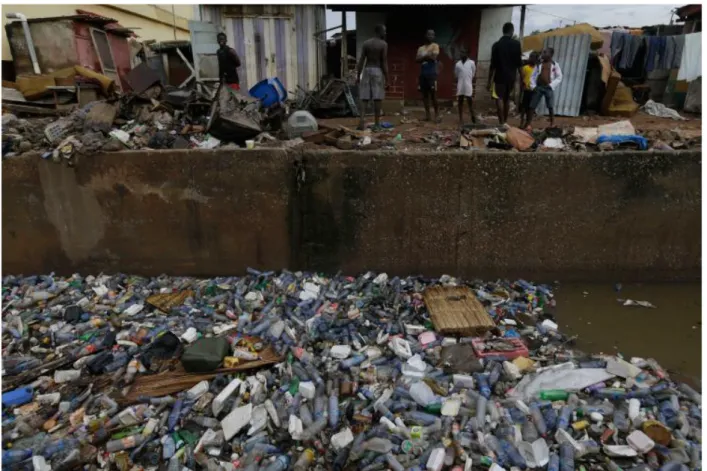
This system works very well in developed countries where all the drains are enclosed and there are gullies under every street constructed to collect water from road surfaces. The only concern is the prevention of downstream flooding and this is done through the regulating and controlling of the runoff water known as storm water management [20]. In developing countries such as Ghana, most of the urban cities have open drains which makes it very easy for rubbish and waste to get inside the drains and choke them as shown in figure 2 below. As these drains are choked, any amount of rainfall lasting any duration results in some form of flooding with heavy downpours resulting in floods whose aftermath is the loss of life and property. This is the most prevalent type of flood in Ghana.
19
2.2.2 RIVERINE FLOODING
Riverine flooding occurs as a consequence of runoff water exceeding the capacity of channels, either natural or man-made, and overflowing to adjacent low lying areas [21]. Riverine flooding dynamics vary with terrain. Runoff in mountainous regions may occur minutes after heavy rainfall but in flat and low lying areas, water may cover the land for days or weeks. There are two different types of riverine flooding and these are overbank flooding and flash flooding. Overbank flooding: This occurs when the volume of water in a river or stream increases and exceeds its capacity and overflows onto adjacent floodplains due to surface water runoff after a heavy downpour, the spill of a dam, melting of snow or ice jams [21]. This is the second most common flood (heavy downpour) event in Ghana.
Flash flood is a fast and dangerous flow of high water into a usually dry area, or a swift rise in a stream or river above a predetermined flood level [6]. It is characterized by a high velocity, intense gush of water that ensues in an existing river channel with little or no notice. Flash floods are more dangerous and destructive to life and property than overbank flooding because of the speed with which flooding occurs and large amounts of debris carried with the flow [6] [21].
2.2.3 GROUNDWATER FLOODING (GROUND FAILURE)
The onslaught of some floods are from below ground. As the water table rises to the surface due to prolonged periods of rainfall, it can wash away portions of the topsoil [7]. This can cause an array of ground failures which includes sinking soil (subsidence) and liquefaction; a development in which water-soaked silt loses stability and acts like a liquid [21]. Subsidence and liquefaction may lead to mud floods and mudflows. Mud flood implies a flood in which the water conveys, about as much as fifty percent (50%) by volume, heavy masses of silt which may include coarse debris [7] [21]. Mud flow refers to a flood which is made up of mud and water: the make-up of the mud is a flowing mass of soft wet unconsolidated earth and fine grained debris.
2.2.4 COASTAL FLOODING
Coastal flooding is caused by the combination of heavy storms or other extreme weather conditions together with high tides which causes sea levels to rise above normal and force sea water on to land [21]. The causal agents for coastal flooding are storm surges and earthquakes. A storm surge is the rise in sea water above normal tide levels due mainly to low atmospheric pressure and wind action over a long expanse of open water. When there is a storm or hurricane, suction is created by the low pressure inside the eye of the storm and this
20 creates a dome of water [5]. If the storm is near land, strong winds in the storm pushes the dome on to land as a surge. Underwater earthquakes, caused by the movement of tectonic plates, offsets large extents of the ocean floor [5]. The abrupt vertical shifts over such large extents displaces large amounts of water, generating long-range and destructive waves known as tsunami [5] [21].
Each type of flooding type and its resulting hazard can be modelled by the different methodologies for flood hazard mapping but some methods are better suited to some forms of flooding depending on the objective and purpose of the map and the availability of data. This thesis focuses on the perennial pluvial flooding (urban drainage) of the city of Accra Ghana. The GIS and remote sensing approach is the methodology that will be utilized due to the unavailability of data for other methodologies.
2.3 METHODOLOGIES FOR FLOOD RISK MAPPING
Flood risk maps are very useful in preparing for and mitigation of floods by minimizing the exposure and vulnerability of human lives, property and infrastructure
In recent time, it is becoming increasingly common to use GIS and Remote Sensing for flood delimitation and its attendant risks and hazards [21]. The usage of GIS and Remote Sensing for flood delimitation is usually carried out conjointly with computer–automated models which combine digital terrain models, hydraulic models and the hydrology of flood plains [21]. There are three different approaches to developing a flood hazard map;
2.3.1 HISTORIC APPROACH
This is based on past flood events.Pertinent information to delineate flood regions may be gathered from old maps, photographs, satellite images, written reports, or any other document. The historic approach is generally used for broad purpose flood assessments maps and initial flood assessment maps. This approach affords data on areas noted to have been inundated in the past by flood waters. The data to be derived from maps and satellite images can be in the form of dates on which flood events occur, the specific location of the affected areas and the extent of damage to human lives, property and infrastructure. Data from written reports make available information about the causes for the floods, the areas affected and the magnitude of the flood. Photographs help to compare current physical conditions of a location with the conditions existing when the reports were written [21]. The disadvantage of the historic approach is that for a particular flood event, there may not be enough information or data covering the whole event and hence resulting flood maps are incomplete [22].
21 Wagemaker and Jjemba [23] generated a flood map for Uganda based on extreme weather events recorded in local newspapers, to aid in the disaster preparedness in flood prone Uganda. Newspaper repositories of the Daily Monitor and the New Vision, both national newspapers, were used as a data source. A database of 3726 news articles between 2001 and 2015 from the two newspapers were used. Using similar features as a base, sentences were clustered s and annotated into four classes: 1. Current flood event 2. Past event or flood warning 3. Mixed and 4. Unrelated. The results yielded a total of 1173 of news articles with flood sentences and geographical reference. These articles were then used to generate a flood map for interested districts.
Boudou et al [24] assessed the temporal evolution of flood vulnerability of two French cities, Besançon and Moissac, through mapping of land use from historical information. The aim of the research was to focus on the two cities that have been significantly flooded in the past and to understand how their vulnerability to flooding had changed up to the present day. An initial total of 176 major floods in France since 1770 were selected based on the following considerations: diversity of flood types, strong flood hazard or spatial extent and important socio-economic impacts. The 176 floods were evaluated and cut down to focus on 9 based on three main features; flood intensity, flood severity and spatial extent of damage. Historical land use data was analyzed to allow the mapping of land use and occupation within the areas affected by the selected floods, both in past and present contexts, to provide an insight of the complexity of flood risk evolution at a local scale.
2.3.2 GEOMORPHOLOGIC APPROACH
This approach involves the interpretation of distinct marks left in the landscape by past Floods and flows. The interpretation can be used to derive flood extents and other parameters such as magnitude of flood can be derived to a certain degree. This approach can also be used for broad purpose flood assessments maps and initial flood assessment maps but it is frequently used for validation during the stage of detailed mapping. The geomorphologic approach maps the geomorphologic indications related to a river or stream. It is based on floodplain analysis, features associated with erosion and sedimentation development, river channels etcetera. The analysis consist of the classification and interpretation of changes detected on the river bed and all observable morphological features [21]. Geomorphologic approach is most advantageous when there is the need to determine the effect of erosion and deposition in the flood plain but the method is rather restraining because it is mostly applied over small areas
22 such as river basins and streams and it is time intensive, in that, it requires data over a long stretch of time of how the landscape has changed with past floods and flows; that is, geological time scale. This method does not also provide any indication of the probability of flood event occurrence [25].
Fernandez-Lavado et al [26] developed a hazard map for flash-floods in the municipality of Jucuaran, El Salvador by mapping the geomorphological evidence such as alluvial fans, preferential stream channels, erosion and sedimentation. The geomorphological effects caused by hurricane Mitch in 1998 were regarded as a reference event. The process for developing the hazard map involved three complementary techniques; vertical aerial photointerpretation of the river basins, Fieldwork and eyewitness reports and Community workshop. Evidence from aerial photographs were corroborated from local people during fieldwork and the community workshop was used to obtain a historical perspective and specific information about the reference event (Hurricane Mitch) to complement eyewitness reports obtained during field work.
Muianga [27] developed a flood hazard zonation map for lower Limpopo, Mozambique using a combination of geomorphological features extracted from aerial photographs together with reports and local knowledge. A process known as ”terrain mapping unit” was used to divide lower Limpopo into 32 units of fluvial, marine, Aeolian and denudational. Four levels of flood hazard were then defined; High, moderate, low and no flood. The units that showed high hazard levels were those formed by recent alluvial deposits and located along the Limpopo River.
2.3.3 MODELLING APPROACH
GIS software together with remote sensing (Microwave and optical Satellite images), hydrological and hydraulic data can be used to simulate floods of different magnitudes. The modelling approach is generally used for detailed flood assessment. To accurately determine and model flood prone areas for an entire series of flood events (for 20 or 30 or 100 years), mathematical applications are essentially required. The modelling approach employs geographic data such as topography, land use and land cover, bathymetry; Hydrological/hydraulic data such as river discharge, rainfall, peak discharge, water velocity and elevation; soil geology, etcetera, to develop flood hazard maps. Currently there are a number of software which can model flood plains in one and two dimensions and generate maps [21]. Given that the modelling approach uses satellite imagery together with a software and given the synoptic nature of satellite imagery, the modelling approach has the advantage that it can be applied over a large area in a comparatively short period of time. It enables direct
23 observations of flood events and prediction of flood events and its behaviour. The disadvantage for optical satellite imagery is that it requires cloud-free conditions, acquired only during daytime, and is unable to penetrate flooded areas under canopies formed by trees. Microwave satellite imagery does not have this problem [22].
Different authors use a combination of GIS with remote sensing or GIS with Hydrological/hydraulic data to undertake flood models. The GIS - Hydrological/hydraulic combination is somewhat more intensive and expensive as compared to the GIS – remote sensing combination as it involves a lot more calculation but if part of the objective is to determine the rate of flow, discharge and the depth of flood waters, then the GIS - Hydrological/hydraulic combination is the best option.
2.3.3.1 GIS WITH HYDRAULIC/HYDROLOGICAL APPROACH
Flood risk assessment and hazard mapping in the flood plain of Bagmati river Nepal was carried out using Advanced Space borne Thermal Emission and Reflection (ASTER) image together with Hydrologic Engineering Center River Analysis System (HEC-RAS) to identify the priority areas and high flood risk zones by simulating the flood flows through the river and its flood plain for discharges corresponding to various return periods. This was done using yearly maximum instantaneous discharges for the period from 1965–2004 [28].
Ologunorisa [29] assessed flood vulnerability zones in the Niger Delta region by using a hydrological technique based on some quantifiable physical features of flooding, observed frequency of flood incidence, elevation and vulnerability factors (social-economic). 18 settlements were randomly selected across three ecological zones in the region and rated based on the parameters stated. Three flood risk zones emerged from the analysis and these were the severe flood risk zones, moderate flood risk zones and low flood risk zones.
Karagiozi et al [30] in their implementation of flood hazard assessment for Laconia Prefecture in Peloponnesus Greece, used hydrological models in a GIS environment (Arc Hydro model). This was done taking into account the geomorphologic features such as slope, elevation, total relief, of the study area. A DEM was used as input data of the Arc hydro model in order to produce the hydrographic network and the hydrological basins layer.
The advantage of approach is that it produces very accurate and detailed results needed for precise risk assessment and hazard mapping but the limitation is that this approach requires extensive field surveys and gauging stations that can collect the data needed for precise risk assessment. These requirements are nearly nonexistent or not readily available in developing
24 countries such as Ghana. For developed countries, it is quite expensive to collect hydrologic data for large areas.
2.3.3.2 GIS WITH REMOTE SENSING APPROACH
Forkuo [31] [32] generated an efficient and cost-effective flood hazard map for the Northern region of Ghana and Atonsu a suburb of Kumasi in the Ashanti region by using a level 1b ASTER imagery to generate contours and elevation. He also generated a topographic map covering the study area at a scale of 1:50000 and a land cover map. He then combined the generated maps and demographic data in a GIS environment, to create a district level map indicating flood hazard prone areas for each district.
Fosu et al [33] used land cover data obtained from a classified ASTER image, contour generated from DEM, geometric data extracted from the DEM, topographic map and field measurements collections together with HEC-RAS model to calculate floodplain elevations and determine floodway encroachments along the Susan River in the Ashanti region of Ghana. The coalesced geometric data together with the topographic maps were used to generate a flood hazard map that covered an area of approximately 2.93 km² and the analysis indicated a flood depth of 4.02m as the maximum water level. This high depth of water occurred along the main channel and spreads gradually to the floodplains.
Flood risk/hazard areas in the Kosi river basin in North Bihar India were identified using Analytical Hierarchy Process (a multi-parametric approach) to integrate geomorphological, geographic, and topographic and social (population density) parameters to propose a Flood Risk Index (FRI) in a GIS environment by Sinha et al [34]. The data used for this included district level maps, topographic maps and census data of 1991, digital elevation data (GTOPO30) and digital remote sensing images Liss-IV, Liss-III.
Georgakakos et al [35] estimated the potential for flash floods in large areas using GIS to integrate digital spatial data, remotely sensed data, with physically-based hydrological, hydraulic models of catchment response. Digital terrain elevation data, Digital River reach data, and the US Geological Survey land use and land-cover data were used to produce estimates of the effective rainfall volume of a certain duration required to produce flooding in small streams in a flood potential index process called threshold runoff.
For very large areas and for areas with unreliable or nonexistent hydrological data such as Ghana, it is advantageous to use this approach since satellite imagery is readily available (e.g. Landsat) and relatively easy to acquire.
25
2.4 REMOTE SENSING FOR FLOOD DAMAGE ASSESSMENT
During floods, decision makers and rescue workers require detailed status reports to identify areas affected by the floods, direct rescue missions and implement mitigation measures. It is imperative that the status reports contain accurate and up-to-the-minute information. Remote sensing helps in the quick assessment of flood damage through the provision of comprehensive, rapid, synoptic and real time multi temporal imagery with information on what is actually happening on the ground.
“Remote sensing is the science and art of obtaining information about an object, area, or phenomenon through the analysis of data acquired by a device that is not in contact with the object, area, or phenomenon under investigation” [19]. By utilizing sensors operating in the visible and microwave spectral bands, remote sensing techniques, combined with topographical and or hydrological data in a GIS environment, enable the rapid acquisition and dissemination of quantitative information over large areas. Information gleaned from the application of remote sensing techniques can be used to assess and model the present damage situation, evaluate processes and trends and provide direction for rehabilitation of flood affected areas.
Long et al [36] used change detection and thresholding (CDAT) with synthetic aperture radar (SAR) imagery to delineate the extent of flooding for the Chobe floodplain in the Caprivi region of Namibia. Change detection and thresholding methods which include image subtraction, decision-based classification with threshold values, in coordination with adaptive filtering and segmentation, were used to determine the extent of inundation during seasonal flood events using ENVISAT/ASAR and Radarsat-2 satellite images.
26
3. STUDY AREA AND DATA DESCRIPTION
The greater Accra region is the smallest region out of the ten administrative regions in terms of area; 1.4 per cent of the total land area of Ghana but the second most populous region with a population of 4,010,054 representing 16.3 per cent of the total population [37]. The region is home to the capital city of Ghana, Accra, and currently harbors the seat of Government. Accra has been experiencing periodic flooding for the past four decades. Between 1955 and 1997, about GH¢300 billion worth of properties have been destroyed, hundreds of lives have been lost either during the flood period or after the floods and tens of thousands of people have been displaced from their homes [38]. The development of a flood risk map and a strategy for flood disaster management for Accra is an essential step to reduce the impacts of floods effectively.
27
3.1 GEOGRAPHY
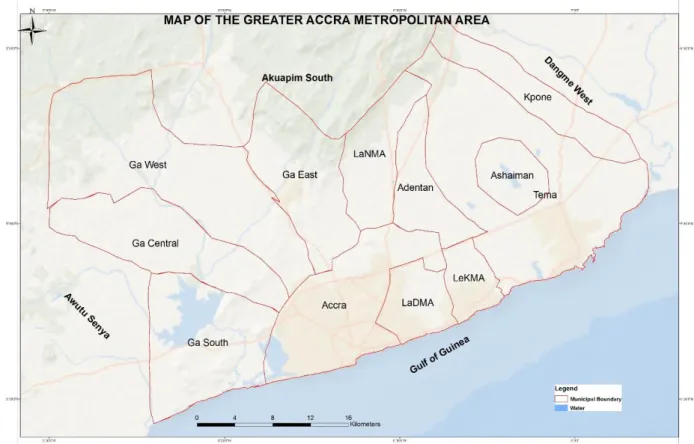
The proposed study area within the Greater Accra region, as depicted in figure 3, covers approximately about 1513 km2 and is bounded on the East by the Dangme West municipality, on the West by the Awutu Senya Municipality, the South by the sea and the North by the Akwapim South municipality. It lies in the dry equatorial zone along the middle to eastern coast of country. It is approximately 5o 36’ 13”N north of the Equator and approximately 0o 11’ 13”W west of the Greenwich Meridian. The Greater Accra Metropolitan Area (GAMA) is characterized by lowlands with gentle slopes and occasional hills averaging an altitude of 20 meters above mean sea level. Some few areas within Kwabenya, Abokobi and MaCarhty hills have slopes above 22 percent.
3.2 GEOLOGY AND SOILS
3.2.1 GEOLOGY
The plains of the GAMA area is mainly underlain with Precambrian Dahomeyan schists, granodiorites, granite gneiss, amphibolite and Precambrian Togo series which comprise mainly of Quartzite, phillite, phyllitones and quartz breccia. Other formation found are Paleozoic Accraian sediments-sandstone, shales interbedded with gypsum lenses [39]. The Accraian sandstones have major faulting and jointing and are prone to earthquakes. The unconsolidated sand and clay along the Sakumono, Densu delta and Nyanyanu experience the greatest seismological activity. Where the underlying rock is found to be hard Togo quartzite and schist or hard Dahomeyan schist and gneiss, the ground is found to be very stable [39].
3.2.2 SOIL
The soils found in the metropolitan area are divided into four types and these are drift materials ensuing from deposits by windblown erosion; alluvial and marine matted clays of fairly recent origin resulting from underlying shales; residual clays and gravels derived from battered quartzite, gneiss and schist rocks; and lateritic sandy clay soils resulting from weathered Accraian sandstone bedrock formations [39].
Patches of alluvial ‘black cotton’ soils are found in many poorly drained low lying areas within the municipality. These soils have a high organic content which readily expand and contract causing major problems with foundations and footings.
The lateritic soils found in some areas are extremely acidic and when saturated tends to attack concrete foundations causing honeycombing.
28
3.3 CLIMATE
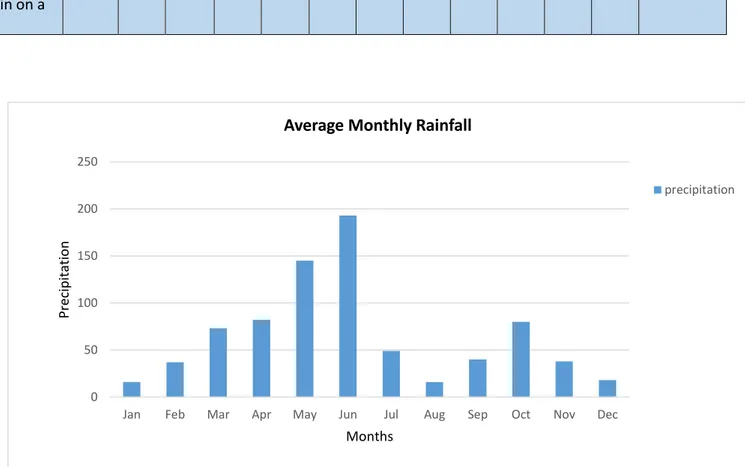
There are notably two rainy seasons in the Greater Accra Metropolitan Area. The first season, which is the major season, starts in May and ends in mid-July. The second (minor) season starts at the beginning of September and terminate at the end of October. The total average annual rainfall is 787mm [40]. Table 2 and figure 4 show the precipitation values for 2015. The driest months are January and August with an average precipitation of 16mm and the wettest month is June with an average precipitation of 193mm.
Table 2: 2015 GAMA Precipitation values. GMET (2015)
JAN FEB MAR APR MAY JUN JUL AUG SEP OCT NOV DEC ANNUAL Average Precipitation mm (in) 16 (0.63) 37 (1.5) 73 (2.9) 82 (3.2) 145 (5.7) 193 (7.6) 49 (1.9) 16 (0.6) 40 (1.6) 80 (3.1) 38 (1.5) 18 (0.7) 787 (31) probability of rain on a day 6% 7% 16% 23% 35% 47% 23% 19% 27% 29% 13% 6% 21%
Figure 4: GAMA 2015 Precipitation graph
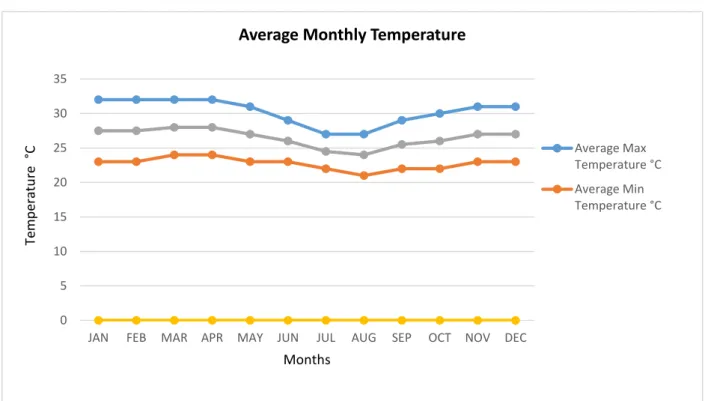
There is very little difference in temperature throughout the year. Temperatures are high throughout the whole year. The mean monthly temperature ranges from 24 °c in August (the coolest) to 28°c in March and April (the hottest) with annual average of 26.5°C. Table 3 and
0 50 100 150 200 250
Jan Feb Mar Apr May Jun Jul Aug Sep Oct Nov Dec
Prec ip ita tio n Months
Average Monthly Rainfall
29 figure 5 show the temperature values for 2015. The mean monthly temperatures vary by a maximum of 4 °C [40].
Table 3: 2015 GAMA Temperature values. GMET (2015)
JAN FEB MAR APR MAY JUN JUL AUG SEP OCT NOV DEC ANNUAL
Average Max Temperature °C 32 32 32 32 31 29 27 27 29 30 31 31 30.3 Average Min Temperature °C 23 23 24 24 23 23 22 21 22 22 23 23 22.8 Mean Temperature °C 27.5 27.5 28 28 27 26 24.5 24 25.5 26 27 27 26.5
Figure 5: GAMA 2015 Temperature graph
3.4 DRAINAGE
The Greater Accra Metropolitan area has a drainage catchment area which extends from the eastern boundary of the Nyanyanu catchment to the east of Tema. The entire catchment comprises four (4) catchment basins; The Densu River and Sakumo, The Korle-Chemu, the Kpeshie and The Songo-Mokwe Catchment areas.
0 5 10 15 20 25 30 35
JAN FEB MAR APR MAY JUN JUL AUG SEP OCT NOV DEC
Te m p era tu re °C Months
Average Monthly Temperature
Average Max Temperature °C Average Min Temperature °C
30 The Densu River and Sakumo Lagoon basin which is the largest with a total drainage area is about 2500 km2. The basin is divided into two sections by the Weija dam; the northern section and the southern section.
The northern section of the basin, which extends 100 km inland into the Akuapim hills along the Densu River and its tributaries, is hilly with the highest point reaching 230m above mean sea level.
The southern section of the basin lie in a low lying land and comprise the Panbros salt pans and the Sakumo I lagoon. The Lafa steam flows into the lagoon and drains much of the western area of Accra including parts of Dansoman, parts of Kwashieman, McCarthy Hill and Awoshie. All these areas are urbanized areas.
The areas along the 8km southern section of the Densu River below the Weija dam is prone to flooding whenever there is deliberate discharge of water over the spillway or overtopping.
The Korle-Chemu catchment covers an area of approximately 250 km2. Gbegbeyise, parts of Dansoman and Kwashieman, New Achimota, Achimota, Lagon, East Legon, Kotoka international Airport and Ridge residential area, all urbanized and heavily populated areas, are drained by the Korle-Chemu catchment.
The Odaw River and its tributaries, the Nima, Onyasia, Dakobi and Ado are the principal streams that drain the catchment area. The Korle Lagoon serves as the principal outlet into the sea for water in this catchment and the Chemu Lagoon is a minor outlet.
The Korle - Chemu basin encompasses the major urbanized areas of Accra. Several of the drainage channels found in these areas are open drains which are poorly developed and maintained.
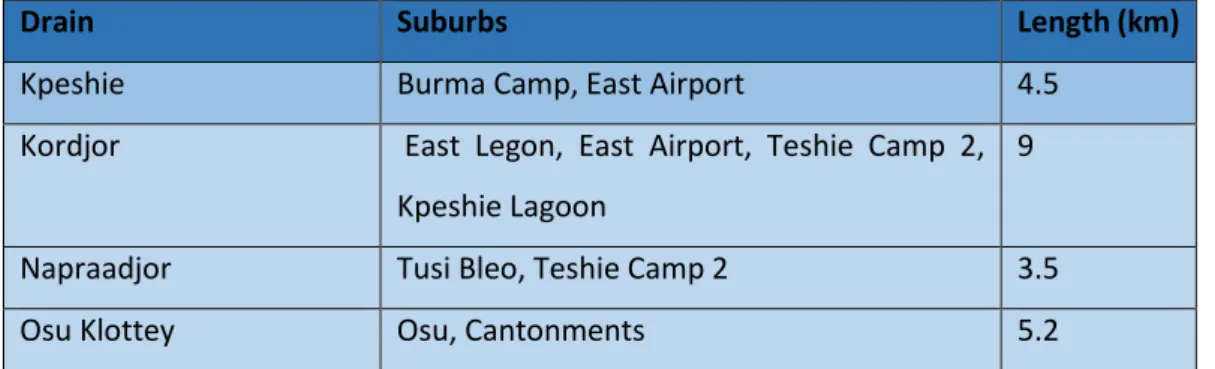
The catchment area covered by the Kpeshie drainage basin is relatively small; 110 km2. The basin drains the Military Academy at Teshie on its east, Madina and Ajirignano on the north and parts of central Accra, Ridge, Cantonments, Osu, Labadi and Burma camp areas on its west.
The principal outlet for drains in this catchment is the Kpeshie Lagoon which empties directly into to the sea or the smaller Korle Lagoon outlet.
31 Some Channels in Christianborg and South La have been straighten to improve flow but these channels are inadequate and open. Channels within this catchment area are insufficient, heavily silted and choked with refuse and are not able to drain runoff water from the surface thereby creating waterlogged areas which become flooded with light rains.
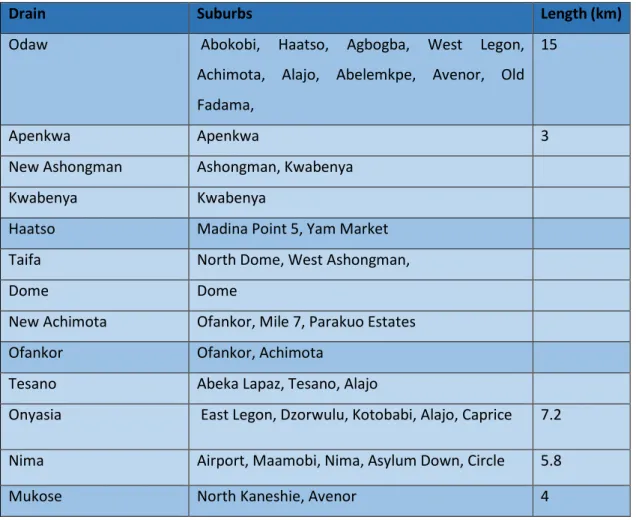
The Songo-Mokwe Catchment is the smallest drainage basin in the metropolitan area covering about 50km2 and draining parts of the Teshie Township to the ridgeline of the Sakumo II catchment. Two main streams, Mokwe and Songo Lagoons drain the Teshie and Nungua townships. Tables 4 to 7 shows the four basins with its various streams and the suburbs they drain.
Table 4: Densu-Sakumono Basin
Drain Suburbs Length (km)
Lafa Sowutuom, Santa Maria, Gbawe 11.5
Mallam (Bawere) Mallam
Table 5: Korle-Chemu Basin
Drain Suburbs Length (km)
Odaw Abokobi, Haatso, Agbogba, West Legon,
Achimota, Alajo, Abelemkpe, Avenor, Old Fadama,
15
Apenkwa Apenkwa 3
New Ashongman Ashongman, Kwabenya
Kwabenya Kwabenya
Haatso Madina Point 5, Yam Market
Taifa North Dome, West Ashongman,
Dome Dome
New Achimota Ofankor, Mile 7, Parakuo Estates
Ofankor Ofankor, Achimota
Tesano Abeka Lapaz, Tesano, Alajo
Onyasia East Legon, Dzorwulu, Kotobabi, Alajo, Caprice 7.2 Nima Airport, Maamobi, Nima, Asylum Down, Circle 5.8
32
Awudome Awudome Estates, South Kaneshie
South Kaneshie Mataheko, Zongo Junction, Graphic Road 3
Chemu Dansoman 4.5
Mamponse Dansoman 2.1
Table 6: Kpeshie Basin
Drain Suburbs Length (km)
Kpeshie Burma Camp, East Airport 4.5
Kordjor East Legon, East Airport, Teshie Camp 2, Kpeshie Lagoon
9
Napraadjor Tusi Bleo, Teshie Camp 2 3.5
Osu Klottey Osu, Cantonments 5.2
Table 7: Songo-Mukwoe Basin
Drain Suburbs Length (km)
Nii Dzor Teshie, Songo 3
Ngaa Dzor Teshie
Teshie Nungua Batsonaa, Teshie Nungua Estates,
Brekese Batsonaa, Nungua, Mokwoe
Mukoe Dzor Sakumono 6.8
3.5 DATA SOURCE
Public and national institutions responsible for the land and rivers in the country (Ministry of Lands and Forestry and the Ministry of water resources, works and housing) do not have any geospatial data on land use / land cover, average water levels of rivers above mean sea level, geology, and etcetera. There are no open source sites to download data from. Private organizations with these geospatial data requires that the data be purchased at a minimum of GHs 5000 Ghana cedis (SEK 10750). To this end, this research is based on data derived from open and free data including Sentinel 1A SAR image, Landsat 8 satellite imagery and Advanced Space borne Thermal Emission and Reflection Radiometer (ASTER)Global Digital Elevation Model (GDEM) version 2, a product of METI and NASA. The table below shows the used data and its source.
33
Table 8: Table of Data
Data Source Data Type
ASTER GDEM United State Geological Survey Earth Explorer(USGS - EE)
Raster
Landsat-8 OLI imagery United State Geological Survey Earth Explorer(USGS - EE)
optical
Sentinel 1A SAR-data European Space Agency radar
Original Geology (soil type)
Accra Metropolitan Assembly Paper map
Geology (soil type) Generated by Author polygon
Rainfall (precipitation) Ghana Meteorological Agency word
Temperature Ghana Meteorological Agency word
The soil type data was acquired as a paper map and this had to be digitized by the author into a format suitable for the GIS environment. Rainfall and temperature data was transferred to excel and saved as CVS (Comma delimited) to be able to use the data in ArcGIS.
ASTER GDEM was generated using stereo-pair images collected by the ASTER instrument onboard Terra. ASTER GDEM coverage spans from 83 degrees north latitude to 83 degrees south, encompassing 99 percent of Earth's landmass. The spatial resolution is 30m (USGS, 2017)
Sentinel-1 is a two satellite constellation with the prime objectives of Land and Ocean monitoring. Sentinel-1 provides C-Band SAR data. The satellites carry a C-SAR sensor, which offers medium and high resolution imaging (5 x 5 m spatial resolution in Strip Map Mode, 5x20 m spatial resolution in Interferometric Wide Swath mode, 25 x 100 m spatial resolution in Extra-Wide Swath Mode and 5 x 20 m spatial resolution in Wave-Mode) in all weather conditions. The C-SAR is capable of obtaining night imagery and detecting small movement on the ground, which makes it useful for land and sea monitoring (ESA Earth online 2017). Sentinel-1A images used for the research were acquired on 12th June 2015 (image A) and 6th June 2016 (image B)
The Landsat-8 Operational Land Imager (OLI) collects images of the Earth with a 16-day repeat cycle, referenced to the Worldwide Reference System. The approximate scene size is
34 170 km north-south by 183 km east-west (106 mi by 114 mi). The spectral bands of the OLI sensor provide enhancement from prior Landsat instruments, with the addition of two new spectral bands: a deep blue visible channel (band 1) specifically designed for water resources and coastal zone investigation, and a new infrared channel (band 9) for the detection of cirrus clouds (USGS, 2015). Landsat-8 OLI image used for this research was acquired on 22nd March 2014.
35
4. METHODOLOGY
The objective of this thesis is to develop a flood hazard map for the Greater Accra Metropolitan area using remotely sensed data in ArcGIS environment. Site visits across the study area were carried out to ascertain the elements that may have causative influence over flooding in the area. The following elements were deemed to have such influence; Flow Accumulation (Drainage/stream network), Elevation, Slope, Land use/cover, Geology (soil type) and Rainfall intensity (precipitation)
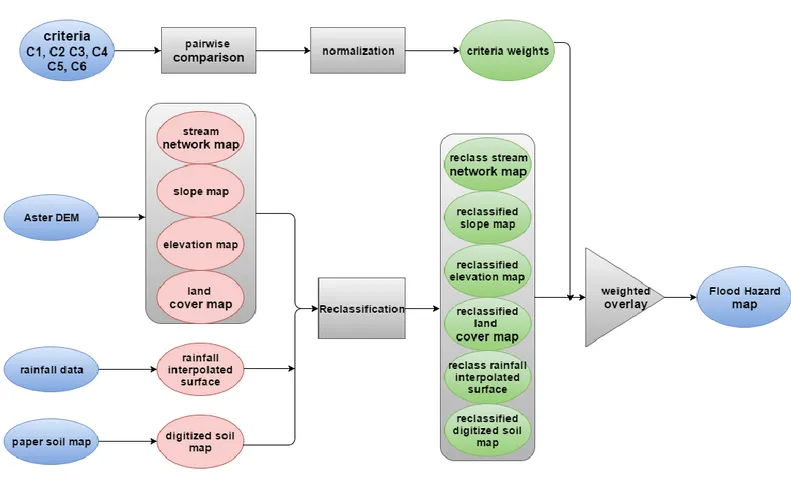
To determine the flood vulnerable areas, Multi Criteria Analysis (MCA) is used. The MCA analysis is done in two phases. The first phase is the use of Analytic Hierarchy Process (AHP), a multi criteria decision tool, to determine the weights of the criteria. AHP constructs a hierarchy of decision criteria using comparisons between each pair of criteria formulated as a matrix. The paired comparisons produce weighting scores that indicates the hierarchy of importance of selected criteria. The second phase then incorporates the determined weights in a weighted overlay process to produce the flood hazard map. Figure 6 is the flow diagram of the methodology
36
4.1 SPATIAL DATA PREPROCESSING
Spatial data is required for the criteria being used for the weighted overlay process. The criteria are; Elevation, Rainfall intensity (precipitation), Flow Accumulation (Drainage/stream network), Slope, Geology (soil type) and Land use/cover. Raster maps for elevation, slope, and drainage are derived from ASTER DEM. A raster map is created for precipitation through surface interpolation. A polygon map for land cover is created from a Landsat 8 image and a polygon map for soil type is digitized from a paper map
4.1.1 THE STREAM NETWORK (FLOW ACCUMULATION)
The stream network is derived from the ASTER DEM. Figure 7 shows the conceptual overview of watershed and stream network delineation. For watershed delineation, a depression-less DEM is needed hence the sink tool in ArcGIS hydrology is used to locate sinks in the DEM and the fill tool is used to fill the identified sinks. Flow direction tool is then applied to compute the direction that water would flow for every cell and flow accumulation calculates the number of cells flowing into each cell of the filled DEM. Areas with very high values may possibly be perennial streams or rivers, areas with lower values may be sporadic streams. The Flow Accumulation grid allows for the determination of areas draining to points on the DEM. The Basin tool is then used to create watersheds. The Basin tool finds its own pour points and creates watersheds for the whole map.
37 To determine the stream network a conditional statement is applied to the flow accumulation raster.
The idea is to reclassify all cells that meet a certain accumulated flow threshold to be 1, and all other cells to be no data. The threshold used for this analysis is 1500 which implies that all cells with a value greater than 1500 are reclassified as 1. The threshold of 1500 was chosen because it gave the best representation of the drainage basin stated above in chapter 3 section 3.4
The conditional statement “Con ("FlowAcc_Flow1" > 1500, 1)” is created with the Raster Calculator. This produced a detailed stream network raster for the area covered by the Flow Accumulation grid which is then reclassified to the predefined rankings. In the reclassification of the flow accumulation grid, flow accumulation between 24528 and 32408 were deemed to have the highest flood causing influence and hence was assigned the ranking “very high”. Flow accumulations between 15378 and 24528 were deemed to have the next highest flood causing influence and therefore assigned the ranking of “high”. Flow accumulations between 6863 and 15378, 1652 and 6863, 0 and 1652 were then subsequently assigned moderate, low and very low rankings respectively (table 9).
Table 9: Flow Accumulation ranking
Flow accumulation Ranking % Weight 19
24528 – 32408 Very high 15378 – 24528 High 6863 – 15378 Moderate 1652 – 6863 Low
0 – 1652 Very low
4.1.2 ELEVATION AND SLOPE
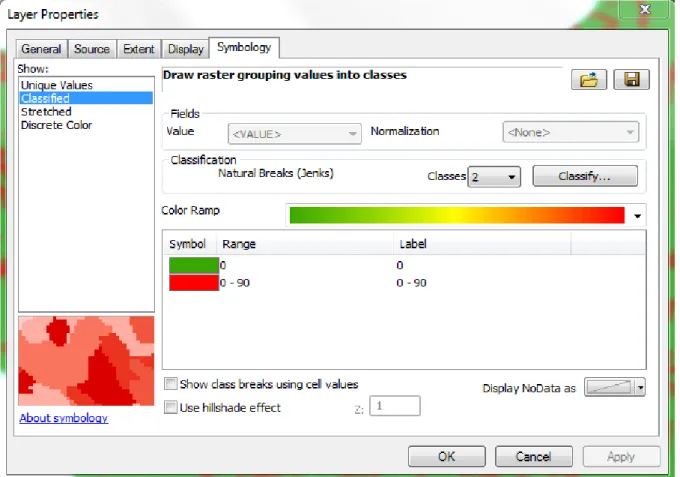
The elevation and slope are determine from the ASTER DEM using surface analysis tools under the spatial analyst tool bar in ArcGIS. Contours of the study area are extracted from the DEM and this is used to generate the slope and elevation maps. The steepness of the slope affects the flow and inundation of a particular area. Low-lying areas with gentle slope angles have the tendency to be inundated first as compared to areas with steep slope angles during flooding. Flat terrain decreases water runoff and this causes high infiltration where there is open soil, or stagnation where there is impermeable surface leading to water logging condition. The slope map is classified into two classes using Natural Breaks (Jenks) distribution (figure 8, table 10). Class 1: 0o and class 2: 0o-90o and these classes are then assigned into the predefined rankings
38 The elevation map is classified into five classes using Natural Breaks (Jenks) distribution because it identifies real classes within the data and creates choropleth maps that have accurate representations of trends in the data [41]. class 1: 0-39 m; class 2: 39-75 m; class 3: 75-156; class 4: 156-377; class 5: 377-65535 and these classes are then reclassified into the predefined rankings (figure 9, table 11)
Figure 8: slope classification
The slope map is reclassified into two rankings, very high and high, based on the classes obtained from the Jenks distribution
Table 10: Slope ranking
Slope o Ranking % Weight 13 0 Very high
39
Figure 9: reclassification process Table 11: DEM ranking
DEM (m) Ranking % Weight 29
0 - 39 Very high 39 – 75 High 75 – 156 Moderate 156 – 377 Low 377 - 65535 Very low
4.1.3 LAND USE/COVER
The land use/cover map of the study area is classified from a Landsat-8 OLI satellite imagery acquired on March 22, 2014. Iso cluster Unsupervised classification was carried out to generate the land use/cover map. In unsupervised classification, clusters are created from pixels with similar statistical properties [42]. The created clusters have no definite meaning and classification is done by the user. Thirty spectral classes are defined for the classification of the image. This is because although five land cover classes are to defined, these classes may contain a range of spectral identities. The five cover classes are color coded and the colors for the thirty spectral classes are changed to fall into one of the five colors. This defines that pixel as belonging to that feature. Unsupervised classification was used for the land use classification because training areas defined under supervised classification classified some features in the wrong class. The created LULC map included five features namely; forest,
![Figure 1: World Risk Index [15]](https://thumb-eu.123doks.com/thumbv2/5dokorg/4596811.118231/12.892.108.820.666.1040/figure-world-risk-index.webp)