www.vti.se/publications Christer Ahlström Anne Bolling Gunilla Sörensen Olle Eriksson Anders Andersson
Validating speed and road surface realism
in VTI driving simulator III
VTI rapport 745A Published 2012
Publisher: Publication:
VTI rapport 745A Published: 2012 Project code: 200917 Dnr: 2006/0764-25
SE-581 95 Linköping Sweden Project:
Shake
Author: Sponsor:
Christer Ahlström, Anne Bolling, Gunilla Sörensen, Olle Eriksson and Anders Andersson
VTI
Title:
Validating speed and road surface realism in VTI driving simulator III
Abstract
New simulator models concerning vibration, noise and graphics have been designed and implemented in the VTI Simulator III. The objective of this study is to validate this simulator in terms of road surface realism.
Twenty-four drivers participated in the study and drove the same route both in the simulator and on real roads. Three road sections ranging from very smooth to rather uneven were incorporated in the design. The comparison included the objective driving parameter speed as well as subjective parameters from questionnaires and rating scales (evenness, quietness and comfort level). A road section with five speed limit changes was of particular interest in the analyses.
No statistically significant difference could be found between the simulator and the car, neither in the parameter speed (in sections with no speed limit changes) nor in the ratings evenness and quietness. Despite similar speed profiles surrounding the speed limit signs, there was a statistically significant difference between the speed in the car and in the simulator, with more rapid accelerations and decelerations in the simulator. The comfort rating was shown to be higher in the car compared to the simulator, but in both cases the general trend showed higher comfort on smoother roads.
These results indicate absolute validity for the ratings evenness and quietness, and for the measure speed, and relative validity for comfort and speed surrounding speed limit signs.
Keywords:
simulator, validation, speed, comfort, noise, vibration, evenness
Utgivare: Publikation:
VTI rapport 745A Utgivningsår: 2012 Projektnummer: 200917 Dnr: 2006/0764-25 581 95 Linköping Projektnamn: Shake Författare: Uppdragsgivare:
Christer Ahlström, Anne Bolling, Gunilla Sörensen, Olle Eriksson och Anders Andersson
VTI (Swedish National Road and Transport Research Institute)
Titel:
Validering av hastighet och uppfattning om vägytor i VTI simulator III.
Referat
Nya simulatormodeller för vibrationer, ljud och grafik har utvecklats och implementerats i VTI:S fordonssimulator III. Syftet med denna studie är att validera simulatorn med avseende på hastighet och återgivandet av olika vägyteparametrar.
Tjugofyra försökspersoner deltog i studien. De fick köra en och samma rutt i såväl simulator III som på verklig väg. Tre vägavsnitt med olika kvalitet på vägytan, från mycket slät till ganska ojämn, ingick i försöket. Såväl den objektiva förarparametern hastighet som olika subjektiva parametrar avseende förarens uppfattning om vägytans egenskaper (jämnhet, tysthet, komfort) jämfördes. Ett vägavsnitt med skiftande hastighetsgränser var av speciellt intresse.
Ingen signifikant skillnad kunde noteras mellan körning i simulator och på verklig väg vare sig avseende hastighet (på avsitt med konstant hastighetsgräns) eller gradering av jämnhet och tysthet. För sträckan med skiftande hastighetsgränser fanns dock en signifikant skillnad mellan hastigheten i bil jämfört med hastigheten i simulator, trots liknande hastighetsprofiler. Såväl accelerationerna som retardationerna var snabbare i simulatorn. Vägkomforten graderades högre i bil än i simulator, men i båda fallen var
tendensen den att slätare vägar gav högre värdering av komforten.
Dessa resultat indikerar absolut validitet för graderingen av jämnhet och tysthet och för det objektiva måttet hastighet, medan relativ validitet indikerades för såväl hastighet vid skylt för hastighetsändring som för gradering av komfort.
Nyckelord:
simulator, validering, hastighet, komfort, buller, vibration, vägyta
Preface
VTI has during three years performed an internal project, funded from the annual appropriation, called SHAKE. The aim has been to develop and implement models in VTI driving simulator III that use measured road data for generating realistic vibrations and audible road noise connected to the visual impression presented on the projection screen. This is one in a series of two reports that summarises the results of the SHAKE project. While this report presents a validation study comparing the simulator to real world driving, the other report focuses on the technical details entailed in developing and implementing the new models.
All authors have contributed to many parts of the project, but in particular, Gunilla Sörensen executed the trials, Anders Andersson dealt with the simulator, Christer Ahlström performed data pre-processing and data extraction, and Olle Eriksson made the statistical analyses.
We greatly acknowledge Hans-Erik Pettersson who helped shape the project in its early stages, and Harry Sörensen, who set up the data acquisition system for the field trials.
Linköping October 2012
Quality review
Review seminar was carried out on 29 October 2012 where Carina Fors reviewed and commented on the report. Christer Ahlström has made alterations to the final
manuscript of the report. The research director of the project manager Jonas Jansson examined and approved the report for publication on 23 November 2012.
Kvalitetsgranskning
Granskningsseminarium genomfört 29 oktober där Carina Fors var lektör. Christer Ahlström har genomfört justeringar av slutligt rapportmanus. Jonas Jansson har därefter granskat och godkänt publikationen för publicering 23 november 2012.
Table of contents
Summary ... 5
Sammanfattning ... 7
1 Introduction ... 9
1.1 Driving simulator validity ... 9
1.2 Aim of the study ... 10
2 Method ... 12 2.1 Experimental design ... 12 2.2 Participants ... 14 2.3 Procedure ... 15 2.4 Experimental roads ... 16 2.5 Measurements ... 20 2.6 Analyses ... 21 3 Results ... 23
3.1 Objective data – driving behaviour ... 23
3.2 Subjective data – grades of evenness, quietness and comfort ... 25
3.3 Subjective data – questionnaire ... 26
4 Discussion ... 28
4.1 Statistical model ... 28
4.2 Result discussion ... 28
4.3 Limitations ... 29
4.4 Possible future studies ... 30
References ... 32 Appendix 1
Validating speed and road surface realism in VTI driving simulator III
by Christer Ahlström, Anne Bolling, Gunilla Sörensen, Olle Eriksson and Anders Andersson
VTI (Swedish National Road and Transport Research Institute) SE-581 95 Linköping, Sweden
Summary
The SHAKE project has designed and implemented new simulator models concerning vibration, noise and graphics in order to improve the overall realism in simulator III, particularly concerning the interaction between what you see, hear and feel when driving on, for example, a road surface with repair patches, edge deformations and cracks. The objective of this study is to validate the VTI driving simulator III in terms of road surface realism.
Twenty-four drivers participated in the study and drove the same route both in the simulator and in a real passenger car. Three road sections ranging from very smooth to rather uneven with international roughness indices (IRI) of 1.0 – 2.6 were incorporated in the design. The comparison included objective driving parameters (speed and lane position) as well as subjective parameters from questionnaires and rating scales (evenness, quietness and comfort level). A road section with five speed limit changes was of particular interest in the analyses.
Absolute validity was indicated for the subjective ratings evenness and quietness, and for the objective measure speed. Relative validity was indicated for the variables
comfort and speed surrounding speed limit signs. Due to methodological issues no
results for lane position could be obtained.
Based on the results, we recommend that future projects run in Simulator III should use the SHAKE models.
Validering av hastighet och uppfattning om vägytor i VTI simulator III
av Christer Ahlström, Anne Bolling, Gunilla Sörensen, Olle Eriksson och Anders Andersson
VTI
581 95 Linköping
Sammanfattning
Nya modeller för vibrationer, brus och grafik har nyligen implementerats i VTI:s simulator III. Den huvudsakliga intentionen har varit att förbättra upplevelsen av olika vägytor, genom att synkronisera det föraren ser, hör och känner, för att därigenom öka simulatorns realism. Denna rapport beskriver en valideringsstudie för att undersöka eventuella skillnader mellan hur förare uppfattar simulatorn jämfört med att köra bil på en riktig väg.
Tre olika vägar med olika kvalitet på vägytan, från väldigt jämn (IRI = 1,0) till relativt skakig (IRI = 2,6), och med olika egenskaper avseende vibrationer och buller, har återskapats i simulatorn. Tjugofyra förare fick köra på dessa vägar både i simulator och i verklig trafik och skatta hur jämn, tyst och komfortabel de tyckte att varje väg var. Även objektiva mått som hastighet och lateral position samlades in. En vägsträcka, som hade fem hastighetsförändringar, detaljgranskades under analysen.
Resultaten indikerar absolut validitet för simulatorn för de subjektiva skattningarna av
jämnhet och tysthet, och även för det objektiva måttet hastighet. För komfort och för hastighet runt skyltar med hastighetsförändringar uppnåddes relativ validitet. Lateral position kunde tyvärr inte undersökas på grund av tekniska problem.
Baserat på resultaten i denna studie rekommenderar vi att de framtagna SHAKE-modellerna används i alla framtida projekt i simulator III.
1
Introduction
There are three main sensory modalities that affect how a driver perceive a virtual environment; the visual system, the motion system including kinesthetic feedback through control loading, and the sound system (Kemeny and Panerai, 2003). The SHAKE project was initiated to address all of these sensory modalities and to develop and implement new models concerning vibration, noise and graphics in order to improve the realism of road surfaces in the simulator (Bolling et al., 2012). For example, when driving over a patch or a crack this should be felt, heard and seen, and all of these impressions should be matched and synchronized. This report describes a validation study of the VTI Simulator III after the implementation of the new models that were developed in the SHAKE project.
1.1
Driving simulator validity
Depending on the scenario and the aim of the study, validity can in some cases be achieved using a simple desktop simulator, while in other cases validity cannot be achieved even in advanced motion-based high-end simulators (Jamson, 2011). Simulator validity concerns vehicle behaviour as well as driver behaviour (Jamson, 1999). Physical validity measures the degree to which the simulator dynamics and visual system reproduce the vehicle being simulated, whereas behavioural validation refers to a simulator’s ability to induce the same response from a driver as would be performed in the same situation in real life. Although physical validity is important, ultimately it is the behavioural validity that is important in the collection of traffic data. Physical validity may, on the other hand, help strengthen behavioural validity.
Behavioural validity may have different levels of accuracy. According to Kaptein et al. (1996), validity can be divided into:
• Absolute and relative validity – The driving simulator has absolute validity with regard to the research question if the absolute size of the effect is comparable to the absolute effect in reality. The driving simulator has relative validity with regard to the question if the difference is in the same direction and relative size of the effect of the measure as in reality.
• Internal and external validity – Internal validity refers to the relationship
between the manipulation and the obtained effect with no alternative explanation of the effect. External validity refers to the extent to which the results can be generalized to other situations.
• Validation of realism – This refers to what extent the research situation appears realistic to the driver. The realism can, for example, influence the motivation of the driver, and therefore the results.
• Statistical validity – Statistical validity refers to statistical tests that can be conducted on the data.
Simulator validation studies typically use conventional statistical approaches such as analysis of variance to determine differences between the simulator and real-world driving. Absolute validity is claimed if group means does not differ significantly between the simulated and on-road drives (Mullen et al., 2011). If the mean values do show a significant difference, but the variables are changing in the same direction across levels of another independent variable such as road type, relative validity is claimed.
Another approach for evaluating validity is to compare the entire driving profile for a region of interest. This approach captures the interactive, or dynamic, validity of the simulator and allows comparison of patterns of driving performance. Correlation analysis is typically used to establish this type of validity (Mullen et al., 2011).
A central issue when planning a validation study is what to compare the simulator with. A frequently used method is to implement a real road in the simulator and to conduct a controlled within group experiment where the same drivers drive in the simulator and on the real road in an instrumented car (Hakamies-Blomqvist et al., 2000; Klee et al., 1999; Mayhew et al., 2011; Senserrick et al., 2007; Shechtman et al., 2009; Shinar and Ronen, 2007; Törnros, 1998). A disadvantage of using instrumented vehicles, which includes real cars as well as simulator cars, is that they are part of an artificial
environment, where drivers do not drive their own car and are aware that they are being monitored (Blana, 1996). For the simulator part of the experiment, this cannot be avoided, but instead of running a controlled real road experiment, real road data can be obtained from measurements of e.g. speed in real traffic situations (Bella, 2008;
McAvoy et al., 2007; Yan et al., 2008). Yet another alternative is to let drivers drive in the simulator only and do the validation evaluation from questionnaires (Cossalter et al., 2010).
Research indicates that the speed is greater, that the variability in lateral position is larger, and that the mental effort required to perform a secondary task is larger in the simulator compared to real-world performance (Jamson, 2011; Mullen et al., 2011). A wide range of driving parameters, situations and behaviours may be used when
conducting a validation study. However, a single experiment is often dedicated to investigate one or a few aspects of validity. Speed is the most commonly investigated parameter and it has been used in general (Bella, 2008; Kaptein et al., 1996; Klee et al., 1999; Senserrick et al., 2007; Shinar and Ronen, 2007) as well as in more specific situations such as at road work sites (Bella, 2005; McAvoy et al., 2007), in intersections (Yan et al., 2008), in tunnels (Törnros, 1998) or in relation to speeding countermeasures (Godley et al., 2002). Similarly, lateral position is a frequently investigated parameter (Alm, 1996; Hakamies-Blomqvist et al., 2000; Harms, 1996; Törnros, 1998). Other parameters that have been used for simulator validation are e.g. , route choice (Kaptein et al., 1996), reaction times (Engen, 2008; McGehee et al., 2000), braking behaviour, steering wheel movements (Hakamies-Blomqvist et al., 2000) and driving errors (Mayhew et al., 2011; Shechtman et al., 2009). These studies typically conclude that simulators are not perfect surrogates for the on-road setting, but people’s behaviour is similar in simulators and on the road. Even self-reports on driving behaviour, which are often difficult to assess, can be predicted from simulated driving (Reimer et al., 2006). Limitations in driving simulators may lead to imperfect replication of real driver behaviour and performance. Typically encountered problems include that the standard deviation of lane position is either too small or too large, speeds are too steady,
participants drive too fast, slow down too much, follow a lead vehicle from too far when distracted, or take too long to respond to signs (Green, 2005). Green (2005) suggests that this may be because the simulator vehicle is too stable or, because there are no handling imperfections, road imperfections or environmental disturbances.
1.2
Aim of the study
The aim of this study was to validate VTI driving simulator III in terms of how realistic the sound and vibration representation of the road surfaces was perceived.
Due to the improvements of the different simulator models the following hypotheses were tested:
• There is no difference between the subjective ratings on the real road and in the simulator concerning evenness, quietness and overall comfort.
• There is no difference between the real road and the simulator concerning the objective measures speed and lane position.
2
Method
In this experimental study, data from experiments in the VTI Driving Simulator III have been compared with data from experiments in a Volvo V70 driven in real traffic.
Simulator III is a moving base simulator with a 120 degrees forward field of view (VTI, 2012). The cabin is a Saab 9 3, and, in this experiment, the simulator had an automatic gearbox. The instrumented vehicle was a Volvo V70 of model year 2009. The car had a manual gear box. The V70 was equipped with 225/50R17 tires during the trial.
Unfortunately, comparable data of the tire model used in the simulator cannot be obtained.
Typically the level of vibration is experienced rougher in a simulator than on a real road. In order to deal with this a “scale factor” is used to dampen the vibrations in the simulator. When assessing the physical validity of a simulator, absolute validity can only be claimed if the scaling factor is found to be 1.0. In this study, the scaling factor was set to 0.2 to get a subjectively determined high correspondence between vibrations in the simulator and vibrations on the road. Given this scaling factor, we have assessed the behavioural validity based on the assumption that the simulator is tuned the best way possible. This means that even though absolute physical validity cannot be achieved (since the scale factor is not one) it is still possible to reach absolute behavioural validity.
In order to study the absolute validity of the simulator, data from three real roads were used to produce the corresponding roads in the simulator. Participants were asked to drive the three roads in a given order, both in real traffic and in the driving simulator. Both objective and subjective data have been collected. Speed and lane position data were recorded and the participants were asked to grade the noisiness and evenness of the road surface and the overall comfort.
Statistical testing of the differences between the simulator data and the real traffic data was performed. Also differences between the subjective ratings of the road surfaces were analysed.
2.1
Experimental design
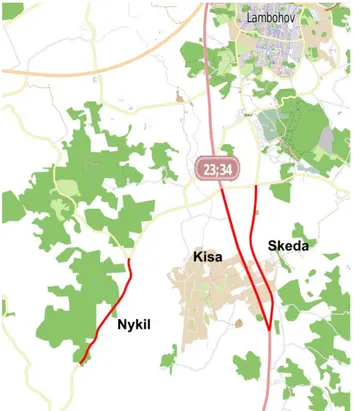
Three roads situated south of Linköping in Sweden were chosen for this comparative study (see map Figure 1); road Kisa, road Nykil and road Skeda. The three roads were chosen due to their varying characteristics regarding the quality of the road surface, the speed limit and the road environment.
Figure 1: The three roads that were used in the study. Map data © OpenStreetMap contributors.
When designing the experiment the following parameters where taken into account, as they may affect the results of the study;
• Order of the three roads
• Order of the two parts of the experiment (simulator drive vs. field drive) • Experience of driving the three roads and using the 7 graded scale on these
roads.
Six different routes were designed, including each of the three roads exactly two times in each direction. The first half of each route included all roads and directions, as did the second half. The purpose of the first half was to calibrate the rating scale and was, hence, not used in the analyses. For each individual participant the routes were the same in the simulator (simulator) as in the car (VolvoV70). Half of the participants started, however, in the simulator, while the other half started in the car, see Table 1.
Table 1: Experimental design.
Participant Route Order Participant Route Order
1 1 Sim - V70 13 1 V70 - Sim 2 2 Sim - V70 14 2 V70 - Sim 3 3 Sim - V70 15 3 V70 - Sim 4 4 Sim - V70 16 4 V70 - Sim 5 5 Sim - V70 17 5 V70 - Sim 6 6 Sim - V70 18 6 V70 - Sim 7 1 Sim - V70 19 1 V70 - Sim 8 2 Sim - V70 20 2 V70 - Sim 9 3 Sim - V70 21 3 V70 - Sim 10 4 Sim - V70 22 4 V70 - Sim 11 5 Sim - V70 23 5 V70 - Sim 12 6 Sim - V70 24 6 V70 - Sim
When connecting the three roads into a route, it is apparent that road Nykil has to be treated as a “dead end” where the driver has to change direction and go back the same way. For this reason all road stretches, except the first road on each route, were treated as dead ends where the driver traversed each road in both directions consecutively. A fully balanced study design was created with respect to order of the roads but, hence, not the road direction, see Table 2.
Table 2: The six routes were the following (blue=Kisa, pink=Skeda, yellow=Nykil, 1=southbound, 2 northbound).
Route 1 Route 2 Route 3 Route 4 Route 5 Route 6
F
irs
t
hal
f
Kisa 2 Kisa 2 Skeda 2 Skeda 2 Nykil 2 Nykil 2 Skeda 1 Nykil 1 Kisa 1 Nykil 1 Kisa 1 Skeda 1
Skeda 2 Nykil 2 Kisa 2 Nykil 2 Kisa 2 Skeda 2
Nykil 1 Skeda 1 Nykil 1 Kisa 1 Skeda 1 Kisa 1 Nykil 2 Skeda 2 Nykil 2 Kisa 2 Skeda 2 Kisa 2 Kisa 1 Kisa 1 Skeda 1 Skeda 1 Nykil 1 Nykil 1
S ec on d h a
lf Skeda 2 Skeda 2 Kisa 2 Kisa 2 Nykil 2 Nykil 2
Kisa 1 Nykil 1 Skeda 1 Nykil 1 Skeda 1 Kisa 1 Kisa 2 Nykil 2 Skeda 2 Nykil 2 Skeda 2 Kisa 2 Nykil 1 Kisa 1 Nykil 1 Skeda 1 Kisa 1 Skeda 1
Nykil 2 Kisa 2 Nykil 2 Skeda 2 Kisa 2 Skeda 2
Skeda 1 Skeda 1 Kisa 1 Kisa 1 Nykil 1 Nykil 1
2.2
Participants
All together 24 drivers, 10 women and 14 men, participated in the experiments. Their mean age was 40 years (SD 13). The drivers were recruited among volunteers that had shown their interest in participating in VTI studies. All lived within a radius of
approximately 100 km from Linköping.
Drivers with minor driving experience as well as drivers with long experience
13) and drove 24604 kilometres annually (SD 28648). On average they drove just as often in the city as on the countryside, still a few drove mostly on the countryside while a few others drove mainly in the city.
2.3
Procedure
A number of drivers were contacted via telephone. Those who agreed to participate were sent a mail including a description of the experiment in general terms, a map with road directions to VTI and a reminder of the time and date of the experiment. At the arrival they were asked to read an instruction explaining the experiment in detail and to sign a letter of consent. Next, they answered a questionnaire collecting behavioural data and background data. Thereafter the first part of the experiment took place according to the experiment design, either in a Volvo V70 or in the VTI driving simulator III. The drivers had about 10 minutes of getting used to driving the vehicle before the route started, both in the simulator and on the road. In the simulator the training phase was carried out by driving one of the simulated roads (Kisa, southbound). In real traffic the participant drove the car from VTI to the first road of the route, which in all cases meant driving on one of the experimental roads before the actual trial started.
The designated route contained three roads that were driven in both directions according to the experimental design. Immediately after each road stretch the driver rated
noisiness, roughness and the overall comfort of the road surface. This was noted by the test leader on a form. In the simulator, the simulator came to a halt during the ratings. During this pause the participant was automatically taken to the next road on the route in question.
During the first half of the route the participants were instructed to change the level of their rating scales if they felt that they had rated the first roads too high or too low. This was to calibrate the scale, and to assure that they gave the “correct” rating during the second half of the route, which was the only part that was evaluated. This procedure was the same in both the simulator and the car.
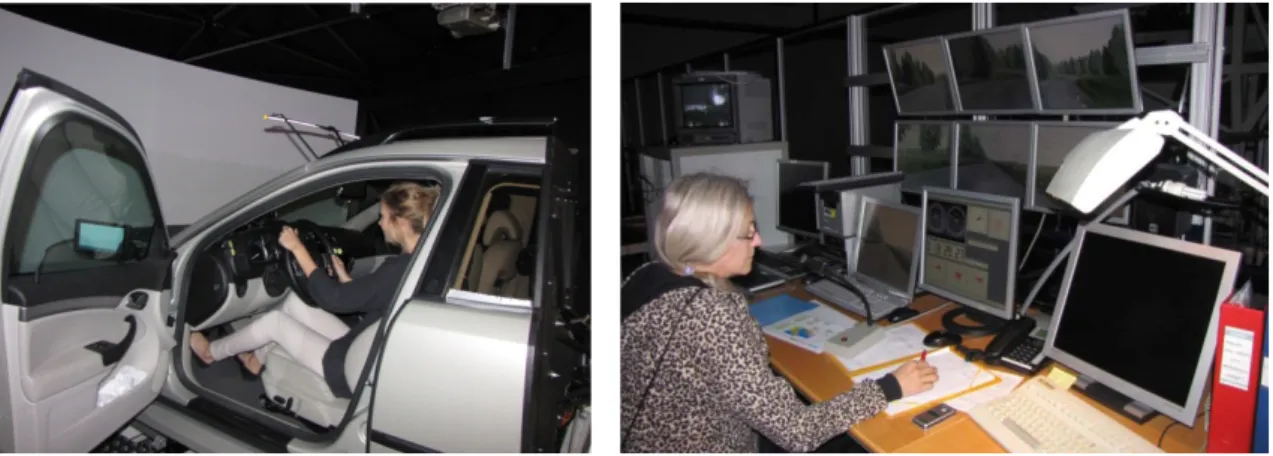
The drivers were monitored by the test leader both when driving simulator (see figure 2) and when driving the car. The test leaders were instructed to notice any unusual events. After having driven the chosen route both in the simulator and in real traffic according to the order of the design scheme, the participants were asked to answer two
questionnaires concerning the experiment and the simulator, respectively. The trial lasted approximately three hours and the participants each received a payment of 500 SEK (approximately €50).
The instruction, the letter of consent, background data questionnaire, the rating form, the experiment questionnaire and the simulator questionnaire can all be found in the appendix.
Figure 2: One of the participants adjusting her driving position in the VTI Driving Simulator III (left). The test leader monitoring the simulator drives (right).
2.4
Experimental roads
The three roads Kisa, Nykil and Skeda were modeled in the simulator based on road surface measurements acquired with the VTI Laser RST (Forsberg and Göransson, 2005). The following road characteristics were used to render a realistic road geometry: the longitudinal vibration profile was used to simulate realistic unevenness, the
longitudinal slope profile was used to support the up and down hill effects, the mean transverse profile was used to create the effects of transverse unevenness such as rut
depth and also to create sections with water ponds, and the crossfall parameter was used to support the slope of the transverse shape. Also the road width and curvature were identical between the real roads and the simulated roads. Implementation details are described in Bolling et al. (2012).
The road surface measurements had some limitations which had an impact on the implementation in the simulator. The longitudinal vibration profiles were shorter than the longitudinal slope profiles why the longitudinal vibration profiles were repeated to fit the size of the longitudinal slope profiles. Further, only one lane for each of the roads was measured why the same longitudinal vibration profiles were used in both directions when implementing the roads in the simulator.
Each road has been modeled to present an overall feeling of the road in the simulator and the aim was that the driver should recognize the environment. It is not feasible to recreate the full scenery in high detail. Instead, the focus is on incorporating key objects and scenes into the model. A road can be divided in different compartments or rooms, where each room has its own characteristics. One room may consist of an open field, another of a small village and a third of a forest. There is usually an opening or a closing in the environment that can be used to demarcate each room. The resemblance between the real road and the simulated road is illustrated in Figure 3 – Figure 7. As described above, it can be seen that many details are missing, yet the general feeling is captured in each room. All traffic signs, street lights and bus stops are present along with the key buildings and the demarcations between the rooms. On a more general level, the modeled road surface is built with textures that are similar (but not identical) to the real road, potholes and cracks are present with a frequency similar to the real road, forests and groves are set up to mimic the real world scenery, and the density of vegetation is comparable. The overall characteristics of each road are provided in sections 2.4.1 – 2.4.3.
2.4.1 Road Kisa
The Kisa road is a 3.4 kilometres long road stretch located on road 34 between
Linköping and Kisa. The road is characterised by the presence of a crash barrier in the centre of the road. The main part of this road has one lane in each direction. On minor parts there are two lanes in one of the directions. The curve radii are large and the speed limit is 90 km/h. This road had the most even road surface of the three roads, with an international roughness index (IRI) of 1.0 (sd = 0.4).
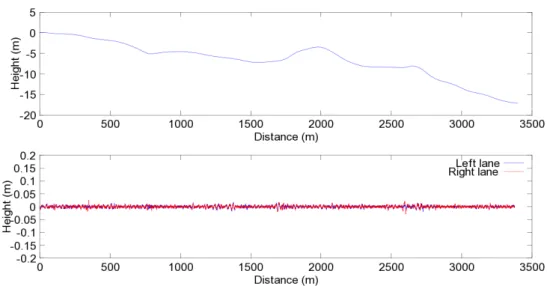
In the simulator this road was represented with only one lane in each direction (Figure 3). The measured longitudinal profiles that were used in the simulator are shown in Figure 4. The vibration profile was high-pass filtered to remove wavelengths larger or equal to 100 meters. In the simulator a small amount of oncoming traffic were used.
Road Simulator
Figure 3: Road Kisa, a road with middle barrier and smooth road surface.
Figure 4: Longitudinal slope and longitudinal vibration profile of road Kisa used in the simulator. The left and the right lane curves are nearly identical since the general profile of the road is similar for both lanes. The small deviations are due to differences between the lanes.
2.4.2 Road Skeda
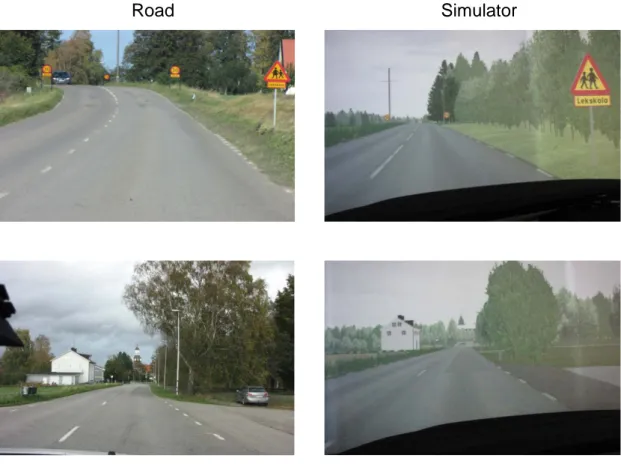
The Skeda road is a 3.4 kilometres long road stretch, 6.5 metre wide, running through the village of Skeda (Figure 5). It passes a church and a school and the speed limit differs between 30, 50 and 70 km/h. The road surface had an IRI value of 2.0 (sd = 0.9).
Road Simulator
Figure 5: Road Skeda. Near school area with speed limit 30 km/h (top row), and northbound towards Linköping with the church of Skeda. Notice the partly repaired road surface.
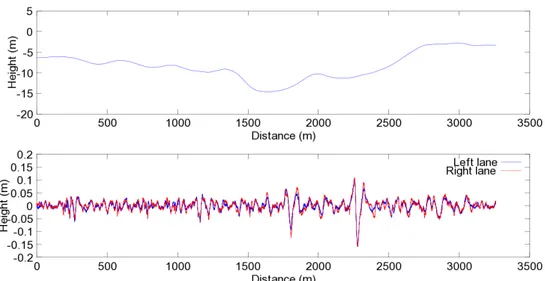
Longitudinal profiles for road Skeda are shown in Figure 6. The vibration profile was high-pass filtered to remove wavelengths larger or equal to 30 meters. This road also consisted of repair patches, edge deformations and potholes which were represented both visually and with sound and motion.
Figure 6: Longitudinal slope and longitudinal vibration profile of road Skeda used in the simulator.
2.4.3 Road Nykil
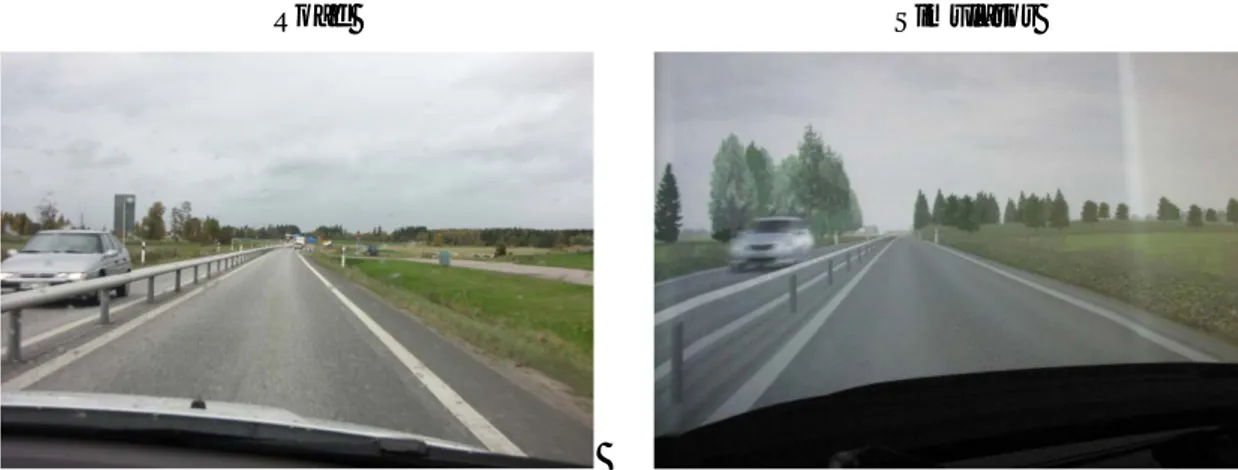
The Nykil road is a 3.4 kilometres long road stretch running through the countryside southwest of Linköping (Figure 7). The speed limit on this road is 80 km/h, the road width is 7 metres and the curve radii are comparatively small. This road had the most uneven road surfaces of the three with an IRI value of 2.6 (sd = 1.4). In fact, the surface on this road was so bad that it had to be partly repaired, which caused the experimental stretch to be moved a few kilometres.
Road Simulator
Figure 7: Road Nykil on the countryside, rather poor road surface.
Longitudinal profiles for road Nykil used in the simulator are shown in Figure 8. The vibration profile was high-pass filtered to remove wavelengths larger or equal to 100 meters. Since road Kisa and road Skeda are 3.4 km long, road Nykil was truncated to the same length. This road also consisted of repair patches which were represented both visually and with sound and motion in the simulator.
Figure 8: Longitudinal slope and longitudinal vibration profile of road Nykil used in the simulator.
2.5
Measurements
In the simulator, objective data were acquired directly from the simulator with a
sampling rate of 50 Hz. Logged measures included driven distance, speed, acceleration, lane position and 3D-coordinates in the simulated world.
In the car, objective data were logged with a sampling rate of 50 Hz using a data acquisition unit (Racelogic VBOX 3i, Buckingham, U.K.). The logger stored signals such as GPS position, distance travelled, speed, lane position, and the quality of the lane position measurement. Lane tracking data were obtained with a video based lane tracker (Mobileye AWS-4000, Amstelveen, the Netherlands).
Synchronization between the field data set and the simulator data set was achieved by matching the coordinates of the speed limit signs in the simulated world with the GPS coordinates of the signs in the real world. To avoid issues entailed by the individual differences in exact starting position, getting up to speed and slowing down after the road stretch, the signals were cropped to about 2500 meters.
The objective measure that was used to evaluate the absolute validity of the VTI Driving Simulator III was speed. Both in the simulator and in the field the vehicle’s actual speed was logged. However, the acquired speed is not identical to the speed presented on the speedometer, neither in the car nor in the simulator. Hence, logged data has been corrected to presented speed according to:
𝑠𝑝𝑒𝑒𝑑𝑜𝑚𝑒𝑡𝑒𝑟𝑐𝑎𝑟 = 2.42 + 1.02 ∙ 𝑎𝑐𝑡𝑢𝑎𝑙 𝑠𝑝𝑒𝑒𝑑
𝑠𝑝𝑒𝑒𝑑𝑜𝑚𝑒𝑡𝑒𝑟𝑠𝑖𝑚 = 1.29 + 1.00 ∙ 𝑎𝑐𝑡𝑢𝑎𝑙 𝑠𝑝𝑒𝑒𝑑
The equations were estimated using linear regression based on measured data in the range 50 – 90 km/h.
The subjective measures were the participants rating of evenness, quietness, and overall driving comfort on scales with 7 grades. The scale ranged from very
uneven/noisy/uncomfortable to very even/quiet/comfortable. These ratings were acquired once for each road stretch driven. After the experiment each participant was also asked to compare the road surface in the simulator with that in real traffic. This was
done with regard to realism, evenness, quietness and overall comfort. Furthermore they were asked to rate whether they recognised the road stretches from the first drive. Participants starting in the simulator stated if the recognised the stretches from the simulator when driving on the real road and vice versa.
2.5.1 Loss of data
During both the field and the simulator tests the experiment leader was instructed to note events that may affect the experiment. In real traffic such events were obstacles or slow moving vehicles causing speed reductions and/or lane changes. When analysing the spot speed, all road stretches including such events were excluded from further analyses. In real traffic this occurred occasionally during the tests, but not for all drivers. In all, 16 out of 144 road stretches were excluded due to unforeseen events. Further, problems with the data acquisition unit used in the field tests resulted in the exclusion of four participants. To sum it up, 40 out of 144 road stretches were excluded from further analyses due to problems with the data acquisition system or due to
unforeseen events in the traffic environment.
In addition to the abovementioned issues, the lane tracker frequently malfunctioned resulting in a large loss of lane position data. As a consequence lane position was only recorded for 13 participants. There was also a problem with calibration of the field device and also differences in the traffic environment in the field, resulting in different preconditions between the simulator session and the field trial. Due to the many issues encountered with the lane tracker, it was decided not to include lateral position in the analyses.
Due to the already mentioned problems with the data acquisition unit, participants 7, 8, 16 and 21 were excluded from the analyses.
No subjective data were lost and no data were lost during the simulator experiment.
2.6
Analyses
Objective data
Two separate statistical analyses were conducted; one analysis that investigated how speed deviated on the different road stretches and another analysis that investigated how speed deviated in the surroundings of the speed limitation signs on the road Skeda. All analyses have been conducted on both the actual speed and the estimated speed
presented by the speedometer.
The following factors were relevant for the analyses:
• Participant: Participant 1 – 24 (except 7, 8, 16 and 21).
• Road: The roads Kisa, Skeda and Nykil in both directions. Note that the three roads were driven in both directions are therefore treated as six independent roads.
• Simulator/Car: If the road stretch was driven in the simulator or in the field. • Segment: A number of consecutive spot speeds sampled as a function of
distance driven along the road stretches.
o General analysis: The spot speed vn, where n is the segment index, was
extracted every 25 meters. To obtain a more stable value, the spot speed was derived as the mean value in a 10-meter window surrounding each
25-meter mark from the velocity profile (the raw velocity data was sampled at 50Hz). Also the standard deviation sn in each 10-meter
window was calculated.
o Sign analysis: A spot speed was extracted every 10 meters ranging from 100 meters before the sign to 100 meters after the sign. The spot speeds were derived as the mean value in a 10-meter window surrounding each 10-meter mark.
• Presentation order: The participants drove on twelve road stretches in total. Presentation order is a number from 1 – 12 stating the order in which the road stretches was traversed. In order to let the participants get used to the
experimental situation with the road stretches and the grading scales, each route was divided into a first and second half. Only data from the second half was included in the analysis, thus limiting presentation order to the numbers 7 – 12. The statistical analysis consisted of a general linear model with the fixed factors
participant, road, simulator/car and segment. The interactions
participant*simulator/car and road*simulator/car were also included in the model. Presentation order was used as a covariate whereas segment was nested within road.
Because of high autocorrelation in the residuals, we simulated the same experimental design repeatedly 500 times with randomly generated residuals with the same auto correlation as in the real data. The p-values were then found approximately by comparing the observed F-statistics with the distribution of the simulated F-statistics. The significance level was set to five per cent.
Even though many factors had to be included in order to get a representative model, the only factor that is really interesting for the validation study is whether there is a
difference between the car and the simulator. For this reason, only this factor will be examined in the results.
Subjective data
The subjective ratings of evenness, quietness, and overall driving comfort were analysed using an analysis of variance (ANOVA). The independent factors, and interactions, were the same as for the analysis of objective data with the exception that
segment and presentation order were excluded. The significance level was set to five
per cent. The factor segment was not included since only one data point per road stretch was acquired and the factor presentation order was left out since the subjective ratings should be stable during the second half of the experiment.
3
Results
3.1
Objective data – driving behaviour
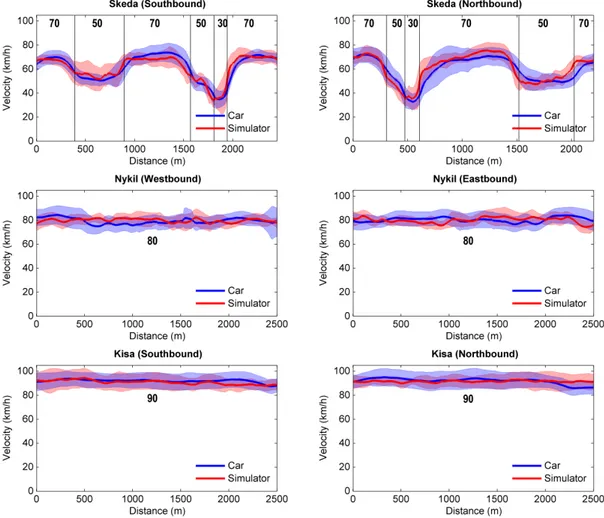
Driving performance is first illustrated in terms of speed profiles for each road. In Figure 9 the average speeds across all participants are presented as a function of
distance driven. The blue curve shows the average speed in the car, while the red curve shows the average speed in the simulator. The light blue area shows the standard deviation of the speed across participants in the car and the light red area the
corresponding interval in the simulator. The speed profile is presented for each road and direction. Speed limit signs on the road stretches are indicated by vertical lines. The graphs illustrate the similarity between the (actual) speed profiles acquired in real traffic compared to speed profiles acquired in the simulator. It can be noted that the standard deviation appear to be wider in real traffic compared to the simulator, meaning that the chosen speed differs more between drivers in real traffic.
Figure 9: Average speed across participants versus distance driven, for each road and direction. The shaded area represents the standard deviation across participants for each distance data point. Vertical lines mark speed limit changes and the numbers indicate the speed limit in the corresponding road sections.
Results regarding spot speeds with 25-meter resolution are summarized in Table 3. The general statistical analysis showed no significant differences in actual speed between simulator and car. Statistically significant differences in actual speed were found for all other factors described in section 2.6.
As described in section 2.5, the speed presented on the speedometer is higher than the acquired speed, both in the car and in the simulator. However, the difference is bigger in the car. For the speed shown by the speedometer, there was a significant difference between the car and the simulator.
For the variability in speed, there were significant differences for both actual speed and speedometer speed in the comparison between car and simulator. Note that this
(longitudinal within the same participant) is not comparable to the same standard deviation as in Figure 9 (snap shot across all participants).
Table 3: Summary of the marginalized mean and standard deviation of speed.
Simulator (km/h) Car (km/h)
Mean actual speed 77.11 76.95
Mean speedometer speed 78.54 80.54
SD actual speed 0.22 0.12
SD speedometer speed 0.22 0.12
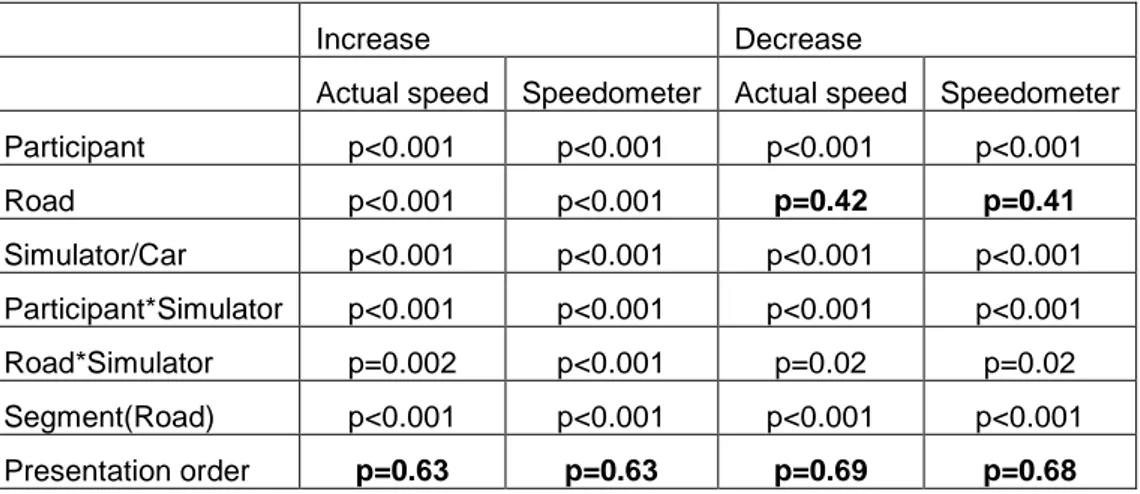
The statistical analysis of the spot speeds from the Skeda road, concerning the segments surrounding each speed limit sign, was divided in two separate analyses; one concerning speed increase and one concerning speed decrease. For the actual speed as well as speedometer speed, there were differences in velocity for all tested factors except
presentation order (both increase and decrease), and for road (only decrease), see Table
4.
Table 4: Summary results from the statistical analysis comparing the speed surrounding the speed limit signs on road Skeda.
Increase Decrease
Actual speed Speedometer Actual speed Speedometer Participant p<0.001 p<0.001 p<0.001 p<0.001 Road p<0.001 p<0.001 p=0.42 p=0.41 Simulator/Car p<0.001 p<0.001 p<0.001 p<0.001 Participant*Simulator p<0.001 p<0.001 p<0.001 p<0.001 Road*Simulator p=0.002 p<0.001 p=0.02 p=0.02 Segment(Road) p<0.001 p<0.001 p<0.001 p<0.001 Presentation order p=0.63 p=0.63 p=0.69 p=0.68
Scatter plots illustrating the resemblance between the spot speeds in the car versus the simulator on road Skeda are presented in Figure 10. Each data point represent the spot speed from the surrounding of each speed limit sign (±100 meters), separated into speed increments and speed decrements. It can be seen that most participants have a nearly one-to-one agreement between spot speeds acquired in the simulator and in the car (the black lines represent each participant and the slope is close to one for most participants). However, the slope is not really one, and the changed slope can be interpreted by
looking in Figure 9 where the speed reduces faster before the speed limit signs and increases faster after the sign in the simulator. This is probably also the reason to the statistically significant difference between car and simulator found in Table 4. The correlation coefficients between the speed recordings from the simulator versus the speed recordings from the car were 0.97 for increased speed limits as well as for decreased speed limits.
Figure 10: Scatter plot of speed acquired in the simulator versus speed acquired in the car on road Skeda, in both directions, using data surrounding the speed limit signs (±100 metres). The black lines represent the linear regression line for each participant and the red line is the corresponding linear regression line for all participants.
3.2
Subjective data – grades of evenness, quietness and comfort
A summary of the ANOVA results for the subjective data on evenness, quietness and comfort are presented in Table 5 whereas mean values are illustrated in Figure 11.
Table 5: Summary of the ANOVA results for evenness, quietness and comfort.
Evenness Quietness Comfort Participant p<0.001 p<0.001 p<0.001
Road p<0.001 p<0.001 p<0.001
Simulator/Car p=0.24 p=0.12 p=0.04
Participant*Simulator p=0.09 p=0.14 p=0.05
Road*Simulator p=0.002 p=0.24 p=0.24
The mean value of evenness from the three road stretches in the car versus the simulator shows that road Kisa was graded to have the most even road surface while road Nykil had the most uneven surface. Both the quietness and the comfort ratings followed the
same general pattern as evenness, see Figure 11. A multiple comparison test of population marginal means using Tukey's honestly significant difference criterion
showed that all ratings, from each road, were significantly different from all other roads.
Figure 11: Rating of evenness, quietness and comfort. Mean values and standard deviations for the three roads, in simulator and in car.
3.3
Subjective data – questionnaire
Questionnaire data from the experiment show that the participants recognized the road stretches when going from the simulated environment to the real road and vice versa (mean 5.8 ± 0.8, range 5 – 7, where 1 is not at all and 7 is in full). The participants also found the simulator to be realistic (mean 5.2 ± 1.3, range 1 – 7, where 1 is very
unrealistic and 7 is very realistic). Comparing evenness, quietness and comfort in the
simulator to the car indicates that there is little difference between the two
environments, see Table 6. The evenness could be graded between 1 (more uneven in the simulator) and 7 (more even in the simulator). Hence, four meant that the simulator
2 4 6 R a ti ng ( 1 -7) Evenness Kisa Sim Kisa Car Skeda Sim Skeda Car Nykil Sim Nykil Car 2 4 6 R a ti ng ( 1 -7) Quietness Kisa Sim Kisa Car Skeda Sim Skeda Car Nykil Sim Nykil Car 2 4 6 R a ti ng ( 1 -7) Comfort ratings Kisa Sim Kisa Car Skeda Sim Skeda Car Nykil Sim Nykil Car
was rated equal to real traffic, which is the ideal situation. Quietness could be graded between 1 (noisier in the simulator) and 7 (more quiet in the simulator), the overall comfort between 1 (more uncomfortable in the simulator) and 7 (more comfortable in the simulator), and the realism between 1 (not realistic at all) to 7 (very realistic).
Table 6: Comparison between simulator ride and car ride (Δ=sim-car) in rating of evenness, quietness and comfort (mean ± std). The grading 4 represent no difference between the car and the simulator.
Kisa Nykil Skeda Mean Range Δ Evenness 3.4 ± 1.3 3.7 ± 1.1 3.7 ± 1.2 3.6 ± 1.2 1 – 6 Δ Quietness 4.2 ± 1.5 4.0 ± 1.3 3.9 ± 1.3 4.1 ± 1.4 1 – 7 Δ Comfort 3.5 ± 1.4 3.5 ± 1.5 3.5 ± 1.5 3.6 ± 1.4 1 – 6 Realism 5.1 (1.2) 5.2 (1.4) 5.4 (1.2) 5.2 (1.3) 1 - 7
The drivers were asked to comment on the simulator features most urgent to improve. Those comments mainly concerned the accelerator pedal, the steering and the visual conditions. Some participants experienced that the accelerator pedal was too sensitive. The visual conditions caused some of the drivers to experience a sense of fatigue. They thought that the image was not clear enough.
4
Discussion
In this project, driving in VTI simulator III has been compared to driving on real roads in terms of road surface experience. The comparison included objective driving
parameters as well as subjective parameters from questionnaires and rating scales.
4.1
Statistical model
The most common statistical analysis that is used to compare simulated driving with real world driving is the ANOVA, where each road stretch is characterized by a single summary statistic such as the mean velocity. However, since the road stretches used in this study have varying characteristics along the roads (the most important issue being the many speed changes on road Skeda), it was decided to add the factor segment in the analysis. In ANOVA, an F test compare variation between means in relation to random variations and the number of observations. If the assumptions of normally distributed and independent random terms hold, a p-value can be found as a tail probability in an F distribution. However, due to the factor segment, our data has correlated error terms (segment sn is correlated with sn+1 in most cases). This means that the F statistic do not
have an F distribution with number of degrees of freedom based on the number of observations and the number of factors and factor levels as usual. A classic ANOVA could thus not be used to analyse the data set at hand. Instead, a slightly different approach will be used. We still assume that F describes variation between means in relation to random variation and number of observations and do not change the
equations for the observed F. However, we need to derive its distribution conditioning on the correlation and, of course, on H0. We have done this approximately by
simulating data with no treatment effects and with random terms generated as a sample with an expected correlation structure similar to what we have in our data. For each simulation, an ANOVA was done on the generated data and F was stored. This set of generated F values approximates the distribution needed to perform the F test and find a p-value.
4.2
Result discussion
4.2.1 Subjective ratings
A statistically significant difference in the subjective ratings evenness and quietness could not be found between the simulator and the car. Following the argumentation in previous validation studies (Mullen et al., 2011), this can be interpreted as if these variables have absolute validity. The comfort rating was shown to be higher in the car compared to the simulator, but since the general trend with higher comfort on smoother roads, this result can still be interpreted as relative validity. The fact that we cannot show any difference between simulator and real traffic for the evenness and quietness ratings does, of course, not prove that there are no such differences.
4.2.2 Speed
A common remark about driving simulators is that that it is difficult to achieve a realistic sensation of speed. It is therefore noteworthy that absolute validity was found for speed in general and that high agreement was found in the vicinity of the speed limit signs. A contributing factor to the high correspondence between field data and simulator
data is probably the rather short road stretches that was used in the study. The driver was indirectly reminded of the speed limit, and, when the speed limit changed, the driver was prone to look at the speedometer.
Since the speedometer speed is only estimated, the discussion section will focus on the results captured using actual speed. It is expected that there are differences in the factors participant (due to individual differences), road (due to different speed limits), segment (since the road characteristics such as slopes and curvature varies over the road
stretches), and presentation order (due to time on task effects such as familiarization). Earlier validation studies in Simulator I (Alm, 1996; Törnros, 1998) showed that the participant drove faster in the simulator compared to on the road. However, thanks to the improvements of the simulator models, such differences were no longer expected. This hypothesis was tested on the five per cent level, but could not be rejected, thus indicating absolute validity. One possible (and cautious) interpretation of this absent difference in velocity is that the improvements facilitated by the SHAKE technology entail more realistic simulations.
Despite the very similar speed profiles surrounding the speed limit signs in Figure 9, there is a statistically significant difference between the car and the simulator. This suggests relative validity of speed in the surrounding of the speed limit signs. Except from presentation order, all other factors were found to be significantly different in the surrounding of the signs. That a difference could not be shown for presentation order comes natural. Even though the drivers were driving in an unfamiliar car or in an unfamiliar simulator environment, they had the chance to learn how to operate the vehicle/simulator during the first half of the experiment (only road stretches 7 – 12 were included in the analyses). Also, it seems unlikely that the drivers should change their acceleration and deceleration patterns surrounding speed limit signs over the course of the experiment.
These results are in agreement with previous research which suggest that the
introduction of motion cues has a positive effect on simulator validity (Reymond et al., 2001; Wierwille et al., 1983), speed variability (Alm, 1996) and absolute speed
(Greenberg et al., 2002; Reymond et al., 2001; Soma et al., 1996). Our results indicate that by complementing the moving base platform in Simulator III with additional vibrations and noise, and by linking these motion cues to visual cues, the validity in terms of speed can be improved even further.
The visualisation of speed in Figure 9 indicates high agreement between data from the simulator and data from the real road. However, the variability in speed across the participants varies over time, especially in the simulator. Some participants experienced that the accelerator pedal was too sensitive. This could be a problem when driving on roads where the speed has to be frequently adjusted such as in curvy roads such as road Nykil or when the speed limit changes such as on road Skeda. On straight roads without speed limit changes, such as road Kisa, this speed variability between simulator data and real traffic data does not exist. It can also be seen in Figure 9 that the speed
variability across participants is generally greater in real traffic. One explanation might be that some traffic disturbance events were not noted by the experimental supervisors.
4.3
Limitations
When investigating driver behaviour, it is more interesting to investigate the speed given by the speedometer than the actual speed. Nonetheless, actual speed is what was
measured, while the speedometer speed was only calculated (according to section 2.5). We are therefore reluctant to make any further speculations on the results obtained for the speedometer speed.
We also chose not to pursue any analyses on lateral position due to the many data acquisition problems that arose. This is unfortunate since it is a parameter that is often used in our studies, especially in terms of lane position variability.
During the field trial, we aimed at conducting all trials in good weather. However, despite this intention, some recordings were made during light rainfall (no water on the road) and several recordings were made in windy conditions. This might have
influenced the visual perception. Wind may also have influenced the subjective ratings related to sound, however, light rain was judged not to affect the quietness ratings. The video projectors used in the simulator were unfortunately outdated and in need of replacement, resulting in a rather dark and dim presentation of the road and the
surroundings. This might have affected the drivers and caused tiredness, which a few of them commented on.
When implementing the three roads in the simulator, the longitudinal vibration profiles were filtered with different wavelengths ranging from 30 – 100 meters. That the cut-off frequencies of the filters differed was unintentional. It is difficult to subjectively feel a difference between these filter settings so the impact on behavioural data should be minor.
As already mentioned, the road surface measurements had some limitations why the longitudinal vibration profiles were repeated to fit the size of the longitudinal slope profiles. This approach was mainly used to road Kisa which had a very smooth road surface. Repeating this particular vibration profile was deemed to have a negligible effect on the perceived impression of the road.
From a methodological point of view, it would have been interesting to add a third condition in addition to real-world and simulator, namely simulator without the SHAKE technology. Only then would we have had the possibility to present conclusive results about the advantage of adding the new sound, vibration and visualisation modules.
4.4
Possible future studies
Based on the positive findings in this study, corresponding model improvements and validations are recommended for the truck simulator. Furthermore, an implementation of the SHAKE models in the VTI simulator IV is also desired. Simulator IV has a different motion system, not including a vibration table. Hence, another technique is required to create vibrations.
When simulating an existing real road, a major effort is to create the road alignment and the road surface. It is hence desirable to simplify these procedures. For example, this could be achieved by creating a library of IRI-specific road surfaces from which the experiment designer could just pick and choose. Another example is creation of the simulator road alignment by direct use of road data available on the internet (e.g. from Google Earth or OpenStreetMap). When successful, this would be time saving and create a lot of new opportunities.
New projectors were installed in simulator III after this trial took place, resulting in a higher resolution and a sharper image. This in turn reveals weaknesses in the image presentation, which should be addressed.
References
Alm, H., 1996. Driving simulators as research tools: a validation study based on the VTI driving simulator, VTI mono. Swedish National Road and Transport Research Institute, Linköping, Sweden.
Bella, F., 2005. Validation of a Driving Simulator for Work Zone Design.
Transportation Research Record: Journal of the Transportation Research Board(1937),
136-144.
Bella, F., 2008. Driving simulator for speed research on two-lane rural roads. Accident
Analysis & Prevention 40(3), 1078-1087.
Blana, E., 1996. Driving simulator validation studies: a literature review, ITS working
paper. University of Leeds, Leeds, UK.
Bolling, A., Genell, A., Hjort, M., Källgren, L., Lidström, M., Sjögren, L., 2012. Improving the Realism in the VTI Driving Simulators: SHAKE Final Report. Swedish Road and Transport Research Institute (VTI) Linköping, Sweden.
Cossalter, V., Lot, R., Rota, S., 2010. Objective and Subjective Evaluation of an Advanced Motorcycle Riding Simulator. European Transport Research Review 2(4), 223-233.
Engen, T., 2008. Use and validation of driving simulators, Fakultet for
ingeniørvitenskap og teknologi. Norwegian University of Science and Technology,
Thesis 2008:200, Trondheim.
Forsberg, I., Göransson, N.-G., 2005. Tillståndsmätning av observationssträckor med Laser RST. Swedish Road and Transport Research Institute (VTI) Linköping, Sweden. Godley, S.T., Triggs, T.J., Fildes, B.N., 2002. Driving simulator validation for speed research. Accident Analysis & Prevention 34(5), 589-600.
Green, P., 2005. How driving simulator data quality can be improved, Driving
Simulation Conference North America, Orlando, FL.
Greenberg, J., Artz, B., Cathey, L., 2002. The effect of lateral motion cues during simulated driving, Driving Simulation Conference North America, Dearborn, MI. Hakamies-Blomqvist, L., Östlund, J., Henriksson, P., Heikkinen, S., 2000. Elderly car drivers in a simulator: a validation study, VTI Rapport. Swedish National Road and Transport Research Institute, Linköping, Sweden.
Harms, L., 1996. Driving performance on a real road and in a driving simulator: results of a validation study, VTI Särtryck. Swedish National Road and Transport Research Institute, Linköping, Sweden.
Jamson, H., 1999. Curve negotiation in the Leeds Driving Simulator: the role of driver experience. Engineering in Psychology and Cognitive Ergonomics 3, 351-358.
Jamson, H., 2011. Cross-platform validation issues, in: Fisher, D.L., Rizzo, M., Caird, J., Lee, J.D. (Eds.), Handbook of Driving Simulation for Engineering, Medicine, and
Psychology. CRC Press, Boca Raton, FL, pp. 12:11-12:13.
Kaptein, N.A., Theeuwes, J., Van Der Horst, R., 1996. Driving simulator validity: Some considerations. Transportation research record 1550, 30-36.
Kemeny, A., Panerai, F., 2003. Evaluating perception in driving simulation experiments. Trends Cogn Sci 7(1), 31-37.
Klee, H., Bauer, C., Radwan, E., Al-Deek, H., 1999. Preliminary validation of driving simulator based on forward speed. Transportation Research Record 1689, 33-39.
Mayhew, D.R., Simpson, H.M., Wood, K.M., Lonero, L., Clinton, K.M., Johnson, A.G., 2011. On-road and simulated driving: Concurrent and discriminant validation. Journal
of Safety Research 42(4), 267-275.
McAvoy, D.S., Schattler, K.L., Datta, T.K., 2007. Driving Simulator Validation for Nighttime Construction Work Zone Devices. Transportation Research Record: Journal
of the Transportation Research Board(2015), 55-63.
McGehee, D.V., Mazzae, E.N., Baldwin, G.H.S., 2000. Driver reaction time in crash avoidance research: Validation of a driving simulator study on a test track, Human
Factors and Ergonomics Society Annual Meeting, pp. 3:320-323:323.
Mullen, N., Charlton, J., Devlin, A., M., B., 2011. Simulator validity: Behaviours observed on the simulator and on the road, in: Fisher, D.L., Rizzo, M., Caird, J., Lee, J.D. (Eds.), Handbook of Driving Simulation for Engineering, Medicine, and
Psychology. CRC Press, Boca Raton, FL, pp. 12:11-12:13.
Reimer, B., D'Ambrosio, L.A., Coughun, J.F., Kafrissen, M.E., Biederman, J., 2006. Using self-reported data to assess the validity of driving simulation data. Behav Res
Methods 38(2), 314-324.
Reymond, G., Kemeny, A., Droulez, J., Berthoz, A., 2001. Role of lateral acceleration in curve driving: driver model and experiments on a real vehicle and a driving
simulator. Hum Factors 43(3), 483-495.
Senserrick, T.M., Brown, T., Quistberg, D.A., Marshall, D., Winston, F.K., 2007. Validation of Simulated Assessment on Teen Driver Speed Management on Rural Roads. Association for the Advancement of Automotive Medicine, pp. 525-536. Shechtman, O., Classen, S., Awadzi, K., Mann, W., 2009. Comparison of Driving Errors Between On-the-Road and Simulated Driving Assessment: A Validation Study.
Traffic Injury Prevention 10(4), 379-385.
Shinar, D., Ronen, A., 2007. Validation of Speed Perception and Production in a Single Screen Simulator. Advances in Transportation Studies, Special issue, 51-56.
Soma, H., Hiramatsu, K., Satoh, K., Uno, H., 1996. System architecture of the JARI driving simulator and its validation, Symposium on the design and validation of driving
simulators, Valencia, Spain.
Törnros, J., 1998. Driving behaviour in a real and a simulated road tunnel - a validation study. Accident Analysis & Prevention 30(4), 497-503.
Wierwille, W.W., Casali, J.G., Repa, B.S., 1983. Driver steering reaction time to
abrupt-onset crosswinds, as measured in a moving-base driving simulator. Hum Factors 25(1), 103-116.
VTI, 2012. VTI's simulator facilities.
Yan, X., Abdel-Aty, M., Radwan, E., Wang, X., Chilakapati, P., 2008. Validating a driving simulator using surrogate safety measures. Accident Analysis & Prevention 40(1), 274-288.
Appendix 1
Deltagarinstruktion
FörsöketDu kommer att få köra två olika försök, det ena på riktiga vägar och det andra i VTI:s körsimulator. Försöksledaren berättar vilket av de två försöken som kommer först. Både på väg och i simulatorn kommer du att få köra på en slinga med ett antal olika vägtyper. På varje vägsträcka vill vi att du svarar på tre frågor relaterade till vägytan:
1. Hur ojämn/jämn tycker du att vägytan är?
Gör en skattning från 1 till 7 där 1 = mycket ojämn och 7 = mycket jämn.
2. Hur bullrig/tyst tycker du att vägytan är?
Gör en skattning från 1 till 7 där 1 = mycket bullrig och 7 = mycket tyst.
3. Hur komfortabel tycker du att vägytan är?
Gör en skattning från 1 till 7 där 1 = mycket okomfortabel och 7 = mycket komfortabel. Komfortabel är här tänkt att täcka in buller, skak, rattkänsla, bekvämlighet med mera - alltså en helhetsbedömning av hur du upplever vägytan.
Du kommer att få köra varje vägsträcka två gånger i varje riktning och du ska svara på de tre frågorna efter varje körning. För varje gång du kör en sträckan ska du tänka över dina svar. Det är meningen att du ska kunna ändra din bedömning så du behöver alltså inte ge samma svar båda gångerna du kör en sträcka.
Vägförsöket
Du kommer att få köra på en slinga med tre delsträckor i anslutning till riksväg 34 (mot Nykil samt i närheten av Skeda). Bilen kommer du att få bekanta dig med på vägen dit. Själva försöket kommer att ta cirka 60 minuter.
Simulatorförsöket
Före försöket får du köra en träningsrunda för att vänja dig vid simulatorn.
Träningen tar ca 5 minuter. Själva försöket kommer sedan att ta cirka 45 minuter att köra.
Allmänt
Det är olika hastighet på olika vägsträckor, kör som du normalt brukar köra.
På väg:
Din och andras säkerhet kommer i första hand, fokusera på din körning. Du kan när som helst avbryta försöket om någonting inte känns bra.
I simulatorn:
Försöksledaren kan under hela försöket se och höra dig i simulatorn. Bortsett från de tre frågorna kommer försöksledaren inte att prata med dig under försöket men det är viktigt att du säger till så fort någonting inte känns bra. Du kan avbryta försöket när som helst,
det gör du genom att tala om för försöksledaren att du vill avsluta försöket. Du ska inte öppna dörren till simulatorn själv – försöksledaren kommer och hämtar dig.
2011-09-19
Shake
Informerat samtycke
Undertecknad har tagit del av den skriftliga och muntliga informationen angående
studien Shake och accepterar att delta på angivna villkor. Jag vet att jag har rätt att när som helst avbryta studien utan närmare förklaring.
Datum: _____________
Underskrift: ________________________________
Namnförtydligande: ________________________
Anne Bolling Projektledare
Försöksperson nr ______
Datum______
Bakgrundsfrågor
1. Vilket år är du född? ______________________
2. Vilket år tog du körkort? _______________________
3. Hur många mil kör du per år? _____________________
4. I vilken trafikmiljö kör du oftast? Ange uppskattad andel körning i procent för de två trafikmiljöerna:
Landsvägskörning ________________
Stadskörning_____________
Hur skulle du beskriva dig som förare och hur du kör?
Skatta mellan 1 och 7 på varje aspekt nedan
1 2 3 4 5 6 7 Dålig Bra Långsam Snabb Ängslig Lugn Försiktig Risktagande Tveksam Bestämd Koncentrerad Lättdistraherad Nervös Trygg Defensiv Offensiv Uppmärksam Ouppmärksam God framförhållning Impulsiv Roligt Tråkigt
Komfortfrågor (innan)
På följande frågor ska du ringa in en av de 7 siffrorna, där 1 innebär att du känner dig mycket obekväm och 7 innebär att du känner dig mycket bekväm.
Samtliga frågor börjar med: Hur bekväm känner du dig med att köra i dagsljus……
5. och lätt regnväder?
Mycket obekväm 1 2 3 4 5 6 7 Mycket bekväm
6. och kraftigt regnväder?
Mycket obekväm 1 2 3 4 5 6 7 Mycket bekväm
7. med snö och is på vägarna?
Mycket obekväm 1 2 3 4 5 6 7 Mycket bekväm
8. och du kan bli bländad av solljus?
Mycket obekväm 1 2 3 4 5 6 7 Mycket bekväm
9. och du hamnar i ett plötsligt snöoväder?
Mycket obekväm 1 2 3 4 5 6 7 Mycket bekväm
10. på platser där du inte kört tidigare?
Mycket obekväm 1 2 3 4 5 6 7 Mycket bekväm
11. och följa fartrytmen fast den går över hastighetsbegränsningen på 110 km/h?
Mycket obekväm 1 2 3 4 5 6 7 Mycket bekväm
12. och där andra bilar ligger för nära bakom dig?
Mycket obekväm 1 2 3 4 5 6 7 Mycket bekväm
13. och andra bilar kör om dig på olämpliga platser?
Mycket obekväm 1 2 3 4 5 6 7 Mycket bekväm
14. och andra förare verkar ouppmärksamma i din närhet?